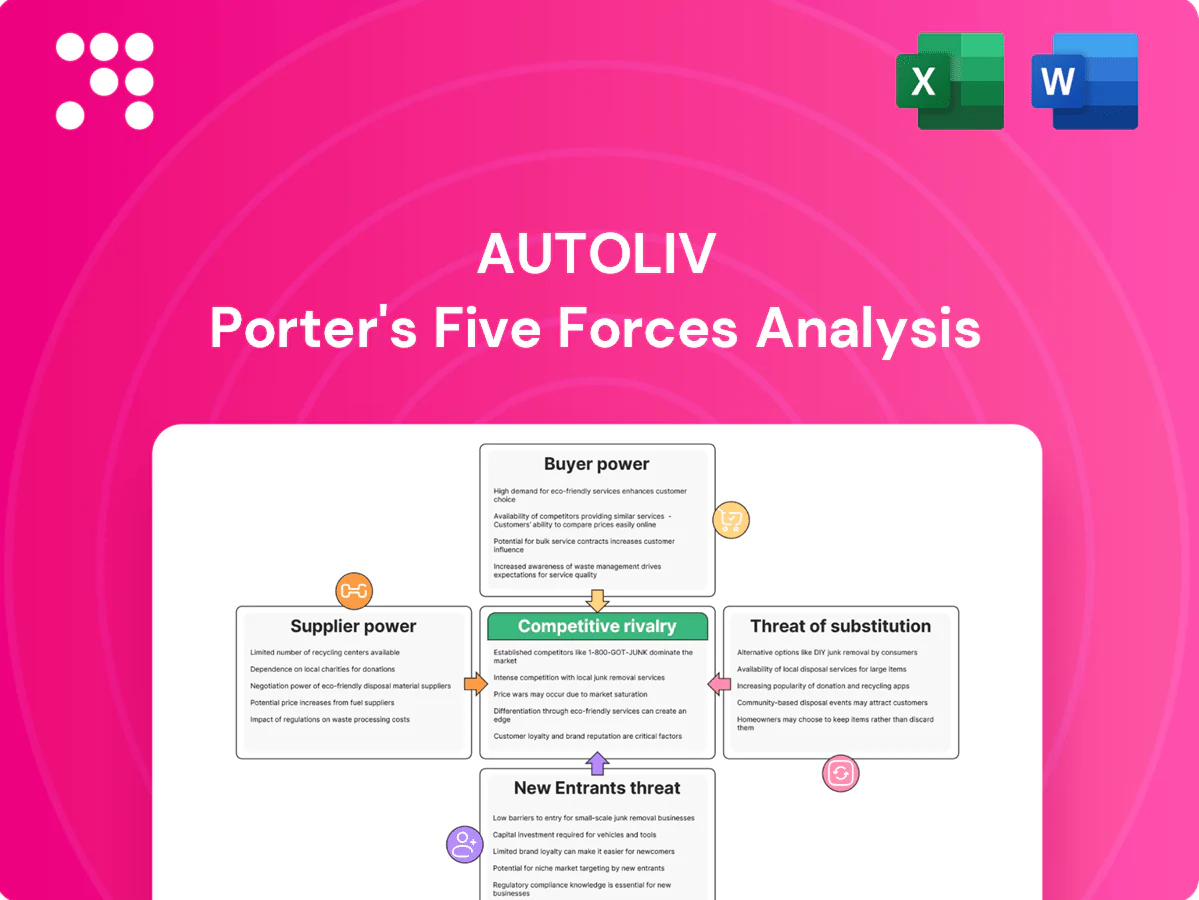
Autoliv Porter's Five Forces Analysis

Don't Miss the Bigger Picture
Autoliv faces intense competitive rivalry and evolving supplier dynamics driven by advanced safety tech and consolidation, while buyer power and regulatory pressures shape margin resilience; threat of new entrants and substitutes remains moderate as EV and ADAS trends reshape the landscape. This brief snapshot only scratches the surface. Unlock the full Porter's Five Forces Analysis to explore Autoliv’s competitive dynamics in detail.
Suppliers Bargaining Power

Specialized inputs and chemicals
Autoliv relies on specialized propellants, pyrotechnics, precision inflators, webbing and advanced textiles sourced from a handful of qualified suppliers, and safety-critical specifications typically extend supplier qualification cycles to 12–24 months.
This narrow pool concentrates bargaining power with niche suppliers, increasing price and delivery leverage and elevating supply-risk for safety systems.
Dual-sourcing is widely used to mitigate risk but cannot fully eliminate dependency where single qualified vendors remain for certain pyrotechnic components.
Semiconductor and electronics content
Passive and active safety electronics depend on sensors, MCUs and ASICs that triggered the 2020–22 chip crisis, with IHS Markit estimating about 7.7 million lost vehicle builds in 2021, giving suppliers pricing and allocation leverage. High foundry utilization and design-specific ASICs raise switching costs for Autoliv, while automotive-grade lead times of 40–52 weeks during upcycles lock in supplier influence.

Quality, certification, and liability burden
Zero-defect requirements such as IATF 16949, PPAP and ASIL drastically narrow the pool of eligible suppliers and raise onboarding and recurring audit costs for Autoliv. Any defect exposure magnifies supplier bargaining power through indemnity and warranty negotiations, shifting risk onto OEMs or increasing supplier prices. Stringent traceability and documentation reduce quick substitution of vendors. This compliance moat advantages entrenched, certified suppliers over new entrants.

Logistics and geopolitical exposure
Autoliv’s suppliers face resin, steel and chemical transport constraints, plus tariffs and export controls that amplify supplier leverage; US steel Section 232 tariffs remain at 25%, raising input risk. Regional shocks (Europe energy swings, Asian port disruptions) shift leverage to local suppliers, and nearshoring reduces exposure but can lift input costs short term. Supply-resilience programs prioritize reliability over lowest price, increasing procurement spend.
- Global footprint: operations in >25 countries
- US steel tariff: 25% (Section 232)
- Nearshoring: raises short-term input cost pressure
- Resilience trade-off: higher cost for reliability
Scale offsets and supplier development
Autoliv’s high volumes (2024 net sales ~USD 8.3bn) enable volume-based contracts and VAVE programs that claw back costs, often recovering low-single-digit percentage points of COGS. Long-term agreements and joint process improvements with tier-1s rebalance bargaining power via shared CAPEX and yield gains. Material pass-through clauses protect margins but dilute upside in periods of deflation. Net effect: moderate supplier power with episodic spikes tied to commodity cycles.
- Volumes: 2024 sales ~USD 8.3bn
- Cost recovery: VAVE/volume contracts recover low-single-digit COGS%
- Contracts: long-term + joint process improvements reduce supplier leverage
- Risk: pass-through limits upside in deflation; episodic supplier power spikes
12–24m, 40–52w lead times tighten supplier power
Autoliv faces concentrated supplier power due to niche pyrotechnics, 12–24 month qualification cycles and single-source pyros; chip/ASIC shortages and 40–52 week automotive lead times further raise switching costs. 2024 sales (~USD 8.3bn) give volume leverage and VAVE recoveries (low-single-digit COGS%), but episodic commodity and regional shocks amplify supplier bargaining. Compliance (IATF16949/ASIL) and tariffs (US steel 25%) cement incumbent supplier advantage.
| Metric | Value |
|---|---|
| 2024 net sales | ~USD 8.3bn |
| Qualification cycle | 12–24 months |
| Lead times (upcycle) | 40–52 weeks |
| US steel tariff | 25% (Section 232) |
What is included in the product
 Detailed Word Document
Tailored Porter's Five Forces analysis for Autoliv uncovering key drivers of competition, supplier and buyer power, threat of substitutes and new entrants, plus disruptive trends and market protections that shape pricing, profitability and strategic positioning.

 Customizable Excel Spreadsheet
A compact, one-sheet Porter's Five Forces for Autoliv that visualizes competitive pressures with an editable radar chart—ready for pitch decks, board slides, or integration into Excel dashboards; no macros required and easily customized to reflect supply-chain, safety-regulation, and EV-era shifts.
Customers Bargaining Power

Concentrated OEM customer base
Global automakers buy safety systems at scale and run aggressive sourcing; global light-vehicle production was about 79 million units in 2024, concentrating purchasing power among a few OEMs. Few large buyers exert strong pricing pressure and enforce typical annual cost-down targets of roughly 3–5%, squeezing supplier margins. Platform awards tend to be winner-take-most, and Autoliv’s dependence on top OEMs amplifies buyer leverage and contract risk.
High switching costs but planned re-sourcing
Validation, tooling and regulatory approvals typically require 12–24 months, making mid-cycle switching rare for Autoliv systems; however OEMs re-source at platform refreshes, which on average occur every 6–7 years, to reset pricing. Multi-year nominations (commonly 3–5 years) temper immediate customer power but do not eliminate long-run leverage. Design-in creates stickiness, not immunity to later re-sourcing.

Commoditized perception in mature lines
Seatbelts and standard airbags are largely commoditized in mature lines, driving intense OEM price benchmarking and squeezing margins; Autoliv held roughly one-third of the global passive-safety market in 2024, underscoring scale-driven pricing pressure. Differentiation via performance, weight and recyclability improves win rates but is often under-monetized by buyers. OEMs increasingly demand transparency and should-cost models, and procurement programs frequently prioritize cost leadership to capture volume contracts.

Co-development and performance specs
Joint engineering on new platforms deepens integration and can reduce direct price pressure, while Autoliv reported roughly US$8.6bn in 2024 sales, reflecting scale that strengthens its negotiating position. Buyers increasingly apply should-cost and target pricing to capture gains, and performance upgrades are often exchanged for price concessions. Collaboration moderates but does not erase buyer power as OEMs still leverage volume contracts and cost engineering.
- Joint engineering reduces price pressure; OEMs use should-cost/target pricing; performance-for-price trades common; collaboration moderates but doesn't remove buyer power
Aftermarket and regulations dilute leverage
Aftermarket depth and regulatory mandates constrain buyer leverage by stabilizing safety-system volumes; mandatory fitment across major markets (EU, US, China) reduces risk of abrupt demand collapse and supports predictable content per vehicle. OEM mix and regional standard differences still allow pricing pressure where luxury content varies, keeping net buyer power elevated despite regulatory buffers.
- Regulatory fitment: reduces volume volatility
- OEM mix: drives price sensitivity
- Regional standards: create pricing pockets
- Net buyer power: remains high
OEM leverage: 79m, 3–5% p.a., 6–7yr
Global OEMs (79m light vehicles in 2024) concentrate buying power, enforce 3–5% annual cost-downs and use winner-take-most awards, amplifying leverage versus Autoliv (US$8.6bn sales, ~33% passive-safety share in 2024).
Validation (12–24 months) and 3–5 year nominations limit mid-cycle switching, but 6–7 year platform refreshes reset pricing; technical differentiation is valuable yet often under-monetized.
| Metric | 2024 | Impact |
|---|---|---|
| Global LV production | 79m | Concentrated buyer power |
| Autoliv sales | US$8.6bn | Scale vs OEM leverage |
| Passive-safety share | ~33% | Price pressure |
| Cost-down targets | 3–5% p.a. | Margin squeeze |
| Platform refresh | 6–7 yrs | Resourcing events |
Full Version Awaits
Autoliv Porter's Five Forces Analysis
This preview shows the exact Autoliv Porter's Five Forces analysis you'll receive upon purchase—no placeholders or mockups. It contains the full, professionally formatted assessment of industry rivalry, supplier and buyer power, threats of entry and substitutes. You'll get instant access to this same file after payment, ready for download and use. No surprises—what you see is what you get.

Don't Miss the Bigger Picture
Autoliv faces intense competitive rivalry and evolving supplier dynamics driven by advanced safety tech and consolidation, while buyer power and regulatory pressures shape margin resilience; threat of new entrants and substitutes remains moderate as EV and ADAS trends reshape the landscape. This brief snapshot only scratches the surface. Unlock the full Porter's Five Forces Analysis to explore Autoliv’s competitive dynamics in detail.
Suppliers Bargaining Power
Specialized inputs and chemicals
Autoliv relies on specialized propellants, pyrotechnics, precision inflators, webbing and advanced textiles sourced from a handful of qualified suppliers, and safety-critical specifications typically extend supplier qualification cycles to 12–24 months.
This narrow pool concentrates bargaining power with niche suppliers, increasing price and delivery leverage and elevating supply-risk for safety systems.
Dual-sourcing is widely used to mitigate risk but cannot fully eliminate dependency where single qualified vendors remain for certain pyrotechnic components.
Semiconductor and electronics content
Passive and active safety electronics depend on sensors, MCUs and ASICs that triggered the 2020–22 chip crisis, with IHS Markit estimating about 7.7 million lost vehicle builds in 2021, giving suppliers pricing and allocation leverage. High foundry utilization and design-specific ASICs raise switching costs for Autoliv, while automotive-grade lead times of 40–52 weeks during upcycles lock in supplier influence.
Quality, certification, and liability burden
Zero-defect requirements such as IATF 16949, PPAP and ASIL drastically narrow the pool of eligible suppliers and raise onboarding and recurring audit costs for Autoliv. Any defect exposure magnifies supplier bargaining power through indemnity and warranty negotiations, shifting risk onto OEMs or increasing supplier prices. Stringent traceability and documentation reduce quick substitution of vendors. This compliance moat advantages entrenched, certified suppliers over new entrants.
Logistics and geopolitical exposure
Autoliv’s suppliers face resin, steel and chemical transport constraints, plus tariffs and export controls that amplify supplier leverage; US steel Section 232 tariffs remain at 25%, raising input risk. Regional shocks (Europe energy swings, Asian port disruptions) shift leverage to local suppliers, and nearshoring reduces exposure but can lift input costs short term. Supply-resilience programs prioritize reliability over lowest price, increasing procurement spend.
- Global footprint: operations in >25 countries
- US steel tariff: 25% (Section 232)
- Nearshoring: raises short-term input cost pressure
- Resilience trade-off: higher cost for reliability
Scale offsets and supplier development
Autoliv’s high volumes (2024 net sales ~USD 8.3bn) enable volume-based contracts and VAVE programs that claw back costs, often recovering low-single-digit percentage points of COGS. Long-term agreements and joint process improvements with tier-1s rebalance bargaining power via shared CAPEX and yield gains. Material pass-through clauses protect margins but dilute upside in periods of deflation. Net effect: moderate supplier power with episodic spikes tied to commodity cycles.
- Volumes: 2024 sales ~USD 8.3bn
- Cost recovery: VAVE/volume contracts recover low-single-digit COGS%
- Contracts: long-term + joint process improvements reduce supplier leverage
- Risk: pass-through limits upside in deflation; episodic supplier power spikes
12–24m, 40–52w lead times tighten supplier power
Autoliv faces concentrated supplier power due to niche pyrotechnics, 12–24 month qualification cycles and single-source pyros; chip/ASIC shortages and 40–52 week automotive lead times further raise switching costs. 2024 sales (~USD 8.3bn) give volume leverage and VAVE recoveries (low-single-digit COGS%), but episodic commodity and regional shocks amplify supplier bargaining. Compliance (IATF16949/ASIL) and tariffs (US steel 25%) cement incumbent supplier advantage.
| Metric | Value |
|---|---|
| 2024 net sales | ~USD 8.3bn |
| Qualification cycle | 12–24 months |
| Lead times (upcycle) | 40–52 weeks |
| US steel tariff | 25% (Section 232) |
What is included in the product
Detailed Word Document
Tailored Porter's Five Forces analysis for Autoliv uncovering key drivers of competition, supplier and buyer power, threat of substitutes and new entrants, plus disruptive trends and market protections that shape pricing, profitability and strategic positioning.
Customizable Excel Spreadsheet
A compact, one-sheet Porter's Five Forces for Autoliv that visualizes competitive pressures with an editable radar chart—ready for pitch decks, board slides, or integration into Excel dashboards; no macros required and easily customized to reflect supply-chain, safety-regulation, and EV-era shifts.
Customers Bargaining Power
Concentrated OEM customer base
Global automakers buy safety systems at scale and run aggressive sourcing; global light-vehicle production was about 79 million units in 2024, concentrating purchasing power among a few OEMs. Few large buyers exert strong pricing pressure and enforce typical annual cost-down targets of roughly 3–5%, squeezing supplier margins. Platform awards tend to be winner-take-most, and Autoliv’s dependence on top OEMs amplifies buyer leverage and contract risk.
High switching costs but planned re-sourcing
Validation, tooling and regulatory approvals typically require 12–24 months, making mid-cycle switching rare for Autoliv systems; however OEMs re-source at platform refreshes, which on average occur every 6–7 years, to reset pricing. Multi-year nominations (commonly 3–5 years) temper immediate customer power but do not eliminate long-run leverage. Design-in creates stickiness, not immunity to later re-sourcing.
Commoditized perception in mature lines
Seatbelts and standard airbags are largely commoditized in mature lines, driving intense OEM price benchmarking and squeezing margins; Autoliv held roughly one-third of the global passive-safety market in 2024, underscoring scale-driven pricing pressure. Differentiation via performance, weight and recyclability improves win rates but is often under-monetized by buyers. OEMs increasingly demand transparency and should-cost models, and procurement programs frequently prioritize cost leadership to capture volume contracts.
Co-development and performance specs
Joint engineering on new platforms deepens integration and can reduce direct price pressure, while Autoliv reported roughly US$8.6bn in 2024 sales, reflecting scale that strengthens its negotiating position. Buyers increasingly apply should-cost and target pricing to capture gains, and performance upgrades are often exchanged for price concessions. Collaboration moderates but does not erase buyer power as OEMs still leverage volume contracts and cost engineering.
- Joint engineering reduces price pressure; OEMs use should-cost/target pricing; performance-for-price trades common; collaboration moderates but doesn't remove buyer power
Aftermarket and regulations dilute leverage
Aftermarket depth and regulatory mandates constrain buyer leverage by stabilizing safety-system volumes; mandatory fitment across major markets (EU, US, China) reduces risk of abrupt demand collapse and supports predictable content per vehicle. OEM mix and regional standard differences still allow pricing pressure where luxury content varies, keeping net buyer power elevated despite regulatory buffers.
- Regulatory fitment: reduces volume volatility
- OEM mix: drives price sensitivity
- Regional standards: create pricing pockets
- Net buyer power: remains high
OEM leverage: 79m, 3–5% p.a., 6–7yr
Global OEMs (79m light vehicles in 2024) concentrate buying power, enforce 3–5% annual cost-downs and use winner-take-most awards, amplifying leverage versus Autoliv (US$8.6bn sales, ~33% passive-safety share in 2024).
Validation (12–24 months) and 3–5 year nominations limit mid-cycle switching, but 6–7 year platform refreshes reset pricing; technical differentiation is valuable yet often under-monetized.
| Metric | 2024 | Impact |
|---|---|---|
| Global LV production | 79m | Concentrated buyer power |
| Autoliv sales | US$8.6bn | Scale vs OEM leverage |
| Passive-safety share | ~33% | Price pressure |
| Cost-down targets | 3–5% p.a. | Margin squeeze |
| Platform refresh | 6–7 yrs | Resourcing events |
Full Version Awaits
Autoliv Porter's Five Forces Analysis
This preview shows the exact Autoliv Porter's Five Forces analysis you'll receive upon purchase—no placeholders or mockups. It contains the full, professionally formatted assessment of industry rivalry, supplier and buyer power, threats of entry and substitutes. You'll get instant access to this same file after payment, ready for download and use. No surprises—what you see is what you get.
Original: $10.00
-65%$10.00
$3.50Description
Don't Miss the Bigger Picture
Autoliv faces intense competitive rivalry and evolving supplier dynamics driven by advanced safety tech and consolidation, while buyer power and regulatory pressures shape margin resilience; threat of new entrants and substitutes remains moderate as EV and ADAS trends reshape the landscape. This brief snapshot only scratches the surface. Unlock the full Porter's Five Forces Analysis to explore Autoliv’s competitive dynamics in detail.
Suppliers Bargaining Power
Specialized inputs and chemicals
Autoliv relies on specialized propellants, pyrotechnics, precision inflators, webbing and advanced textiles sourced from a handful of qualified suppliers, and safety-critical specifications typically extend supplier qualification cycles to 12–24 months.
This narrow pool concentrates bargaining power with niche suppliers, increasing price and delivery leverage and elevating supply-risk for safety systems.
Dual-sourcing is widely used to mitigate risk but cannot fully eliminate dependency where single qualified vendors remain for certain pyrotechnic components.
Semiconductor and electronics content
Passive and active safety electronics depend on sensors, MCUs and ASICs that triggered the 2020–22 chip crisis, with IHS Markit estimating about 7.7 million lost vehicle builds in 2021, giving suppliers pricing and allocation leverage. High foundry utilization and design-specific ASICs raise switching costs for Autoliv, while automotive-grade lead times of 40–52 weeks during upcycles lock in supplier influence.
Quality, certification, and liability burden
Zero-defect requirements such as IATF 16949, PPAP and ASIL drastically narrow the pool of eligible suppliers and raise onboarding and recurring audit costs for Autoliv. Any defect exposure magnifies supplier bargaining power through indemnity and warranty negotiations, shifting risk onto OEMs or increasing supplier prices. Stringent traceability and documentation reduce quick substitution of vendors. This compliance moat advantages entrenched, certified suppliers over new entrants.
Logistics and geopolitical exposure
Autoliv’s suppliers face resin, steel and chemical transport constraints, plus tariffs and export controls that amplify supplier leverage; US steel Section 232 tariffs remain at 25%, raising input risk. Regional shocks (Europe energy swings, Asian port disruptions) shift leverage to local suppliers, and nearshoring reduces exposure but can lift input costs short term. Supply-resilience programs prioritize reliability over lowest price, increasing procurement spend.
- Global footprint: operations in >25 countries
- US steel tariff: 25% (Section 232)
- Nearshoring: raises short-term input cost pressure
- Resilience trade-off: higher cost for reliability
Scale offsets and supplier development
Autoliv’s high volumes (2024 net sales ~USD 8.3bn) enable volume-based contracts and VAVE programs that claw back costs, often recovering low-single-digit percentage points of COGS. Long-term agreements and joint process improvements with tier-1s rebalance bargaining power via shared CAPEX and yield gains. Material pass-through clauses protect margins but dilute upside in periods of deflation. Net effect: moderate supplier power with episodic spikes tied to commodity cycles.
- Volumes: 2024 sales ~USD 8.3bn
- Cost recovery: VAVE/volume contracts recover low-single-digit COGS%
- Contracts: long-term + joint process improvements reduce supplier leverage
- Risk: pass-through limits upside in deflation; episodic supplier power spikes
12–24m, 40–52w lead times tighten supplier power
Autoliv faces concentrated supplier power due to niche pyrotechnics, 12–24 month qualification cycles and single-source pyros; chip/ASIC shortages and 40–52 week automotive lead times further raise switching costs. 2024 sales (~USD 8.3bn) give volume leverage and VAVE recoveries (low-single-digit COGS%), but episodic commodity and regional shocks amplify supplier bargaining. Compliance (IATF16949/ASIL) and tariffs (US steel 25%) cement incumbent supplier advantage.
| Metric | Value |
|---|---|
| 2024 net sales | ~USD 8.3bn |
| Qualification cycle | 12–24 months |
| Lead times (upcycle) | 40–52 weeks |
| US steel tariff | 25% (Section 232) |
What is included in the product
Detailed Word Document
Tailored Porter's Five Forces analysis for Autoliv uncovering key drivers of competition, supplier and buyer power, threat of substitutes and new entrants, plus disruptive trends and market protections that shape pricing, profitability and strategic positioning.
Customizable Excel Spreadsheet
A compact, one-sheet Porter's Five Forces for Autoliv that visualizes competitive pressures with an editable radar chart—ready for pitch decks, board slides, or integration into Excel dashboards; no macros required and easily customized to reflect supply-chain, safety-regulation, and EV-era shifts.
Customers Bargaining Power
Concentrated OEM customer base
Global automakers buy safety systems at scale and run aggressive sourcing; global light-vehicle production was about 79 million units in 2024, concentrating purchasing power among a few OEMs. Few large buyers exert strong pricing pressure and enforce typical annual cost-down targets of roughly 3–5%, squeezing supplier margins. Platform awards tend to be winner-take-most, and Autoliv’s dependence on top OEMs amplifies buyer leverage and contract risk.
High switching costs but planned re-sourcing
Validation, tooling and regulatory approvals typically require 12–24 months, making mid-cycle switching rare for Autoliv systems; however OEMs re-source at platform refreshes, which on average occur every 6–7 years, to reset pricing. Multi-year nominations (commonly 3–5 years) temper immediate customer power but do not eliminate long-run leverage. Design-in creates stickiness, not immunity to later re-sourcing.
Commoditized perception in mature lines
Seatbelts and standard airbags are largely commoditized in mature lines, driving intense OEM price benchmarking and squeezing margins; Autoliv held roughly one-third of the global passive-safety market in 2024, underscoring scale-driven pricing pressure. Differentiation via performance, weight and recyclability improves win rates but is often under-monetized by buyers. OEMs increasingly demand transparency and should-cost models, and procurement programs frequently prioritize cost leadership to capture volume contracts.
Co-development and performance specs
Joint engineering on new platforms deepens integration and can reduce direct price pressure, while Autoliv reported roughly US$8.6bn in 2024 sales, reflecting scale that strengthens its negotiating position. Buyers increasingly apply should-cost and target pricing to capture gains, and performance upgrades are often exchanged for price concessions. Collaboration moderates but does not erase buyer power as OEMs still leverage volume contracts and cost engineering.
- Joint engineering reduces price pressure; OEMs use should-cost/target pricing; performance-for-price trades common; collaboration moderates but doesn't remove buyer power
Aftermarket and regulations dilute leverage
Aftermarket depth and regulatory mandates constrain buyer leverage by stabilizing safety-system volumes; mandatory fitment across major markets (EU, US, China) reduces risk of abrupt demand collapse and supports predictable content per vehicle. OEM mix and regional standard differences still allow pricing pressure where luxury content varies, keeping net buyer power elevated despite regulatory buffers.
- Regulatory fitment: reduces volume volatility
- OEM mix: drives price sensitivity
- Regional standards: create pricing pockets
- Net buyer power: remains high
OEM leverage: 79m, 3–5% p.a., 6–7yr
Global OEMs (79m light vehicles in 2024) concentrate buying power, enforce 3–5% annual cost-downs and use winner-take-most awards, amplifying leverage versus Autoliv (US$8.6bn sales, ~33% passive-safety share in 2024).
Validation (12–24 months) and 3–5 year nominations limit mid-cycle switching, but 6–7 year platform refreshes reset pricing; technical differentiation is valuable yet often under-monetized.
| Metric | 2024 | Impact |
|---|---|---|
| Global LV production | 79m | Concentrated buyer power |
| Autoliv sales | US$8.6bn | Scale vs OEM leverage |
| Passive-safety share | ~33% | Price pressure |
| Cost-down targets | 3–5% p.a. | Margin squeeze |
| Platform refresh | 6–7 yrs | Resourcing events |
Full Version Awaits
Autoliv Porter's Five Forces Analysis
This preview shows the exact Autoliv Porter's Five Forces analysis you'll receive upon purchase—no placeholders or mockups. It contains the full, professionally formatted assessment of industry rivalry, supplier and buyer power, threats of entry and substitutes. You'll get instant access to this same file after payment, ready for download and use. No surprises—what you see is what you get.











