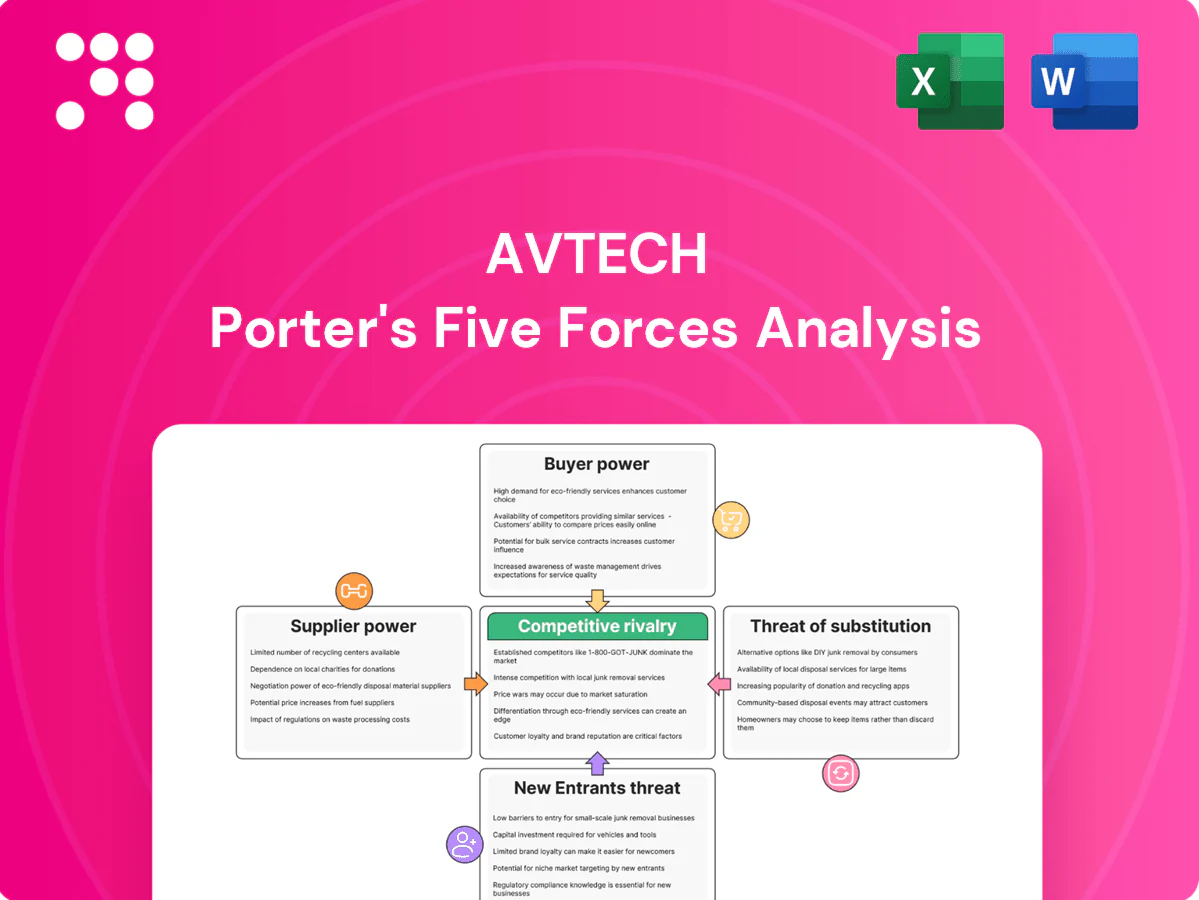
AVTECH Porter's Five Forces Analysis

Go Beyond the Preview—Access the Full Strategic Report
This snapshot highlights key tensions in AVTECH’s competitive landscape—supplier leverage, buyer power, substitute threats and entry barriers—framing where strategic risk lies. The full Porter's Five Forces Analysis quantifies each force and reveals competitive levers. Unlock the complete report for force-by-force ratings, visuals and actionable strategy. Get consultant-grade Excel and Word deliverables ready for presentation.
Suppliers Bargaining Power

Concentrated chip and sensor sources
Core components like image sensors and video SoCs are concentrated: Sony supplies roughly 50% of global CMOS image sensors (2023–24), while Ambarella and Novatek are leading video SoC vendors for cameras. Dependence on these suppliers tightens commercial terms and lead times; allocation shifts in 2023–24 materially affected OEM output and margins. Dual-sourcing and platform modularity partially mitigate but do not eliminate the risk.
Specialized optics and storage dependencies
Lenses, IR modules and surveillance-grade HDDs/SSDs are sourced from specialized vendors with clear quality tiers; Seagate and Western Digital together held roughly 80% of the HDD market in 2024, concentrating supplier power. Performance specs for low-light sensitivity and durability narrow interchangeable options, giving select suppliers leverage. Price swings in optical glass and rare-earth inputs and HDD supply cycles typically transmit quickly to OEMs. Long-term contracts and VMI programs are common mitigants to stabilize availability.

Firmware, AI SDK, and software stack reliance
Dependence on chipmaker SDKs and third-party libraries means AVTECH’s AI analytics and codec performance are often constrained by upstream roadmap timing and licensing as of 2024, affecting feature rollouts and update cadence. Security patches and CVE responses require close cooperation with vendors, raising supplier leverage. Strategic in-house middleware and adoption of open standards mitigate lock-in and reduce supplier bargaining power.

ODM/EMS capacity and yield control
Manufacturing partners directly influence yields, quality and delivery precision; with the global EMS/ODM market ≈600 billion USD in 2024, tight capacity during peaks can push prices and extend lead times beyond 20 weeks, impacting margins and time-to-market. Process IP, proprietary test fixtures and validation rigs create switching frictions that raise switching costs. Strategic supplier development and co-investment reduce risk and improve bargaining leverage.
- EMS market ≈600B USD (2024)
- Peak lead times >20 weeks
- Process IP/test fixtures = high switching cost
- Co-investment boosts supplier leverage
Compliance and component provenance constraints
Regional rules like NDAA barring Huawei and ZTE, GDPR fines up to €20M or 4% of global turnover, and NIST/CMMC mandates shrink acceptable suppliers and boost supplier leverage. Provenance verification and secure-supply vetting raise sourcing costs and limit alternatives; certified suppliers can charge premiums. Approved-vendor lists and periodic audits reduce risk and procurement spend volatility.
- NDAA: restricted vendor sets
- GDPR: fines €20M/4% turnover
- CMMC/NIST: mandatory audits
- Vetting increases sourcing cost, certified suppliers premium
Concentrated CMOS and HDD supply plus EMS tightness and >20-week leads raise supplier pricing power
Critical components are concentrated: Sony ~50% of CMOS sensors (2023–24) and Seagate+WD ~80% HDD share (2024), giving suppliers pricing and allocation leverage. EMS capacity tightness (global EMS ≈600B USD, 2024) and peak lead times >20 weeks raise switching costs. Vendor certification/regulation narrows acceptable suppliers and supports premiums.
| Metric | Value (2024) |
|---|---|
| CMOS share (Sony) | ~50% |
| HDD market (Seagate+WD) | ~80% |
| EMS market | ≈600B USD |
| Peak lead times | >20 weeks |
What is included in the product
 Detailed Word Document
Tailored Porter's Five Forces analysis for AVTECH that uncovers competitive intensity, buyer and supplier power, threat of substitutes and new entrants, and identifies disruptive risks and strategic levers to protect market share and profitability.

 Customizable Excel Spreadsheet
AVTECH Porter's Five Forces in one clean sheet—quickly visualize competitive pressure with an instant radar chart, tweak force levels to reflect new intel, and copy straight into pitch decks for faster, confident strategic decisions.
Customers Bargaining Power

Price-sensitive, spec-driven procurement
Buyers increasingly benchmark FPS, WDR, AI features and TCO across brands, with 2024 market reports valuing the global video surveillance market at about $70B, intensifying cross-brand comparisons. Commoditized SKUs, notably mid-range DVR/NVR, drive tougher price negotiations and margin compression. Transparent benchmarks lower perceived differentiation; bundled software, extended warranties and service can soften discount demands and preserve ASPs.
Large integrators and RFP leverage
System integrators and enterprise/government accounts purchase via RFPs in large volumes and typically require custom firmware, open APIs and extended support windows—commonly 3–5 year commitments. ONVIF/RTSP compatibility, with over 20,000 conformant products by 2024, lowers switching costs to moderate levels. Favorable SLAs and explicit roadmap commitments routinely become table stakes in contract negotiations.

Channel concentration and distributor terms
Regional distributors shape shelf space, rebates and payment terms, extracting concessions that compress margins and influence assortment. Sell-in pressure often drives requests for extended credit and consignment, increasing working capital strain. Channel conflict with e-commerce—which reached roughly 23% of global retail in 2024—erodes pricing power. Tiered distributor programs and strict MAP policies help rebalance influence and protect list prices.

Lifecycle support and cybersecurity expectations
Solution bundling and cross-selling dynamics
Customers increasingly demand end-to-end bundles (cameras, NVRs, VMS, cloud), with the global video surveillance market at about USD 53.2B in 2024; bundles raise switching costs but invite direct bundle-for-bundle comparisons that amplify price sensitivity. Perpetual licenses retain buyer leverage via one-time purchases, while subscriptions (cloud/VMS adoption ~28% in 2024) shift leverage toward suppliers. Flexible packaging and broad integrations materially strengthen vendor bargaining position.
- Bundle value: higher switching costs
- Comparison risk: price-driven head-to-head
- Licensing mix: perpetual vs subscription shifts leverage
- Integration breadth: improves seller negotiating power
Buyers force benchmarking; ONVIF choice cuts ASPs; cloud VMS 28% restores pricing
Buyers force cross-brand FPS/AI/TCO benchmarking, pressuring ASPs; mid-range DVR/NVR commoditization increases discounting. SIs/government RFPs (3–5yr) demand open APIs and support; ONVIF/RTSP (~20,000 products) lowers switching costs. Channel/distributor terms and e‑commerce (≈23% retail) compress margins; strong security/PSIRT and bundled subscriptions (cloud VMS ≈28%) restore pricing power.
| Metric | 2024 |
|---|---|
| Market size | USD 53.2B |
| ONVIF products | ~20,000 |
| Cloud VMS adoption | ~28% |
| E‑commerce impact | ~23% |
Preview the Actual Deliverable
AVTECH Porter's Five Forces Analysis
This preview shows the exact AVTECH Porter's Five Forces Analysis document you'll receive after purchase—no placeholders or sample pages. The file is fully formatted, professionally written, and ready for immediate download and use. What you see here is precisely what you'll get.

Go Beyond the Preview—Access the Full Strategic Report
This snapshot highlights key tensions in AVTECH’s competitive landscape—supplier leverage, buyer power, substitute threats and entry barriers—framing where strategic risk lies. The full Porter's Five Forces Analysis quantifies each force and reveals competitive levers. Unlock the complete report for force-by-force ratings, visuals and actionable strategy. Get consultant-grade Excel and Word deliverables ready for presentation.
Suppliers Bargaining Power
Concentrated chip and sensor sources
Core components like image sensors and video SoCs are concentrated: Sony supplies roughly 50% of global CMOS image sensors (2023–24), while Ambarella and Novatek are leading video SoC vendors for cameras. Dependence on these suppliers tightens commercial terms and lead times; allocation shifts in 2023–24 materially affected OEM output and margins. Dual-sourcing and platform modularity partially mitigate but do not eliminate the risk.
Specialized optics and storage dependencies
Lenses, IR modules and surveillance-grade HDDs/SSDs are sourced from specialized vendors with clear quality tiers; Seagate and Western Digital together held roughly 80% of the HDD market in 2024, concentrating supplier power. Performance specs for low-light sensitivity and durability narrow interchangeable options, giving select suppliers leverage. Price swings in optical glass and rare-earth inputs and HDD supply cycles typically transmit quickly to OEMs. Long-term contracts and VMI programs are common mitigants to stabilize availability.
Firmware, AI SDK, and software stack reliance
Dependence on chipmaker SDKs and third-party libraries means AVTECH’s AI analytics and codec performance are often constrained by upstream roadmap timing and licensing as of 2024, affecting feature rollouts and update cadence. Security patches and CVE responses require close cooperation with vendors, raising supplier leverage. Strategic in-house middleware and adoption of open standards mitigate lock-in and reduce supplier bargaining power.
ODM/EMS capacity and yield control
Manufacturing partners directly influence yields, quality and delivery precision; with the global EMS/ODM market ≈600 billion USD in 2024, tight capacity during peaks can push prices and extend lead times beyond 20 weeks, impacting margins and time-to-market. Process IP, proprietary test fixtures and validation rigs create switching frictions that raise switching costs. Strategic supplier development and co-investment reduce risk and improve bargaining leverage.
- EMS market ≈600B USD (2024)
- Peak lead times >20 weeks
- Process IP/test fixtures = high switching cost
- Co-investment boosts supplier leverage
Compliance and component provenance constraints
Regional rules like NDAA barring Huawei and ZTE, GDPR fines up to €20M or 4% of global turnover, and NIST/CMMC mandates shrink acceptable suppliers and boost supplier leverage. Provenance verification and secure-supply vetting raise sourcing costs and limit alternatives; certified suppliers can charge premiums. Approved-vendor lists and periodic audits reduce risk and procurement spend volatility.
- NDAA: restricted vendor sets
- GDPR: fines €20M/4% turnover
- CMMC/NIST: mandatory audits
- Vetting increases sourcing cost, certified suppliers premium
Concentrated CMOS and HDD supply plus EMS tightness and >20-week leads raise supplier pricing power
Critical components are concentrated: Sony ~50% of CMOS sensors (2023–24) and Seagate+WD ~80% HDD share (2024), giving suppliers pricing and allocation leverage. EMS capacity tightness (global EMS ≈600B USD, 2024) and peak lead times >20 weeks raise switching costs. Vendor certification/regulation narrows acceptable suppliers and supports premiums.
| Metric | Value (2024) |
|---|---|
| CMOS share (Sony) | ~50% |
| HDD market (Seagate+WD) | ~80% |
| EMS market | ≈600B USD |
| Peak lead times | >20 weeks |
What is included in the product
Detailed Word Document
Tailored Porter's Five Forces analysis for AVTECH that uncovers competitive intensity, buyer and supplier power, threat of substitutes and new entrants, and identifies disruptive risks and strategic levers to protect market share and profitability.
Customizable Excel Spreadsheet
AVTECH Porter's Five Forces in one clean sheet—quickly visualize competitive pressure with an instant radar chart, tweak force levels to reflect new intel, and copy straight into pitch decks for faster, confident strategic decisions.
Customers Bargaining Power
Price-sensitive, spec-driven procurement
Buyers increasingly benchmark FPS, WDR, AI features and TCO across brands, with 2024 market reports valuing the global video surveillance market at about $70B, intensifying cross-brand comparisons. Commoditized SKUs, notably mid-range DVR/NVR, drive tougher price negotiations and margin compression. Transparent benchmarks lower perceived differentiation; bundled software, extended warranties and service can soften discount demands and preserve ASPs.
Large integrators and RFP leverage
System integrators and enterprise/government accounts purchase via RFPs in large volumes and typically require custom firmware, open APIs and extended support windows—commonly 3–5 year commitments. ONVIF/RTSP compatibility, with over 20,000 conformant products by 2024, lowers switching costs to moderate levels. Favorable SLAs and explicit roadmap commitments routinely become table stakes in contract negotiations.
Channel concentration and distributor terms
Regional distributors shape shelf space, rebates and payment terms, extracting concessions that compress margins and influence assortment. Sell-in pressure often drives requests for extended credit and consignment, increasing working capital strain. Channel conflict with e-commerce—which reached roughly 23% of global retail in 2024—erodes pricing power. Tiered distributor programs and strict MAP policies help rebalance influence and protect list prices.
Lifecycle support and cybersecurity expectations
Solution bundling and cross-selling dynamics
Customers increasingly demand end-to-end bundles (cameras, NVRs, VMS, cloud), with the global video surveillance market at about USD 53.2B in 2024; bundles raise switching costs but invite direct bundle-for-bundle comparisons that amplify price sensitivity. Perpetual licenses retain buyer leverage via one-time purchases, while subscriptions (cloud/VMS adoption ~28% in 2024) shift leverage toward suppliers. Flexible packaging and broad integrations materially strengthen vendor bargaining position.
- Bundle value: higher switching costs
- Comparison risk: price-driven head-to-head
- Licensing mix: perpetual vs subscription shifts leverage
- Integration breadth: improves seller negotiating power
Buyers force benchmarking; ONVIF choice cuts ASPs; cloud VMS 28% restores pricing
Buyers force cross-brand FPS/AI/TCO benchmarking, pressuring ASPs; mid-range DVR/NVR commoditization increases discounting. SIs/government RFPs (3–5yr) demand open APIs and support; ONVIF/RTSP (~20,000 products) lowers switching costs. Channel/distributor terms and e‑commerce (≈23% retail) compress margins; strong security/PSIRT and bundled subscriptions (cloud VMS ≈28%) restore pricing power.
| Metric | 2024 |
|---|---|
| Market size | USD 53.2B |
| ONVIF products | ~20,000 |
| Cloud VMS adoption | ~28% |
| E‑commerce impact | ~23% |
Preview the Actual Deliverable
AVTECH Porter's Five Forces Analysis
This preview shows the exact AVTECH Porter's Five Forces Analysis document you'll receive after purchase—no placeholders or sample pages. The file is fully formatted, professionally written, and ready for immediate download and use. What you see here is precisely what you'll get.
Original: $10.00
-65%$10.00
$3.50Description
Go Beyond the Preview—Access the Full Strategic Report
This snapshot highlights key tensions in AVTECH’s competitive landscape—supplier leverage, buyer power, substitute threats and entry barriers—framing where strategic risk lies. The full Porter's Five Forces Analysis quantifies each force and reveals competitive levers. Unlock the complete report for force-by-force ratings, visuals and actionable strategy. Get consultant-grade Excel and Word deliverables ready for presentation.
Suppliers Bargaining Power
Concentrated chip and sensor sources
Core components like image sensors and video SoCs are concentrated: Sony supplies roughly 50% of global CMOS image sensors (2023–24), while Ambarella and Novatek are leading video SoC vendors for cameras. Dependence on these suppliers tightens commercial terms and lead times; allocation shifts in 2023–24 materially affected OEM output and margins. Dual-sourcing and platform modularity partially mitigate but do not eliminate the risk.
Specialized optics and storage dependencies
Lenses, IR modules and surveillance-grade HDDs/SSDs are sourced from specialized vendors with clear quality tiers; Seagate and Western Digital together held roughly 80% of the HDD market in 2024, concentrating supplier power. Performance specs for low-light sensitivity and durability narrow interchangeable options, giving select suppliers leverage. Price swings in optical glass and rare-earth inputs and HDD supply cycles typically transmit quickly to OEMs. Long-term contracts and VMI programs are common mitigants to stabilize availability.
Firmware, AI SDK, and software stack reliance
Dependence on chipmaker SDKs and third-party libraries means AVTECH’s AI analytics and codec performance are often constrained by upstream roadmap timing and licensing as of 2024, affecting feature rollouts and update cadence. Security patches and CVE responses require close cooperation with vendors, raising supplier leverage. Strategic in-house middleware and adoption of open standards mitigate lock-in and reduce supplier bargaining power.
ODM/EMS capacity and yield control
Manufacturing partners directly influence yields, quality and delivery precision; with the global EMS/ODM market ≈600 billion USD in 2024, tight capacity during peaks can push prices and extend lead times beyond 20 weeks, impacting margins and time-to-market. Process IP, proprietary test fixtures and validation rigs create switching frictions that raise switching costs. Strategic supplier development and co-investment reduce risk and improve bargaining leverage.
- EMS market ≈600B USD (2024)
- Peak lead times >20 weeks
- Process IP/test fixtures = high switching cost
- Co-investment boosts supplier leverage
Compliance and component provenance constraints
Regional rules like NDAA barring Huawei and ZTE, GDPR fines up to €20M or 4% of global turnover, and NIST/CMMC mandates shrink acceptable suppliers and boost supplier leverage. Provenance verification and secure-supply vetting raise sourcing costs and limit alternatives; certified suppliers can charge premiums. Approved-vendor lists and periodic audits reduce risk and procurement spend volatility.
- NDAA: restricted vendor sets
- GDPR: fines €20M/4% turnover
- CMMC/NIST: mandatory audits
- Vetting increases sourcing cost, certified suppliers premium
Concentrated CMOS and HDD supply plus EMS tightness and >20-week leads raise supplier pricing power
Critical components are concentrated: Sony ~50% of CMOS sensors (2023–24) and Seagate+WD ~80% HDD share (2024), giving suppliers pricing and allocation leverage. EMS capacity tightness (global EMS ≈600B USD, 2024) and peak lead times >20 weeks raise switching costs. Vendor certification/regulation narrows acceptable suppliers and supports premiums.
| Metric | Value (2024) |
|---|---|
| CMOS share (Sony) | ~50% |
| HDD market (Seagate+WD) | ~80% |
| EMS market | ≈600B USD |
| Peak lead times | >20 weeks |
What is included in the product
Detailed Word Document
Tailored Porter's Five Forces analysis for AVTECH that uncovers competitive intensity, buyer and supplier power, threat of substitutes and new entrants, and identifies disruptive risks and strategic levers to protect market share and profitability.
Customizable Excel Spreadsheet
AVTECH Porter's Five Forces in one clean sheet—quickly visualize competitive pressure with an instant radar chart, tweak force levels to reflect new intel, and copy straight into pitch decks for faster, confident strategic decisions.
Customers Bargaining Power
Price-sensitive, spec-driven procurement
Buyers increasingly benchmark FPS, WDR, AI features and TCO across brands, with 2024 market reports valuing the global video surveillance market at about $70B, intensifying cross-brand comparisons. Commoditized SKUs, notably mid-range DVR/NVR, drive tougher price negotiations and margin compression. Transparent benchmarks lower perceived differentiation; bundled software, extended warranties and service can soften discount demands and preserve ASPs.
Large integrators and RFP leverage
System integrators and enterprise/government accounts purchase via RFPs in large volumes and typically require custom firmware, open APIs and extended support windows—commonly 3–5 year commitments. ONVIF/RTSP compatibility, with over 20,000 conformant products by 2024, lowers switching costs to moderate levels. Favorable SLAs and explicit roadmap commitments routinely become table stakes in contract negotiations.
Channel concentration and distributor terms
Regional distributors shape shelf space, rebates and payment terms, extracting concessions that compress margins and influence assortment. Sell-in pressure often drives requests for extended credit and consignment, increasing working capital strain. Channel conflict with e-commerce—which reached roughly 23% of global retail in 2024—erodes pricing power. Tiered distributor programs and strict MAP policies help rebalance influence and protect list prices.
Lifecycle support and cybersecurity expectations
Solution bundling and cross-selling dynamics
Customers increasingly demand end-to-end bundles (cameras, NVRs, VMS, cloud), with the global video surveillance market at about USD 53.2B in 2024; bundles raise switching costs but invite direct bundle-for-bundle comparisons that amplify price sensitivity. Perpetual licenses retain buyer leverage via one-time purchases, while subscriptions (cloud/VMS adoption ~28% in 2024) shift leverage toward suppliers. Flexible packaging and broad integrations materially strengthen vendor bargaining position.
- Bundle value: higher switching costs
- Comparison risk: price-driven head-to-head
- Licensing mix: perpetual vs subscription shifts leverage
- Integration breadth: improves seller negotiating power
Buyers force benchmarking; ONVIF choice cuts ASPs; cloud VMS 28% restores pricing
Buyers force cross-brand FPS/AI/TCO benchmarking, pressuring ASPs; mid-range DVR/NVR commoditization increases discounting. SIs/government RFPs (3–5yr) demand open APIs and support; ONVIF/RTSP (~20,000 products) lowers switching costs. Channel/distributor terms and e‑commerce (≈23% retail) compress margins; strong security/PSIRT and bundled subscriptions (cloud VMS ≈28%) restore pricing power.
| Metric | 2024 |
|---|---|
| Market size | USD 53.2B |
| ONVIF products | ~20,000 |
| Cloud VMS adoption | ~28% |
| E‑commerce impact | ~23% |
Preview the Actual Deliverable
AVTECH Porter's Five Forces Analysis
This preview shows the exact AVTECH Porter's Five Forces Analysis document you'll receive after purchase—no placeholders or sample pages. The file is fully formatted, professionally written, and ready for immediate download and use. What you see here is precisely what you'll get.











