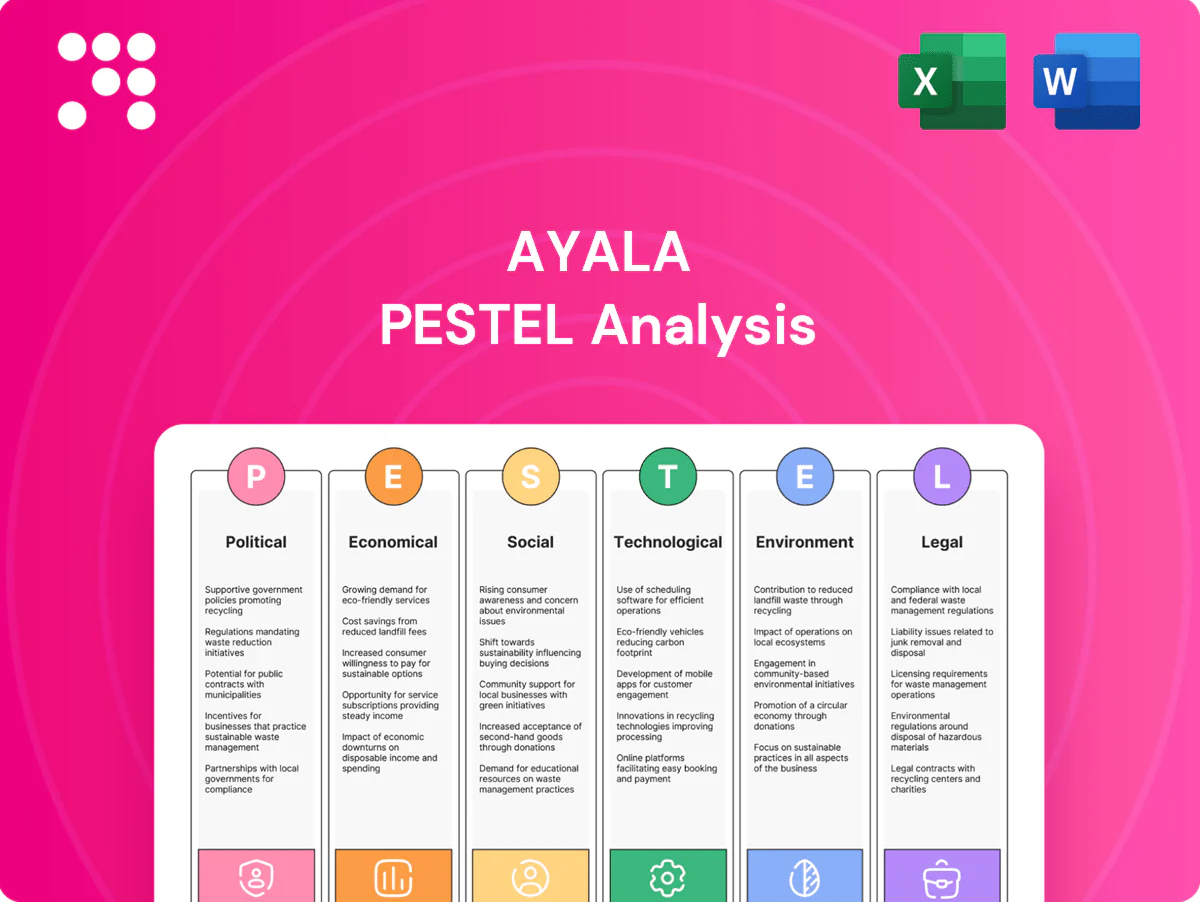
Ayala PESTLE Analysis

Make Smarter Strategic Decisions with a Complete PESTEL View
Unlock strategic advantage with our PESTLE Analysis of Ayala—concise, evidence-based insights into political, economic, social, technological, legal, and environmental forces shaping the group. Perfect for investors, consultants and executives seeking immediate, actionable intelligence. Purchase the full report to access deep-dive data, risk scenarios and practical recommendations ready for presentations and decision-making.
Political factors

Regulatory stability in the Philippines
Policy consistency in the Philippines directly shapes project approvals, tariff settings and telco/financial regulations, influencing timelines and returns; the economy grew ~5.6% in 2024, underscoring scope for scale. Stable administrations enable long-horizon real estate and power investments, while shifts can reprice incentives and reshape the PPP pipeline. Ayala must hedge political-cycle risks across property, utilities, banking and telco given high mobile penetration (~167% in 2024) and capital intensity.
Public–private partnership (PPP) outlook
Infrastructure PPPs shape Ayala’s transport, water and energy opportunities by creating long-term revenue streams and asset ownership options; transparent tendering and clear risk-sharing frameworks improve bankability and investor interest. Delays and contract renegotiations raise costs and timelines, while active stakeholder engagement secures competitive positions and smoother execution.

National infrastructure and digital agendas
Government push for connectivity and housing—via the DICT National Broadband Plan (targets nationwide coverage by 2028) and large-scale housing programs—bolsters demand for Globe (telecom infrastructure) and Ayala Land mixed-use projects.
Spectrum policy, tower permitting and fiber rights-of-way remain critical operational constraints that affect rollout costs and timelines for telco and property digital infrastructure.
Housing and urbanization programs steer demand toward integrated residential-commercial developments; alignment with provincial/state priorities can unlock fiscal incentives and expedited permitting.

Geopolitical and ASEAN integration
Regional trade and investment flows shape Ayala’s supply chains and capital access, with ASEAN a 670 million‑person market and intra‑regional trade ~24% of total, boosting cross‑border sourcing and financing. Geopolitical tensions can spike fuel costs (Brent averaged about $86/barrel in 2024) and dent investor sentiment across the group. ASEAN harmonization opens scale for Ayala’s healthcare and fintech units, while geographic diversification reduces country‑specific shock exposure.
- ASEAN market size: 670M people, intra‑trade ~24%
- Fuel sensitivity: Brent avg ~$86/bbl (2024)
- Strategy: cross‑border growth in healthcare/fintech; diversification to mitigate shocks
Local governance and LGU relations
Permits, zoning and environmental clearances rest with local government units (LGUs), and Ayala’s projects benefit from strong LGU ties that can cut rollout times—sometimes by months versus neutral locales—supporting faster utilities and community development.
Fragmented local policies across 81 provinces and ~1,489 municipalities create execution variance and cost unpredictability; targeted community benefit programs strengthen social license and reduce delays.
- LGU control: permits/zoning/envo clearances
- Local ties: speeds rollout, fewer delays
- Fragmentation: variance across 81 provinces
- Community programs: build social license
Policy stability, PPPs and LGU fragmentation drive approvals, tariffs and rollouts; ASEAN 670M scale
Policy stability and PPP pipelines determine approvals, tariffs and long‑term returns for Ayala’s property, utilities, telco and banking assets; political shifts can reprice incentives and renegotiate contracts. LGU fragmentation across provinces creates execution variance, so local ties and community programs are key to faster rollouts. Regional integration (ASEAN 670M) and macro shocks (Brent ~$86/bbl) affect supply chains and financing costs.
| Indicator | Value |
|---|---|
| Philippines GDP growth (2024) | ~5.6% |
| Mobile penetration (2024) | 167% |
| ASEAN population | 670M |
| Brent avg (2024) | $86/bbl |
What is included in the product
 Detailed Word Document
Explores how macro-environmental factors uniquely affect Ayala across Political, Economic, Social, Technological, Environmental, and Legal dimensions, with each section backed by data and regional trends to reveal concrete threats and opportunities. Delivered in clean, investor-ready format with forward-looking insights for strategic planning.

 Customizable Excel Spreadsheet
A concise, visually segmented Ayala PESTLE summary that’s easy to drop into presentations, share across teams, and annotate with local or business-line notes—ideal for quick alignment and focused risk discussions during planning sessions.
Economic factors

GDP growth and consumer demand
Philippine GDP growth (~5.6% in 2023, IMF est. 5.8% in 2024) drives Ayala property sales, mall footfall and telco usage, lifting revenues across real estate, retail and Globe. Rising incomes and remittances (annual gains ~4–6%) support bancassurance, loan origination and payments volume. Downturns compress pre-sales and raise NPL risks, while countercyclical essentials—utilities, healthcare, supermarkets—help cushion group earnings.
Interest rates and credit conditions
Higher interest rates—BSP policy rate at 6.25% and the 10‑year PH government bond yield near 6.10% in mid‑2025—dampen mortgage uptake and compress project IRRs for Ayala Land developments. Elevated funding costs strain capex‑heavy power and infra projects, raising financing breakevens. Bank affiliates (BPI reported NIM ~3.6% in 2024) face margin volatility as the yield curve shifts, so prudent leverage and tenor management preserve flexibility.

Inflation and input costs
Rising construction and energy costs have compressed Ayala Land development margins, with Philippine construction input prices up sharply and PHP trading around 56 per USD in 2024–25, increasing import-driven cost pressure. Telco opex and device subsidy burdens at Globe and Smart remain sensitive to FX and inflation, raising operating costs. Premium brand pricing in retail and real estate provides partial offset through higher ASPs, while long-term supply contracts and hedging programs have reduced cost volatility.

Exchange rate and capital flows
Peso moves (PHP ~55.5/USD in H1 2025) directly raise costs for USD‑priced power and network equipment; a 10% peso depreciation increases imported capex roughly 10%. FX swings affect foreign debt service and investor returns, while stable capital inflows in 2024–2025 supported equity raises and project finance. USD‑linked revenues across Ayala's energy and infra businesses act as natural hedges, mitigating FX volatility.
- FX rate: PHP ~55.5/USD (H1 2025)
- Imported capex sensitivity: ~1:1 to PHP moves
- Capital inflows: supported 2024–2025 project finance
- Natural hedge: USD‑linked revenues reduce FX risk
Employment and OFW remittances
OFW remittances bolster household consumption and housing demand—personal remittances to the Philippines totaled about USD 34.6 billion in 2023 (BSP), sustaining retail and residential markets; employment trends drive loan growth and delinquency as wage upticks expand credit demand while sectoral layoffs raise NPL risks; rapid service-sector expansion further lifts telecom data usage and digital services; provincial remittance patterns guide Ayala’s targeted infrastructure and property projects.
- remittances: USD 34.6B (2023, BSP)
- consumption/housing: supports retail & residential demand
- employment: affects loan growth and delinquency
- services: increases telecom data usage
- geography: provincial remittance mapping for projects
Policy stability, PPPs and LGU fragmentation drive approvals, tariffs and rollouts; ASEAN 670M scale
Philippine GDP (5.6% 2023; IMF est. 5.8% 2024) and remittances (USD 34.6B 2023) lift Ayala sales, mall traffic and telco usage, aiding retail, real estate and banking. BSP rate ~6.25% (mid‑2025) and 10y yield ~6.10% raise funding costs, pressuring mortgages and project IRRs. Peso ~55.5/USD (H1 2025) increases imported capex and opex but USD‑linked revenues provide a hedge.
| Metric | Value |
|---|---|
| GDP growth | 5.6% (2023); IMF 5.8% (2024) |
| Remittances | USD 34.6B (2023) |
| BSP policy rate | 6.25% (mid‑2025) |
| PHP/USD | ~55.5 (H1 2025) |
| BPI NIM | ~3.6% (2024) |
Preview the Actual Deliverable
Ayala PESTLE Analysis
The preview shown here is the exact Ayala PESTLE Analysis document you’ll receive after purchase—fully formatted and ready to use. The layout, content, and structure visible are exactly what you’ll download immediately after payment. No placeholders, no surprises.

Make Smarter Strategic Decisions with a Complete PESTEL View
Unlock strategic advantage with our PESTLE Analysis of Ayala—concise, evidence-based insights into political, economic, social, technological, legal, and environmental forces shaping the group. Perfect for investors, consultants and executives seeking immediate, actionable intelligence. Purchase the full report to access deep-dive data, risk scenarios and practical recommendations ready for presentations and decision-making.
Political factors
Regulatory stability in the Philippines
Policy consistency in the Philippines directly shapes project approvals, tariff settings and telco/financial regulations, influencing timelines and returns; the economy grew ~5.6% in 2024, underscoring scope for scale. Stable administrations enable long-horizon real estate and power investments, while shifts can reprice incentives and reshape the PPP pipeline. Ayala must hedge political-cycle risks across property, utilities, banking and telco given high mobile penetration (~167% in 2024) and capital intensity.
Public–private partnership (PPP) outlook
Infrastructure PPPs shape Ayala’s transport, water and energy opportunities by creating long-term revenue streams and asset ownership options; transparent tendering and clear risk-sharing frameworks improve bankability and investor interest. Delays and contract renegotiations raise costs and timelines, while active stakeholder engagement secures competitive positions and smoother execution.
National infrastructure and digital agendas
Government push for connectivity and housing—via the DICT National Broadband Plan (targets nationwide coverage by 2028) and large-scale housing programs—bolsters demand for Globe (telecom infrastructure) and Ayala Land mixed-use projects.
Spectrum policy, tower permitting and fiber rights-of-way remain critical operational constraints that affect rollout costs and timelines for telco and property digital infrastructure.
Housing and urbanization programs steer demand toward integrated residential-commercial developments; alignment with provincial/state priorities can unlock fiscal incentives and expedited permitting.
Geopolitical and ASEAN integration
Regional trade and investment flows shape Ayala’s supply chains and capital access, with ASEAN a 670 million‑person market and intra‑regional trade ~24% of total, boosting cross‑border sourcing and financing. Geopolitical tensions can spike fuel costs (Brent averaged about $86/barrel in 2024) and dent investor sentiment across the group. ASEAN harmonization opens scale for Ayala’s healthcare and fintech units, while geographic diversification reduces country‑specific shock exposure.
- ASEAN market size: 670M people, intra‑trade ~24%
- Fuel sensitivity: Brent avg ~$86/bbl (2024)
- Strategy: cross‑border growth in healthcare/fintech; diversification to mitigate shocks
Local governance and LGU relations
Permits, zoning and environmental clearances rest with local government units (LGUs), and Ayala’s projects benefit from strong LGU ties that can cut rollout times—sometimes by months versus neutral locales—supporting faster utilities and community development.
Fragmented local policies across 81 provinces and ~1,489 municipalities create execution variance and cost unpredictability; targeted community benefit programs strengthen social license and reduce delays.
- LGU control: permits/zoning/envo clearances
- Local ties: speeds rollout, fewer delays
- Fragmentation: variance across 81 provinces
- Community programs: build social license
Policy stability, PPPs and LGU fragmentation drive approvals, tariffs and rollouts; ASEAN 670M scale
Policy stability and PPP pipelines determine approvals, tariffs and long‑term returns for Ayala’s property, utilities, telco and banking assets; political shifts can reprice incentives and renegotiate contracts. LGU fragmentation across provinces creates execution variance, so local ties and community programs are key to faster rollouts. Regional integration (ASEAN 670M) and macro shocks (Brent ~$86/bbl) affect supply chains and financing costs.
| Indicator | Value |
|---|---|
| Philippines GDP growth (2024) | ~5.6% |
| Mobile penetration (2024) | 167% |
| ASEAN population | 670M |
| Brent avg (2024) | $86/bbl |
What is included in the product
Detailed Word Document
Explores how macro-environmental factors uniquely affect Ayala across Political, Economic, Social, Technological, Environmental, and Legal dimensions, with each section backed by data and regional trends to reveal concrete threats and opportunities. Delivered in clean, investor-ready format with forward-looking insights for strategic planning.
Customizable Excel Spreadsheet
A concise, visually segmented Ayala PESTLE summary that’s easy to drop into presentations, share across teams, and annotate with local or business-line notes—ideal for quick alignment and focused risk discussions during planning sessions.
Economic factors
GDP growth and consumer demand
Philippine GDP growth (~5.6% in 2023, IMF est. 5.8% in 2024) drives Ayala property sales, mall footfall and telco usage, lifting revenues across real estate, retail and Globe. Rising incomes and remittances (annual gains ~4–6%) support bancassurance, loan origination and payments volume. Downturns compress pre-sales and raise NPL risks, while countercyclical essentials—utilities, healthcare, supermarkets—help cushion group earnings.
Interest rates and credit conditions
Higher interest rates—BSP policy rate at 6.25% and the 10‑year PH government bond yield near 6.10% in mid‑2025—dampen mortgage uptake and compress project IRRs for Ayala Land developments. Elevated funding costs strain capex‑heavy power and infra projects, raising financing breakevens. Bank affiliates (BPI reported NIM ~3.6% in 2024) face margin volatility as the yield curve shifts, so prudent leverage and tenor management preserve flexibility.
Inflation and input costs
Rising construction and energy costs have compressed Ayala Land development margins, with Philippine construction input prices up sharply and PHP trading around 56 per USD in 2024–25, increasing import-driven cost pressure. Telco opex and device subsidy burdens at Globe and Smart remain sensitive to FX and inflation, raising operating costs. Premium brand pricing in retail and real estate provides partial offset through higher ASPs, while long-term supply contracts and hedging programs have reduced cost volatility.
Exchange rate and capital flows
Peso moves (PHP ~55.5/USD in H1 2025) directly raise costs for USD‑priced power and network equipment; a 10% peso depreciation increases imported capex roughly 10%. FX swings affect foreign debt service and investor returns, while stable capital inflows in 2024–2025 supported equity raises and project finance. USD‑linked revenues across Ayala's energy and infra businesses act as natural hedges, mitigating FX volatility.
- FX rate: PHP ~55.5/USD (H1 2025)
- Imported capex sensitivity: ~1:1 to PHP moves
- Capital inflows: supported 2024–2025 project finance
- Natural hedge: USD‑linked revenues reduce FX risk
Employment and OFW remittances
OFW remittances bolster household consumption and housing demand—personal remittances to the Philippines totaled about USD 34.6 billion in 2023 (BSP), sustaining retail and residential markets; employment trends drive loan growth and delinquency as wage upticks expand credit demand while sectoral layoffs raise NPL risks; rapid service-sector expansion further lifts telecom data usage and digital services; provincial remittance patterns guide Ayala’s targeted infrastructure and property projects.
- remittances: USD 34.6B (2023, BSP)
- consumption/housing: supports retail & residential demand
- employment: affects loan growth and delinquency
- services: increases telecom data usage
- geography: provincial remittance mapping for projects
Policy stability, PPPs and LGU fragmentation drive approvals, tariffs and rollouts; ASEAN 670M scale
Philippine GDP (5.6% 2023; IMF est. 5.8% 2024) and remittances (USD 34.6B 2023) lift Ayala sales, mall traffic and telco usage, aiding retail, real estate and banking. BSP rate ~6.25% (mid‑2025) and 10y yield ~6.10% raise funding costs, pressuring mortgages and project IRRs. Peso ~55.5/USD (H1 2025) increases imported capex and opex but USD‑linked revenues provide a hedge.
| Metric | Value |
|---|---|
| GDP growth | 5.6% (2023); IMF 5.8% (2024) |
| Remittances | USD 34.6B (2023) |
| BSP policy rate | 6.25% (mid‑2025) |
| PHP/USD | ~55.5 (H1 2025) |
| BPI NIM | ~3.6% (2024) |
Preview the Actual Deliverable
Ayala PESTLE Analysis
The preview shown here is the exact Ayala PESTLE Analysis document you’ll receive after purchase—fully formatted and ready to use. The layout, content, and structure visible are exactly what you’ll download immediately after payment. No placeholders, no surprises.
Original: $10.00
-65%$10.00
$3.50Description
Make Smarter Strategic Decisions with a Complete PESTEL View
Unlock strategic advantage with our PESTLE Analysis of Ayala—concise, evidence-based insights into political, economic, social, technological, legal, and environmental forces shaping the group. Perfect for investors, consultants and executives seeking immediate, actionable intelligence. Purchase the full report to access deep-dive data, risk scenarios and practical recommendations ready for presentations and decision-making.
Political factors
Regulatory stability in the Philippines
Policy consistency in the Philippines directly shapes project approvals, tariff settings and telco/financial regulations, influencing timelines and returns; the economy grew ~5.6% in 2024, underscoring scope for scale. Stable administrations enable long-horizon real estate and power investments, while shifts can reprice incentives and reshape the PPP pipeline. Ayala must hedge political-cycle risks across property, utilities, banking and telco given high mobile penetration (~167% in 2024) and capital intensity.
Public–private partnership (PPP) outlook
Infrastructure PPPs shape Ayala’s transport, water and energy opportunities by creating long-term revenue streams and asset ownership options; transparent tendering and clear risk-sharing frameworks improve bankability and investor interest. Delays and contract renegotiations raise costs and timelines, while active stakeholder engagement secures competitive positions and smoother execution.
National infrastructure and digital agendas
Government push for connectivity and housing—via the DICT National Broadband Plan (targets nationwide coverage by 2028) and large-scale housing programs—bolsters demand for Globe (telecom infrastructure) and Ayala Land mixed-use projects.
Spectrum policy, tower permitting and fiber rights-of-way remain critical operational constraints that affect rollout costs and timelines for telco and property digital infrastructure.
Housing and urbanization programs steer demand toward integrated residential-commercial developments; alignment with provincial/state priorities can unlock fiscal incentives and expedited permitting.
Geopolitical and ASEAN integration
Regional trade and investment flows shape Ayala’s supply chains and capital access, with ASEAN a 670 million‑person market and intra‑regional trade ~24% of total, boosting cross‑border sourcing and financing. Geopolitical tensions can spike fuel costs (Brent averaged about $86/barrel in 2024) and dent investor sentiment across the group. ASEAN harmonization opens scale for Ayala’s healthcare and fintech units, while geographic diversification reduces country‑specific shock exposure.
- ASEAN market size: 670M people, intra‑trade ~24%
- Fuel sensitivity: Brent avg ~$86/bbl (2024)
- Strategy: cross‑border growth in healthcare/fintech; diversification to mitigate shocks
Local governance and LGU relations
Permits, zoning and environmental clearances rest with local government units (LGUs), and Ayala’s projects benefit from strong LGU ties that can cut rollout times—sometimes by months versus neutral locales—supporting faster utilities and community development.
Fragmented local policies across 81 provinces and ~1,489 municipalities create execution variance and cost unpredictability; targeted community benefit programs strengthen social license and reduce delays.
- LGU control: permits/zoning/envo clearances
- Local ties: speeds rollout, fewer delays
- Fragmentation: variance across 81 provinces
- Community programs: build social license
Policy stability, PPPs and LGU fragmentation drive approvals, tariffs and rollouts; ASEAN 670M scale
Policy stability and PPP pipelines determine approvals, tariffs and long‑term returns for Ayala’s property, utilities, telco and banking assets; political shifts can reprice incentives and renegotiate contracts. LGU fragmentation across provinces creates execution variance, so local ties and community programs are key to faster rollouts. Regional integration (ASEAN 670M) and macro shocks (Brent ~$86/bbl) affect supply chains and financing costs.
| Indicator | Value |
|---|---|
| Philippines GDP growth (2024) | ~5.6% |
| Mobile penetration (2024) | 167% |
| ASEAN population | 670M |
| Brent avg (2024) | $86/bbl |
What is included in the product
Detailed Word Document
Explores how macro-environmental factors uniquely affect Ayala across Political, Economic, Social, Technological, Environmental, and Legal dimensions, with each section backed by data and regional trends to reveal concrete threats and opportunities. Delivered in clean, investor-ready format with forward-looking insights for strategic planning.
Customizable Excel Spreadsheet
A concise, visually segmented Ayala PESTLE summary that’s easy to drop into presentations, share across teams, and annotate with local or business-line notes—ideal for quick alignment and focused risk discussions during planning sessions.
Economic factors
GDP growth and consumer demand
Philippine GDP growth (~5.6% in 2023, IMF est. 5.8% in 2024) drives Ayala property sales, mall footfall and telco usage, lifting revenues across real estate, retail and Globe. Rising incomes and remittances (annual gains ~4–6%) support bancassurance, loan origination and payments volume. Downturns compress pre-sales and raise NPL risks, while countercyclical essentials—utilities, healthcare, supermarkets—help cushion group earnings.
Interest rates and credit conditions
Higher interest rates—BSP policy rate at 6.25% and the 10‑year PH government bond yield near 6.10% in mid‑2025—dampen mortgage uptake and compress project IRRs for Ayala Land developments. Elevated funding costs strain capex‑heavy power and infra projects, raising financing breakevens. Bank affiliates (BPI reported NIM ~3.6% in 2024) face margin volatility as the yield curve shifts, so prudent leverage and tenor management preserve flexibility.
Inflation and input costs
Rising construction and energy costs have compressed Ayala Land development margins, with Philippine construction input prices up sharply and PHP trading around 56 per USD in 2024–25, increasing import-driven cost pressure. Telco opex and device subsidy burdens at Globe and Smart remain sensitive to FX and inflation, raising operating costs. Premium brand pricing in retail and real estate provides partial offset through higher ASPs, while long-term supply contracts and hedging programs have reduced cost volatility.
Exchange rate and capital flows
Peso moves (PHP ~55.5/USD in H1 2025) directly raise costs for USD‑priced power and network equipment; a 10% peso depreciation increases imported capex roughly 10%. FX swings affect foreign debt service and investor returns, while stable capital inflows in 2024–2025 supported equity raises and project finance. USD‑linked revenues across Ayala's energy and infra businesses act as natural hedges, mitigating FX volatility.
- FX rate: PHP ~55.5/USD (H1 2025)
- Imported capex sensitivity: ~1:1 to PHP moves
- Capital inflows: supported 2024–2025 project finance
- Natural hedge: USD‑linked revenues reduce FX risk
Employment and OFW remittances
OFW remittances bolster household consumption and housing demand—personal remittances to the Philippines totaled about USD 34.6 billion in 2023 (BSP), sustaining retail and residential markets; employment trends drive loan growth and delinquency as wage upticks expand credit demand while sectoral layoffs raise NPL risks; rapid service-sector expansion further lifts telecom data usage and digital services; provincial remittance patterns guide Ayala’s targeted infrastructure and property projects.
- remittances: USD 34.6B (2023, BSP)
- consumption/housing: supports retail & residential demand
- employment: affects loan growth and delinquency
- services: increases telecom data usage
- geography: provincial remittance mapping for projects
Policy stability, PPPs and LGU fragmentation drive approvals, tariffs and rollouts; ASEAN 670M scale
Philippine GDP (5.6% 2023; IMF est. 5.8% 2024) and remittances (USD 34.6B 2023) lift Ayala sales, mall traffic and telco usage, aiding retail, real estate and banking. BSP rate ~6.25% (mid‑2025) and 10y yield ~6.10% raise funding costs, pressuring mortgages and project IRRs. Peso ~55.5/USD (H1 2025) increases imported capex and opex but USD‑linked revenues provide a hedge.
| Metric | Value |
|---|---|
| GDP growth | 5.6% (2023); IMF 5.8% (2024) |
| Remittances | USD 34.6B (2023) |
| BSP policy rate | 6.25% (mid‑2025) |
| PHP/USD | ~55.5 (H1 2025) |
| BPI NIM | ~3.6% (2024) |
Preview the Actual Deliverable
Ayala PESTLE Analysis
The preview shown here is the exact Ayala PESTLE Analysis document you’ll receive after purchase—fully formatted and ready to use. The layout, content, and structure visible are exactly what you’ll download immediately after payment. No placeholders, no surprises.











