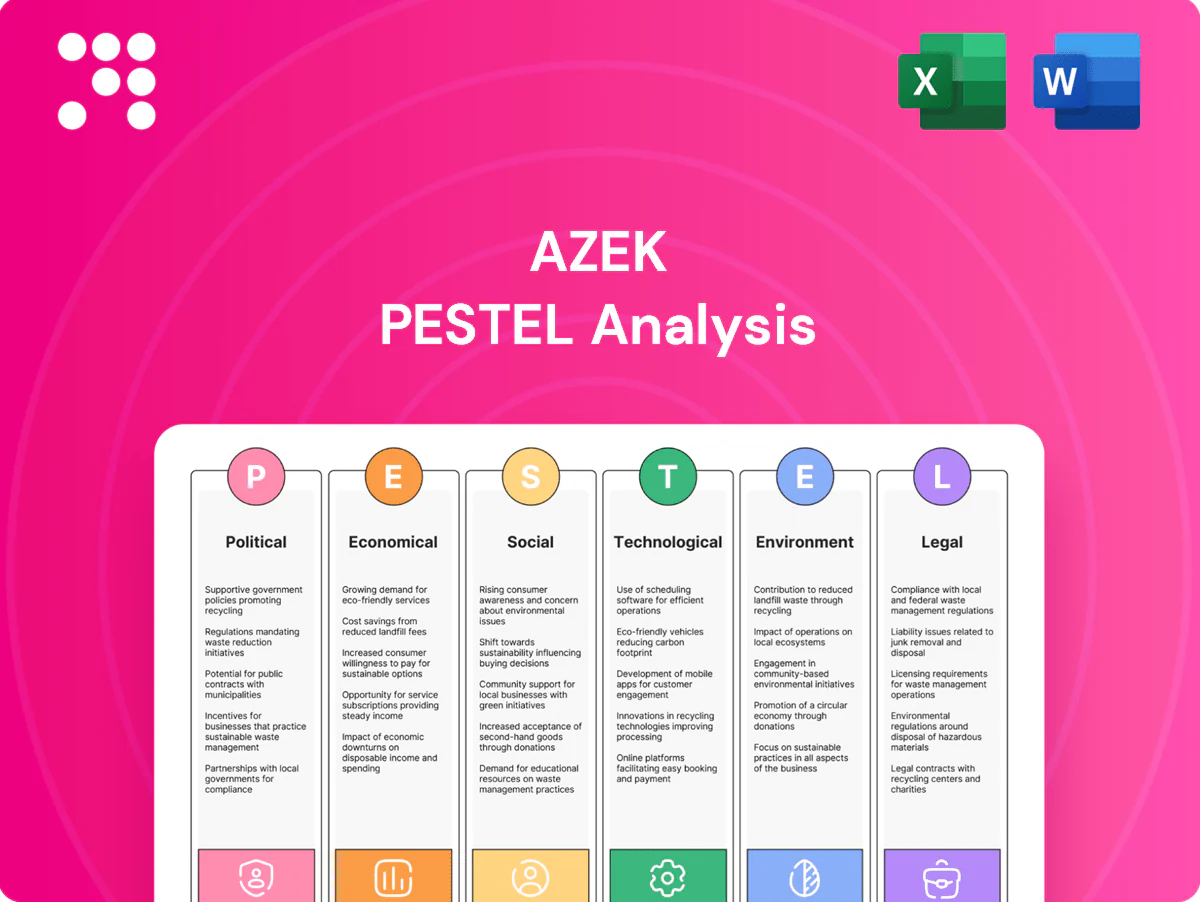
AZEK PESTLE Analysis

Skip the Research. Get the Strategy.
Gain a strategic edge with our PESTLE Analysis of AZEK—clear, actionable insights into political, economic, social, technological, legal and environmental forces. Ideal for investors, consultants and planners, it highlights risks and growth levers shaping AZEK’s future. Purchase the full report for the complete, editable breakdown and immediate strategic value.
Political factors

US housing and infrastructure policies
Federal moves like the Bipartisan Infrastructure Law (about 1.2 trillion total, ~550 billion new spending) and the Inflation Reduction Act (roughly 369 billion for clean energy) boost spending on housing, resiliency, and infrastructure, lifting demand for decking, siding, and trim. The Build America, Buy America Act expanded domestic sourcing rules, influencing material choices and supply chains. Shifts in annual appropriations or party priorities can accelerate or stall project pipelines, and AZEK stands to gain when policy favors renovation, resilience, and material innovation.
Trade tariffs and material import dynamics
Import tariffs on plastics, resins, metals or machinery—including US Section 301 duties that reached up to 25% on many Chinese imports—directly raise AZEK’s input costs and force pricing adjustments. Retaliatory measures or new trade agreements can rapidly reshape competitors’ cost bases and market access. Stable trade policy reduces margin volatility, while new barriers compress gross margins; diversified sourcing and nearshoring mitigate these shocks.

State and local building codes alignment
Codes drive adoption of low-maintenance, fire-rated and resilient materials; the International Code Council released the 2024 I-Codes, yet adoption timing varies by jurisdiction, creating certification complexity and localized niches AZEK can serve. Proactive engagement with code officials and bodies can secure product-spec wins, while lagging local code updates continue to slow conversion from wood in some markets.

Recycling and circular-economy incentives
Recycling tax credits, grants, and recycled-content mandates accelerate demand for AZEK’s high-recycled polymer decking and trim, reducing raw-material volatility and supporting premium pricing.
Producer responsibility schemes increase compliance costs but can secure feedstock through take-back or guaranteed procurement; clear federal or state policy enables multi-year capacity planning, while fragmented rules across jurisdictions force agile, scalable compliance systems.
- fiscal incentives favor recycled-content manufacturers
- EPR adds cost but secures materials
- policy clarity = long-term planning
- fragmentation demands agile compliance
Energy and industrial policy impacts
Policies on electricity, natural gas and renewables directly affect AZEKs plant operating costs: US industrial electricity averaged about $0.075/kWh in 2024 and Henry Hub gas averaged ~3.5 $/MMBtu, while EU and UK energy prices remain higher. Incentives under the 2022 Inflation Reduction Act — including clean manufacturing tax credits of up to ~10% and expanded ITC/PTC — can improve margins for efficiency upgrades. Carbon pricing and reporting, with EU ETS near €80–90/t in 2024, will shape capex toward lower‑carbon materials and processes, and regional energy volatility increases the importance of siting decisions.
- Energy cost: US industrial electricity ~0.075 $/kWh (2024)
- Gas price: Henry Hub ~3.5 $/MMBtu (2024)
- Carbon signal: EU ETS ~€80–90/t (2024)
- Incentives: IRA clean manufacturing credits up to ~10%
- Siting risk: regional energy volatility raises capex/supply considerations
Infra+IRA $1.2T lift recycled decking; tariffs 25%
Federal measures (Bipartisan Infrastructure Law ~$1.2T, IRA ~$369B) plus Build America, Buy America boost demand for resilient decking; US Section 301 tariffs (up to 25%) raise input costs. Recycling credits/EPR and 2024 I‑Code updates favor AZEK’s recycled polymer products. Energy incentives (IRA credits ~10%) and regional energy prices (US industrial ~$0.075/kWh; Henry Hub ~$3.5/MMBtu in 2024) shape capex and siting.
| Policy | 2024/25 Data | Impact |
|---|---|---|
| Infrastructure/IRA | $1.2T / $369B | Demand lift |
| Tariffs | Section 301 up to 25% | Input cost pressure |
| Energy/carbons | $0.075/kWh; $3.5/MMBtu; EU ETS €80–90/t | Capex/siting |
What is included in the product
 Detailed Word Document
Explores how macro-environmental factors uniquely affect AZEK across Political, Economic, Social, Technological, Environmental and Legal dimensions, with data-backed trends and forward-looking insights. Designed for executives and investors and formatted for direct use in plans and decks.

 Customizable Excel Spreadsheet
A concise, visually segmented PESTLE summary of AZEK that’s easily dropped into presentations, shareable across teams, and customizable with notes to support external risk discussions, quick alignment, and client-ready reports.
Economic factors

Housing cycle and renovation demand
New starts (single-family ~900k in 2024) and existing-home sales (~4.0M in 2024) plus homeowner R&R spend (~$450B annually) drive AZEK volumes; high 30-year mortgage rates (~7%–7.5% mid-2025) can suppress new builds while boosting remodeling as owners stay put. Aging housing stock—roughly half of US homes built before 1990—supports replacement demand for decking and siding. Sensitivity varies by AZEK channel mix and price tier, with higher-end channels less rate-sensitive.
Input costs and resin price volatility
PE/PVC and additives drive a large share of AZEKs COGS, so resin price swings directly affect pricing cadence and margin. Crude and NGL dynamics — WTI averaged about $80/bbl in 2024 — flow through to polymer costs with a typical 2–6 month lag. Hedging programs and long-term supply contracts in AZEKs filings have buffered short-term shocks. Pricing power hinges on brand strength and tight channel relationships.

Labor availability in construction trades
Contractor shortages—reported by about 78% of firms in AGC 2024 surveys—delay AZEK installs and nudge demand toward faster systems. Construction wages rose roughly 5% in 2024 (BLS), lifting project costs and testing homeowner willingness to upgrade. Training partnerships with trade schools can reduce adoption barriers, and simpler-install products capture share when labor is tight.

Channel and inventory cycles
Dealer, distributor, and big-box inventory swings amplify end-demand volatility for AZEK, driving lumpy order patterns that stress production planning. Effective S&OP reduces stockouts and markdowns, improving gross margins and working capital efficiency. Incentive structures that reward sell-through over sell-in align partners and smooth replenishment; clear visibility with partners stabilizes production loads.
- Dealer/distributor variability amplifies demand swings
- S&OP lowers stockouts and markdown risk
- Incentives drive sell-through vs sell-in balance
- Shared visibility smooths production
Consumer spending and premiumization
Discretionary budgets drive trading up from wood to AZEK composites as higher-end projects capture share when renovation spend holds; homeowner equity reached record highs in 2024, supporting demand for premium-priced products and higher ASPs. During downturns consumers shift to value lines and financing, while AZEKs brand-led differentiation helps preserve sales mix and margins.
- discretionary budgets → trade-up to composites
- record-high homeowner equity in 2024 → supports premium ASPs
- downturns → value lines & financing gain share
- brand-led differentiation → protects mix & margins
Infra+IRA $1.2T lift recycled decking; tariffs 25%
US housing activity and $450B R&R underpin AZEK volumes; high 30-year rates (~7–7.5% mid-2025) shift demand from new builds to remodeling. Resin costs (linked to WTI ~$80/bbl in 2024) drive COGS volatility. Labor shortages and dealer inventory swings constrain installs and create lumpy orders.
| Metric | Value |
|---|---|
| New starts 2024 | ~900k |
| Existing sales 2024 | ~4.0M |
| 30-yr rate mid-2025 | 7–7.5% |
Preview Before You Purchase
AZEK PESTLE Analysis
The preview shown here is the exact AZEK PESTLE Analysis document you’ll receive after purchase—fully formatted, professionally structured, and ready to use. No placeholders or teasers; this is the real file. After payment you’ll instantly download this same finished document.

Skip the Research. Get the Strategy.
Gain a strategic edge with our PESTLE Analysis of AZEK—clear, actionable insights into political, economic, social, technological, legal and environmental forces. Ideal for investors, consultants and planners, it highlights risks and growth levers shaping AZEK’s future. Purchase the full report for the complete, editable breakdown and immediate strategic value.
Political factors
US housing and infrastructure policies
Federal moves like the Bipartisan Infrastructure Law (about 1.2 trillion total, ~550 billion new spending) and the Inflation Reduction Act (roughly 369 billion for clean energy) boost spending on housing, resiliency, and infrastructure, lifting demand for decking, siding, and trim. The Build America, Buy America Act expanded domestic sourcing rules, influencing material choices and supply chains. Shifts in annual appropriations or party priorities can accelerate or stall project pipelines, and AZEK stands to gain when policy favors renovation, resilience, and material innovation.
Trade tariffs and material import dynamics
Import tariffs on plastics, resins, metals or machinery—including US Section 301 duties that reached up to 25% on many Chinese imports—directly raise AZEK’s input costs and force pricing adjustments. Retaliatory measures or new trade agreements can rapidly reshape competitors’ cost bases and market access. Stable trade policy reduces margin volatility, while new barriers compress gross margins; diversified sourcing and nearshoring mitigate these shocks.
State and local building codes alignment
Codes drive adoption of low-maintenance, fire-rated and resilient materials; the International Code Council released the 2024 I-Codes, yet adoption timing varies by jurisdiction, creating certification complexity and localized niches AZEK can serve. Proactive engagement with code officials and bodies can secure product-spec wins, while lagging local code updates continue to slow conversion from wood in some markets.
Recycling and circular-economy incentives
Recycling tax credits, grants, and recycled-content mandates accelerate demand for AZEK’s high-recycled polymer decking and trim, reducing raw-material volatility and supporting premium pricing.
Producer responsibility schemes increase compliance costs but can secure feedstock through take-back or guaranteed procurement; clear federal or state policy enables multi-year capacity planning, while fragmented rules across jurisdictions force agile, scalable compliance systems.
- fiscal incentives favor recycled-content manufacturers
- EPR adds cost but secures materials
- policy clarity = long-term planning
- fragmentation demands agile compliance
Energy and industrial policy impacts
Policies on electricity, natural gas and renewables directly affect AZEKs plant operating costs: US industrial electricity averaged about $0.075/kWh in 2024 and Henry Hub gas averaged ~3.5 $/MMBtu, while EU and UK energy prices remain higher. Incentives under the 2022 Inflation Reduction Act — including clean manufacturing tax credits of up to ~10% and expanded ITC/PTC — can improve margins for efficiency upgrades. Carbon pricing and reporting, with EU ETS near €80–90/t in 2024, will shape capex toward lower‑carbon materials and processes, and regional energy volatility increases the importance of siting decisions.
- Energy cost: US industrial electricity ~0.075 $/kWh (2024)
- Gas price: Henry Hub ~3.5 $/MMBtu (2024)
- Carbon signal: EU ETS ~€80–90/t (2024)
- Incentives: IRA clean manufacturing credits up to ~10%
- Siting risk: regional energy volatility raises capex/supply considerations
Infra+IRA $1.2T lift recycled decking; tariffs 25%
Federal measures (Bipartisan Infrastructure Law ~$1.2T, IRA ~$369B) plus Build America, Buy America boost demand for resilient decking; US Section 301 tariffs (up to 25%) raise input costs. Recycling credits/EPR and 2024 I‑Code updates favor AZEK’s recycled polymer products. Energy incentives (IRA credits ~10%) and regional energy prices (US industrial ~$0.075/kWh; Henry Hub ~$3.5/MMBtu in 2024) shape capex and siting.
| Policy | 2024/25 Data | Impact |
|---|---|---|
| Infrastructure/IRA | $1.2T / $369B | Demand lift |
| Tariffs | Section 301 up to 25% | Input cost pressure |
| Energy/carbons | $0.075/kWh; $3.5/MMBtu; EU ETS €80–90/t | Capex/siting |
What is included in the product
Detailed Word Document
Explores how macro-environmental factors uniquely affect AZEK across Political, Economic, Social, Technological, Environmental and Legal dimensions, with data-backed trends and forward-looking insights. Designed for executives and investors and formatted for direct use in plans and decks.
Customizable Excel Spreadsheet
A concise, visually segmented PESTLE summary of AZEK that’s easily dropped into presentations, shareable across teams, and customizable with notes to support external risk discussions, quick alignment, and client-ready reports.
Economic factors
Housing cycle and renovation demand
New starts (single-family ~900k in 2024) and existing-home sales (~4.0M in 2024) plus homeowner R&R spend (~$450B annually) drive AZEK volumes; high 30-year mortgage rates (~7%–7.5% mid-2025) can suppress new builds while boosting remodeling as owners stay put. Aging housing stock—roughly half of US homes built before 1990—supports replacement demand for decking and siding. Sensitivity varies by AZEK channel mix and price tier, with higher-end channels less rate-sensitive.
Input costs and resin price volatility
PE/PVC and additives drive a large share of AZEKs COGS, so resin price swings directly affect pricing cadence and margin. Crude and NGL dynamics — WTI averaged about $80/bbl in 2024 — flow through to polymer costs with a typical 2–6 month lag. Hedging programs and long-term supply contracts in AZEKs filings have buffered short-term shocks. Pricing power hinges on brand strength and tight channel relationships.
Labor availability in construction trades
Contractor shortages—reported by about 78% of firms in AGC 2024 surveys—delay AZEK installs and nudge demand toward faster systems. Construction wages rose roughly 5% in 2024 (BLS), lifting project costs and testing homeowner willingness to upgrade. Training partnerships with trade schools can reduce adoption barriers, and simpler-install products capture share when labor is tight.
Channel and inventory cycles
Dealer, distributor, and big-box inventory swings amplify end-demand volatility for AZEK, driving lumpy order patterns that stress production planning. Effective S&OP reduces stockouts and markdowns, improving gross margins and working capital efficiency. Incentive structures that reward sell-through over sell-in align partners and smooth replenishment; clear visibility with partners stabilizes production loads.
- Dealer/distributor variability amplifies demand swings
- S&OP lowers stockouts and markdown risk
- Incentives drive sell-through vs sell-in balance
- Shared visibility smooths production
Consumer spending and premiumization
Discretionary budgets drive trading up from wood to AZEK composites as higher-end projects capture share when renovation spend holds; homeowner equity reached record highs in 2024, supporting demand for premium-priced products and higher ASPs. During downturns consumers shift to value lines and financing, while AZEKs brand-led differentiation helps preserve sales mix and margins.
- discretionary budgets → trade-up to composites
- record-high homeowner equity in 2024 → supports premium ASPs
- downturns → value lines & financing gain share
- brand-led differentiation → protects mix & margins
Infra+IRA $1.2T lift recycled decking; tariffs 25%
US housing activity and $450B R&R underpin AZEK volumes; high 30-year rates (~7–7.5% mid-2025) shift demand from new builds to remodeling. Resin costs (linked to WTI ~$80/bbl in 2024) drive COGS volatility. Labor shortages and dealer inventory swings constrain installs and create lumpy orders.
| Metric | Value |
|---|---|
| New starts 2024 | ~900k |
| Existing sales 2024 | ~4.0M |
| 30-yr rate mid-2025 | 7–7.5% |
Preview Before You Purchase
AZEK PESTLE Analysis
The preview shown here is the exact AZEK PESTLE Analysis document you’ll receive after purchase—fully formatted, professionally structured, and ready to use. No placeholders or teasers; this is the real file. After payment you’ll instantly download this same finished document.
Original: $10.00
-65%$10.00
$3.50Description
Skip the Research. Get the Strategy.
Gain a strategic edge with our PESTLE Analysis of AZEK—clear, actionable insights into political, economic, social, technological, legal and environmental forces. Ideal for investors, consultants and planners, it highlights risks and growth levers shaping AZEK’s future. Purchase the full report for the complete, editable breakdown and immediate strategic value.
Political factors
US housing and infrastructure policies
Federal moves like the Bipartisan Infrastructure Law (about 1.2 trillion total, ~550 billion new spending) and the Inflation Reduction Act (roughly 369 billion for clean energy) boost spending on housing, resiliency, and infrastructure, lifting demand for decking, siding, and trim. The Build America, Buy America Act expanded domestic sourcing rules, influencing material choices and supply chains. Shifts in annual appropriations or party priorities can accelerate or stall project pipelines, and AZEK stands to gain when policy favors renovation, resilience, and material innovation.
Trade tariffs and material import dynamics
Import tariffs on plastics, resins, metals or machinery—including US Section 301 duties that reached up to 25% on many Chinese imports—directly raise AZEK’s input costs and force pricing adjustments. Retaliatory measures or new trade agreements can rapidly reshape competitors’ cost bases and market access. Stable trade policy reduces margin volatility, while new barriers compress gross margins; diversified sourcing and nearshoring mitigate these shocks.
State and local building codes alignment
Codes drive adoption of low-maintenance, fire-rated and resilient materials; the International Code Council released the 2024 I-Codes, yet adoption timing varies by jurisdiction, creating certification complexity and localized niches AZEK can serve. Proactive engagement with code officials and bodies can secure product-spec wins, while lagging local code updates continue to slow conversion from wood in some markets.
Recycling and circular-economy incentives
Recycling tax credits, grants, and recycled-content mandates accelerate demand for AZEK’s high-recycled polymer decking and trim, reducing raw-material volatility and supporting premium pricing.
Producer responsibility schemes increase compliance costs but can secure feedstock through take-back or guaranteed procurement; clear federal or state policy enables multi-year capacity planning, while fragmented rules across jurisdictions force agile, scalable compliance systems.
- fiscal incentives favor recycled-content manufacturers
- EPR adds cost but secures materials
- policy clarity = long-term planning
- fragmentation demands agile compliance
Energy and industrial policy impacts
Policies on electricity, natural gas and renewables directly affect AZEKs plant operating costs: US industrial electricity averaged about $0.075/kWh in 2024 and Henry Hub gas averaged ~3.5 $/MMBtu, while EU and UK energy prices remain higher. Incentives under the 2022 Inflation Reduction Act — including clean manufacturing tax credits of up to ~10% and expanded ITC/PTC — can improve margins for efficiency upgrades. Carbon pricing and reporting, with EU ETS near €80–90/t in 2024, will shape capex toward lower‑carbon materials and processes, and regional energy volatility increases the importance of siting decisions.
- Energy cost: US industrial electricity ~0.075 $/kWh (2024)
- Gas price: Henry Hub ~3.5 $/MMBtu (2024)
- Carbon signal: EU ETS ~€80–90/t (2024)
- Incentives: IRA clean manufacturing credits up to ~10%
- Siting risk: regional energy volatility raises capex/supply considerations
Infra+IRA $1.2T lift recycled decking; tariffs 25%
Federal measures (Bipartisan Infrastructure Law ~$1.2T, IRA ~$369B) plus Build America, Buy America boost demand for resilient decking; US Section 301 tariffs (up to 25%) raise input costs. Recycling credits/EPR and 2024 I‑Code updates favor AZEK’s recycled polymer products. Energy incentives (IRA credits ~10%) and regional energy prices (US industrial ~$0.075/kWh; Henry Hub ~$3.5/MMBtu in 2024) shape capex and siting.
| Policy | 2024/25 Data | Impact |
|---|---|---|
| Infrastructure/IRA | $1.2T / $369B | Demand lift |
| Tariffs | Section 301 up to 25% | Input cost pressure |
| Energy/carbons | $0.075/kWh; $3.5/MMBtu; EU ETS €80–90/t | Capex/siting |
What is included in the product
Detailed Word Document
Explores how macro-environmental factors uniquely affect AZEK across Political, Economic, Social, Technological, Environmental and Legal dimensions, with data-backed trends and forward-looking insights. Designed for executives and investors and formatted for direct use in plans and decks.
Customizable Excel Spreadsheet
A concise, visually segmented PESTLE summary of AZEK that’s easily dropped into presentations, shareable across teams, and customizable with notes to support external risk discussions, quick alignment, and client-ready reports.
Economic factors
Housing cycle and renovation demand
New starts (single-family ~900k in 2024) and existing-home sales (~4.0M in 2024) plus homeowner R&R spend (~$450B annually) drive AZEK volumes; high 30-year mortgage rates (~7%–7.5% mid-2025) can suppress new builds while boosting remodeling as owners stay put. Aging housing stock—roughly half of US homes built before 1990—supports replacement demand for decking and siding. Sensitivity varies by AZEK channel mix and price tier, with higher-end channels less rate-sensitive.
Input costs and resin price volatility
PE/PVC and additives drive a large share of AZEKs COGS, so resin price swings directly affect pricing cadence and margin. Crude and NGL dynamics — WTI averaged about $80/bbl in 2024 — flow through to polymer costs with a typical 2–6 month lag. Hedging programs and long-term supply contracts in AZEKs filings have buffered short-term shocks. Pricing power hinges on brand strength and tight channel relationships.
Labor availability in construction trades
Contractor shortages—reported by about 78% of firms in AGC 2024 surveys—delay AZEK installs and nudge demand toward faster systems. Construction wages rose roughly 5% in 2024 (BLS), lifting project costs and testing homeowner willingness to upgrade. Training partnerships with trade schools can reduce adoption barriers, and simpler-install products capture share when labor is tight.
Channel and inventory cycles
Dealer, distributor, and big-box inventory swings amplify end-demand volatility for AZEK, driving lumpy order patterns that stress production planning. Effective S&OP reduces stockouts and markdowns, improving gross margins and working capital efficiency. Incentive structures that reward sell-through over sell-in align partners and smooth replenishment; clear visibility with partners stabilizes production loads.
- Dealer/distributor variability amplifies demand swings
- S&OP lowers stockouts and markdown risk
- Incentives drive sell-through vs sell-in balance
- Shared visibility smooths production
Consumer spending and premiumization
Discretionary budgets drive trading up from wood to AZEK composites as higher-end projects capture share when renovation spend holds; homeowner equity reached record highs in 2024, supporting demand for premium-priced products and higher ASPs. During downturns consumers shift to value lines and financing, while AZEKs brand-led differentiation helps preserve sales mix and margins.
- discretionary budgets → trade-up to composites
- record-high homeowner equity in 2024 → supports premium ASPs
- downturns → value lines & financing gain share
- brand-led differentiation → protects mix & margins
Infra+IRA $1.2T lift recycled decking; tariffs 25%
US housing activity and $450B R&R underpin AZEK volumes; high 30-year rates (~7–7.5% mid-2025) shift demand from new builds to remodeling. Resin costs (linked to WTI ~$80/bbl in 2024) drive COGS volatility. Labor shortages and dealer inventory swings constrain installs and create lumpy orders.
| Metric | Value |
|---|---|
| New starts 2024 | ~900k |
| Existing sales 2024 | ~4.0M |
| 30-yr rate mid-2025 | 7–7.5% |
Preview Before You Purchase
AZEK PESTLE Analysis
The preview shown here is the exact AZEK PESTLE Analysis document you’ll receive after purchase—fully formatted, professionally structured, and ready to use. No placeholders or teasers; this is the real file. After payment you’ll instantly download this same finished document.











