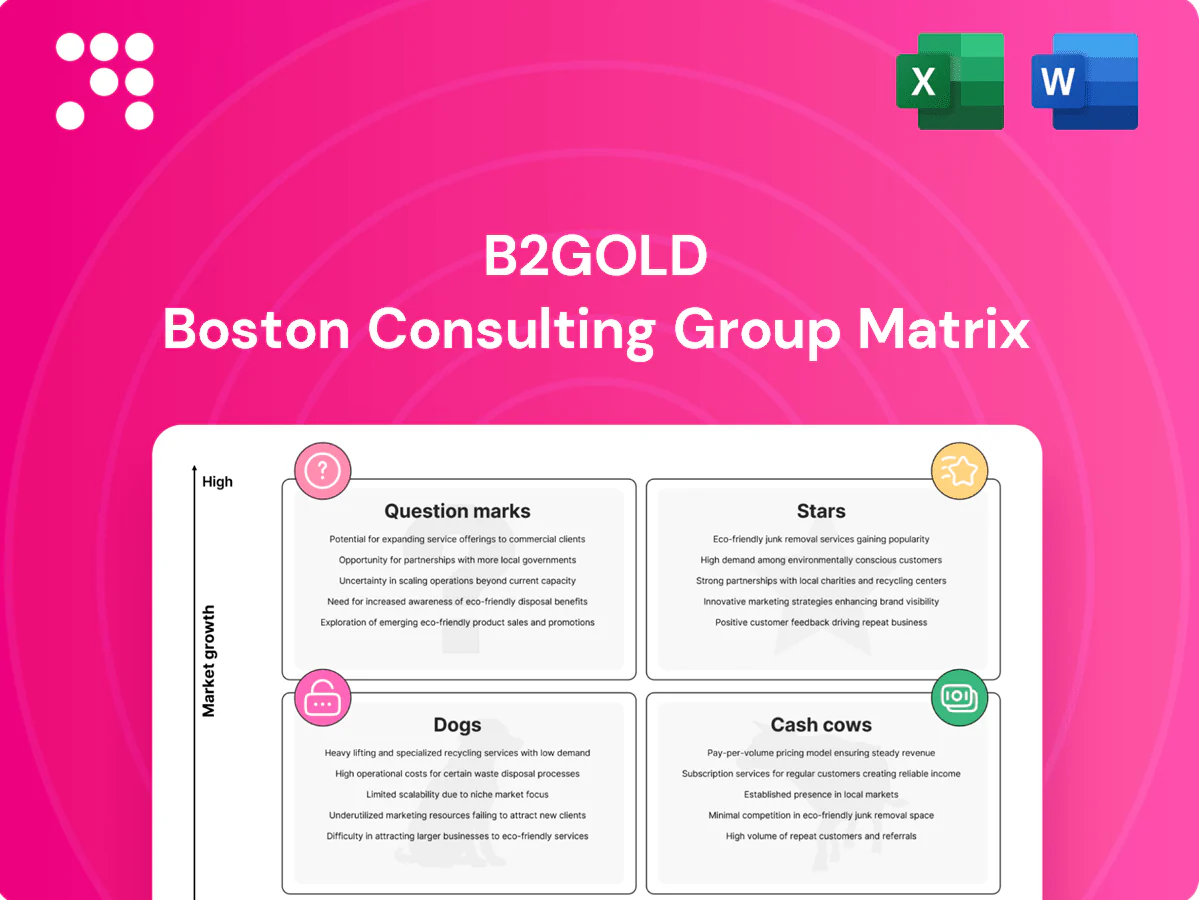
B2Gold Boston Consulting Group Matrix

Actionable Strategy Starts Here
Curious where B2Gold’s projects land—Stars, Cash Cows, Dogs or Question Marks? This snapshot teases the answers; the full BCG Matrix gives quadrant-by-quadrant clarity, data-backed recommendations, and actionable moves for capital allocation. Buy the complete report for a polished Word analysis plus an Excel summary you can present or model right away—skip the grunt work and get strategic confidence fast.
Stars

Fekola Mine (Mali)
Fekola Mine is B2Gold’s flagship, delivering the largest single-asset contribution within company 2024 guidance of roughly 1.05–1.10 million ounces, with Fekola supplying a material portion of that output.
It operates at industry-competitive low costs (AISC historically among B2Gold’s lowest) and sits in a district where incremental ounces and brownfield targets continue to emerge.
Maintaining steady sustaining and growth capex and tight operations is critical to hold market share as the district scales; continued investment can unlock further near-mine ounces as the growth curve normalizes.
Fekola Regional growth (near‑mine satellite pits)
New near‑mine satellites at Fekola extend mine life and keep the mill full, sustaining a dominant share in the growing regional micro‑market. Early wins compound quickly when trucking distances and strip ratios remain low, converting up‑front cash burn into rapid payback once blending stabilizes. Management should double down while the geology is still generous to maximize rolling IRR and throughput upside.

West Africa operating footprint
B2Gold's West Africa footprint leverages scale, local talent and supplier relationships to create a cost and execution flywheel across the expanding Sahel gold corridor; 2024 company guidance targets roughly 1.0 million ounces of production, underpinning regional market share as peers face higher costs. This edge demands heavier in‑region support and community investment, converting leadership today into cash flow tomorrow.

Brand as a reliable senior producer
Brand as a reliable senior producer: credibility with host governments, lenders and contractors gives B2Gold premium access to permits and JV slots; in 2024 the gold price averaged about US$2,100/oz, so trust converts to outsized growth capture during upswings while competitors scramble. Maintaining that promise requires higher sustaining spend on safety and ESG, which compounds the moat over time.
- Access: premium permitting and JV priority
- Upside: outsized slot capture in cycles (+growth leverage)
- Cost: higher sustaining safety/ESG spend
- Moat: trust compounds long-term value
Process excellence and low AISC culture
Process excellence and a low AISC culture keep B2Gold’s units at the left of the cost curve, turning continuous improvement into real share when margins expand faster than peers. Ongoing training and robust data systems require capital, but 2024’s average gold price near $2,100/oz and sector cash flows made such investments self-funding for many operators. Cash velocity from higher margins justifies the sustained spend to preserve star positioning.
- Left-of-curve cost position
- Requires training + data systems capex
- 2024 gold ≈ $2,100/oz supports cash reinvestment
Flagship mine fuels ~1.05–1.10 Moz 2024 guidance; low AISC enables reinvestment
Fekola is B2Gold’s flagship and largest single‑asset contributor to 2024 guidance of ~1.05–1.10 Moz; it operates at industry‑competitive low AISC and provides district growth optionality. Maintaining disciplined sustaining/growth capex and ramping near‑mine satellites preserves mill throughput and market share. B2Gold’s 2024 average gold price ~US$2,100/oz supports reinvestment to lock the star position.
| Metric | 2024 |
|---|---|
| Company production guidance | ~1.05–1.10 Moz |
| Average gold price | ~US$2,100/oz |
| Asset role | Fekola: flagship, largest single‑asset contributor |
What is included in the product
 Detailed Word Document
Concise B2Gold BCG Matrix review: positions Stars, Cash Cows, Question Marks, Dogs with investment, hold or divest guidance and trend context.

 Customizable Excel Spreadsheet
One-page B2Gold BCG Matrix maps units by quadrant to relieve strategic clutter and speed decisions.
Cash Cows

Masbate Mine (Philippines)
Masbate Mine (operating since 2009) delivers stable throughput and predictable grades within a mature Philippine operating environment, reliably funding larger capital projects across B2Gold’s portfolio. Growth runway is limited, so 2024 focus should be disciplined capex and maximizing uptime to preserve free cash flow. Prioritize milking reliability and cost control rather than expansion for expansion’s sake.
Otjikoto Mine (Namibia)
Otjikoto is a solid, well-defined open-pit orebody in Namibia delivering low-cost ounces in a supportive jurisdiction; 2024 production guidance sat around 125,000 ounces with an AISC near US$900/oz, underlining tight cost control. Declining reserve growth is evident, yet Otjikoto remains a dependable cash generator for B2Gold, contributing a material share of free cash flow. Prioritize low-capex debottlenecking and further cost-efficiency measures over large greenfield bets. Stretch mine life where project-level NPV remains positive; otherwise treat the asset as a harvest opportunity.

Established offtake and financing lines
Established offtake and financing lines give B2Gold lower cost of capital and smoother sales cycles, translating into steady free cash flow that funds growth. With 2024 production guidance of about 1.05–1.15 million oz, predictable ounces underpin reliable receipts. Maintain partner relationships, hedge selectively, and avoid fancy transactions. Reliability here bankrolls the question marks.

Shared services and regional supply chains
Shared services and regional supply chains drive procurement scale and common parts rationalization, keeping unit costs down and quietly enhancing margins in B2Gold’s mature operations. Continued modest investment in ERP, vendor KPIs and regional warehousing preserves efficiency without heavy capex. Each basis point saved on a 1 billion procurement base equals 100,000 straight to cash.
- Procurement scale
- Common parts
- Modest systems spend
- 1 bp on 1bn = 100,000 cash
Brownfield infill programs
Brownfield infill programs at B2Gold use short‑cycle drilling (6–12 months) to upgrade confidence, squeeze waste and modestly lift grades; growth is minimal but returns are tidy, supporting 2024 production of ~1.03 Moz while keeping AISC pressure manageable. Maintain strict hurdle rates (≥15%) to keep projects rolling and smooth production, sustaining the cash cow.
- cycle: 6–12 months
- impact: waste cut, grade lift
- growth: minimal, steady returns
- hurdle: ≥15%
Masbate & Otjikoto: predictable free cash flow, disciplined capex, selective brownfield infill
Masbate (operating since 2009) and Otjikoto (2024 ~125 koz, AISC ~US$900/oz) are B2Gold cash cows delivering predictable free cash flow; 2024 group guidance ~1.05–1.15 Moz underpins funding for higher‑risk projects. Focus: disciplined capex, uptime, cost control, selective brownfield infill (hurdle ≥15%) to extend life and maximize cash.
| Asset | 2024 prod (koz) | AISC (US$/oz) | Role |
|---|---|---|---|
| Masbate | — | Low | Stable cash |
| Otjikoto | 125 | ~900 | Cash generator |
What You See Is What You Get
B2Gold BCG Matrix
The B2Gold BCG Matrix you're previewing is the exact file you’ll receive after purchase — no watermarks, no placeholder content. It’s a fully formatted, analysis-ready report crafted by strategy experts for immediate use. Once bought, the full document is delivered to your inbox and is editable, printable, and presentation-ready. No surprises, just clear strategic insight you can plug into planning or client decks.

Actionable Strategy Starts Here
Curious where B2Gold’s projects land—Stars, Cash Cows, Dogs or Question Marks? This snapshot teases the answers; the full BCG Matrix gives quadrant-by-quadrant clarity, data-backed recommendations, and actionable moves for capital allocation. Buy the complete report for a polished Word analysis plus an Excel summary you can present or model right away—skip the grunt work and get strategic confidence fast.
Stars
Fekola Mine (Mali)
Fekola Mine is B2Gold’s flagship, delivering the largest single-asset contribution within company 2024 guidance of roughly 1.05–1.10 million ounces, with Fekola supplying a material portion of that output.
It operates at industry-competitive low costs (AISC historically among B2Gold’s lowest) and sits in a district where incremental ounces and brownfield targets continue to emerge.
Maintaining steady sustaining and growth capex and tight operations is critical to hold market share as the district scales; continued investment can unlock further near-mine ounces as the growth curve normalizes.
Fekola Regional growth (near‑mine satellite pits)
New near‑mine satellites at Fekola extend mine life and keep the mill full, sustaining a dominant share in the growing regional micro‑market. Early wins compound quickly when trucking distances and strip ratios remain low, converting up‑front cash burn into rapid payback once blending stabilizes. Management should double down while the geology is still generous to maximize rolling IRR and throughput upside.
West Africa operating footprint
B2Gold's West Africa footprint leverages scale, local talent and supplier relationships to create a cost and execution flywheel across the expanding Sahel gold corridor; 2024 company guidance targets roughly 1.0 million ounces of production, underpinning regional market share as peers face higher costs. This edge demands heavier in‑region support and community investment, converting leadership today into cash flow tomorrow.
Brand as a reliable senior producer
Brand as a reliable senior producer: credibility with host governments, lenders and contractors gives B2Gold premium access to permits and JV slots; in 2024 the gold price averaged about US$2,100/oz, so trust converts to outsized growth capture during upswings while competitors scramble. Maintaining that promise requires higher sustaining spend on safety and ESG, which compounds the moat over time.
- Access: premium permitting and JV priority
- Upside: outsized slot capture in cycles (+growth leverage)
- Cost: higher sustaining safety/ESG spend
- Moat: trust compounds long-term value
Process excellence and low AISC culture
Process excellence and a low AISC culture keep B2Gold’s units at the left of the cost curve, turning continuous improvement into real share when margins expand faster than peers. Ongoing training and robust data systems require capital, but 2024’s average gold price near $2,100/oz and sector cash flows made such investments self-funding for many operators. Cash velocity from higher margins justifies the sustained spend to preserve star positioning.
- Left-of-curve cost position
- Requires training + data systems capex
- 2024 gold ≈ $2,100/oz supports cash reinvestment
Flagship mine fuels ~1.05–1.10 Moz 2024 guidance; low AISC enables reinvestment
Fekola is B2Gold’s flagship and largest single‑asset contributor to 2024 guidance of ~1.05–1.10 Moz; it operates at industry‑competitive low AISC and provides district growth optionality. Maintaining disciplined sustaining/growth capex and ramping near‑mine satellites preserves mill throughput and market share. B2Gold’s 2024 average gold price ~US$2,100/oz supports reinvestment to lock the star position.
| Metric | 2024 |
|---|---|
| Company production guidance | ~1.05–1.10 Moz |
| Average gold price | ~US$2,100/oz |
| Asset role | Fekola: flagship, largest single‑asset contributor |
What is included in the product
Detailed Word Document
Concise B2Gold BCG Matrix review: positions Stars, Cash Cows, Question Marks, Dogs with investment, hold or divest guidance and trend context.
Customizable Excel Spreadsheet
One-page B2Gold BCG Matrix maps units by quadrant to relieve strategic clutter and speed decisions.
Cash Cows
Masbate Mine (Philippines)
Masbate Mine (operating since 2009) delivers stable throughput and predictable grades within a mature Philippine operating environment, reliably funding larger capital projects across B2Gold’s portfolio. Growth runway is limited, so 2024 focus should be disciplined capex and maximizing uptime to preserve free cash flow. Prioritize milking reliability and cost control rather than expansion for expansion’s sake.
Otjikoto Mine (Namibia)
Otjikoto is a solid, well-defined open-pit orebody in Namibia delivering low-cost ounces in a supportive jurisdiction; 2024 production guidance sat around 125,000 ounces with an AISC near US$900/oz, underlining tight cost control. Declining reserve growth is evident, yet Otjikoto remains a dependable cash generator for B2Gold, contributing a material share of free cash flow. Prioritize low-capex debottlenecking and further cost-efficiency measures over large greenfield bets. Stretch mine life where project-level NPV remains positive; otherwise treat the asset as a harvest opportunity.
Established offtake and financing lines
Established offtake and financing lines give B2Gold lower cost of capital and smoother sales cycles, translating into steady free cash flow that funds growth. With 2024 production guidance of about 1.05–1.15 million oz, predictable ounces underpin reliable receipts. Maintain partner relationships, hedge selectively, and avoid fancy transactions. Reliability here bankrolls the question marks.
Shared services and regional supply chains
Shared services and regional supply chains drive procurement scale and common parts rationalization, keeping unit costs down and quietly enhancing margins in B2Gold’s mature operations. Continued modest investment in ERP, vendor KPIs and regional warehousing preserves efficiency without heavy capex. Each basis point saved on a 1 billion procurement base equals 100,000 straight to cash.
- Procurement scale
- Common parts
- Modest systems spend
- 1 bp on 1bn = 100,000 cash
Brownfield infill programs
Brownfield infill programs at B2Gold use short‑cycle drilling (6–12 months) to upgrade confidence, squeeze waste and modestly lift grades; growth is minimal but returns are tidy, supporting 2024 production of ~1.03 Moz while keeping AISC pressure manageable. Maintain strict hurdle rates (≥15%) to keep projects rolling and smooth production, sustaining the cash cow.
- cycle: 6–12 months
- impact: waste cut, grade lift
- growth: minimal, steady returns
- hurdle: ≥15%
Masbate & Otjikoto: predictable free cash flow, disciplined capex, selective brownfield infill
Masbate (operating since 2009) and Otjikoto (2024 ~125 koz, AISC ~US$900/oz) are B2Gold cash cows delivering predictable free cash flow; 2024 group guidance ~1.05–1.15 Moz underpins funding for higher‑risk projects. Focus: disciplined capex, uptime, cost control, selective brownfield infill (hurdle ≥15%) to extend life and maximize cash.
| Asset | 2024 prod (koz) | AISC (US$/oz) | Role |
|---|---|---|---|
| Masbate | — | Low | Stable cash |
| Otjikoto | 125 | ~900 | Cash generator |
What You See Is What You Get
B2Gold BCG Matrix
The B2Gold BCG Matrix you're previewing is the exact file you’ll receive after purchase — no watermarks, no placeholder content. It’s a fully formatted, analysis-ready report crafted by strategy experts for immediate use. Once bought, the full document is delivered to your inbox and is editable, printable, and presentation-ready. No surprises, just clear strategic insight you can plug into planning or client decks.
Original: $10.00
-65%$10.00
$3.50Description
Actionable Strategy Starts Here
Curious where B2Gold’s projects land—Stars, Cash Cows, Dogs or Question Marks? This snapshot teases the answers; the full BCG Matrix gives quadrant-by-quadrant clarity, data-backed recommendations, and actionable moves for capital allocation. Buy the complete report for a polished Word analysis plus an Excel summary you can present or model right away—skip the grunt work and get strategic confidence fast.
Stars
Fekola Mine (Mali)
Fekola Mine is B2Gold’s flagship, delivering the largest single-asset contribution within company 2024 guidance of roughly 1.05–1.10 million ounces, with Fekola supplying a material portion of that output.
It operates at industry-competitive low costs (AISC historically among B2Gold’s lowest) and sits in a district where incremental ounces and brownfield targets continue to emerge.
Maintaining steady sustaining and growth capex and tight operations is critical to hold market share as the district scales; continued investment can unlock further near-mine ounces as the growth curve normalizes.
Fekola Regional growth (near‑mine satellite pits)
New near‑mine satellites at Fekola extend mine life and keep the mill full, sustaining a dominant share in the growing regional micro‑market. Early wins compound quickly when trucking distances and strip ratios remain low, converting up‑front cash burn into rapid payback once blending stabilizes. Management should double down while the geology is still generous to maximize rolling IRR and throughput upside.
West Africa operating footprint
B2Gold's West Africa footprint leverages scale, local talent and supplier relationships to create a cost and execution flywheel across the expanding Sahel gold corridor; 2024 company guidance targets roughly 1.0 million ounces of production, underpinning regional market share as peers face higher costs. This edge demands heavier in‑region support and community investment, converting leadership today into cash flow tomorrow.
Brand as a reliable senior producer
Brand as a reliable senior producer: credibility with host governments, lenders and contractors gives B2Gold premium access to permits and JV slots; in 2024 the gold price averaged about US$2,100/oz, so trust converts to outsized growth capture during upswings while competitors scramble. Maintaining that promise requires higher sustaining spend on safety and ESG, which compounds the moat over time.
- Access: premium permitting and JV priority
- Upside: outsized slot capture in cycles (+growth leverage)
- Cost: higher sustaining safety/ESG spend
- Moat: trust compounds long-term value
Process excellence and low AISC culture
Process excellence and a low AISC culture keep B2Gold’s units at the left of the cost curve, turning continuous improvement into real share when margins expand faster than peers. Ongoing training and robust data systems require capital, but 2024’s average gold price near $2,100/oz and sector cash flows made such investments self-funding for many operators. Cash velocity from higher margins justifies the sustained spend to preserve star positioning.
- Left-of-curve cost position
- Requires training + data systems capex
- 2024 gold ≈ $2,100/oz supports cash reinvestment
Flagship mine fuels ~1.05–1.10 Moz 2024 guidance; low AISC enables reinvestment
Fekola is B2Gold’s flagship and largest single‑asset contributor to 2024 guidance of ~1.05–1.10 Moz; it operates at industry‑competitive low AISC and provides district growth optionality. Maintaining disciplined sustaining/growth capex and ramping near‑mine satellites preserves mill throughput and market share. B2Gold’s 2024 average gold price ~US$2,100/oz supports reinvestment to lock the star position.
| Metric | 2024 |
|---|---|
| Company production guidance | ~1.05–1.10 Moz |
| Average gold price | ~US$2,100/oz |
| Asset role | Fekola: flagship, largest single‑asset contributor |
What is included in the product
Detailed Word Document
Concise B2Gold BCG Matrix review: positions Stars, Cash Cows, Question Marks, Dogs with investment, hold or divest guidance and trend context.
Customizable Excel Spreadsheet
One-page B2Gold BCG Matrix maps units by quadrant to relieve strategic clutter and speed decisions.
Cash Cows
Masbate Mine (Philippines)
Masbate Mine (operating since 2009) delivers stable throughput and predictable grades within a mature Philippine operating environment, reliably funding larger capital projects across B2Gold’s portfolio. Growth runway is limited, so 2024 focus should be disciplined capex and maximizing uptime to preserve free cash flow. Prioritize milking reliability and cost control rather than expansion for expansion’s sake.
Otjikoto Mine (Namibia)
Otjikoto is a solid, well-defined open-pit orebody in Namibia delivering low-cost ounces in a supportive jurisdiction; 2024 production guidance sat around 125,000 ounces with an AISC near US$900/oz, underlining tight cost control. Declining reserve growth is evident, yet Otjikoto remains a dependable cash generator for B2Gold, contributing a material share of free cash flow. Prioritize low-capex debottlenecking and further cost-efficiency measures over large greenfield bets. Stretch mine life where project-level NPV remains positive; otherwise treat the asset as a harvest opportunity.
Established offtake and financing lines
Established offtake and financing lines give B2Gold lower cost of capital and smoother sales cycles, translating into steady free cash flow that funds growth. With 2024 production guidance of about 1.05–1.15 million oz, predictable ounces underpin reliable receipts. Maintain partner relationships, hedge selectively, and avoid fancy transactions. Reliability here bankrolls the question marks.
Shared services and regional supply chains
Shared services and regional supply chains drive procurement scale and common parts rationalization, keeping unit costs down and quietly enhancing margins in B2Gold’s mature operations. Continued modest investment in ERP, vendor KPIs and regional warehousing preserves efficiency without heavy capex. Each basis point saved on a 1 billion procurement base equals 100,000 straight to cash.
- Procurement scale
- Common parts
- Modest systems spend
- 1 bp on 1bn = 100,000 cash
Brownfield infill programs
Brownfield infill programs at B2Gold use short‑cycle drilling (6–12 months) to upgrade confidence, squeeze waste and modestly lift grades; growth is minimal but returns are tidy, supporting 2024 production of ~1.03 Moz while keeping AISC pressure manageable. Maintain strict hurdle rates (≥15%) to keep projects rolling and smooth production, sustaining the cash cow.
- cycle: 6–12 months
- impact: waste cut, grade lift
- growth: minimal, steady returns
- hurdle: ≥15%
Masbate & Otjikoto: predictable free cash flow, disciplined capex, selective brownfield infill
Masbate (operating since 2009) and Otjikoto (2024 ~125 koz, AISC ~US$900/oz) are B2Gold cash cows delivering predictable free cash flow; 2024 group guidance ~1.05–1.15 Moz underpins funding for higher‑risk projects. Focus: disciplined capex, uptime, cost control, selective brownfield infill (hurdle ≥15%) to extend life and maximize cash.
| Asset | 2024 prod (koz) | AISC (US$/oz) | Role |
|---|---|---|---|
| Masbate | — | Low | Stable cash |
| Otjikoto | 125 | ~900 | Cash generator |
What You See Is What You Get
B2Gold BCG Matrix
The B2Gold BCG Matrix you're previewing is the exact file you’ll receive after purchase — no watermarks, no placeholder content. It’s a fully formatted, analysis-ready report crafted by strategy experts for immediate use. Once bought, the full document is delivered to your inbox and is editable, printable, and presentation-ready. No surprises, just clear strategic insight you can plug into planning or client decks.











