Babcock International Group Boston Consulting Group Matrix

Actionable Strategy Starts Here
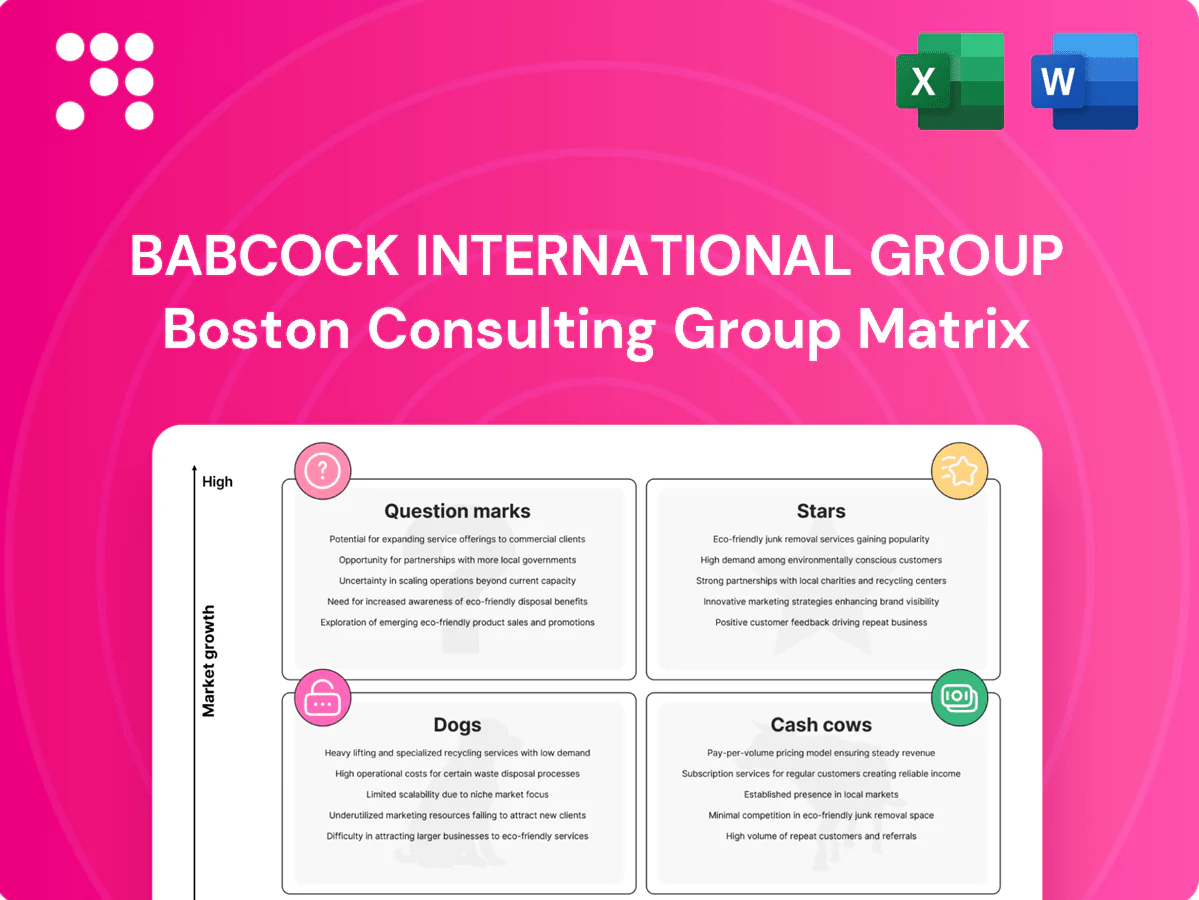
Babcock International’s BCG Matrix sketch shows where its defence and engineering units sit—some likely Stars driving growth, others steady Cash Cows funding the portfolio, and a few Question Marks that need choices. This quick read flags strategic pressure points and capital flows, but the full matrix gives the quadrant-by-quadrant data and clear moves to optimize performance. Dive deeper: purchase the complete BCG Matrix for a Word report + Excel summary with actionable recommendations you can use today.
Stars

UK naval fleet support programs
High-growth defense budgets—UK spending around £50bn in 2024—plus Babcock's top-tier share of Royal Navy sustainment position naval fleet support as a BCG Stars business. Babcock leads on availability, deep-dock capability and complex refits, underpinning FY2024 revenues near £3.1bn and a strong orderbook. The arm requires heavy capital and skilled talent but secures strategic positioning; keep investing to cement leadership before sector growth normalizes.
Submarine through-life engineering
Submarine through-life engineering is a nuclear-skilled, scarce-supply Stars business for Babcock, backed by the UK Dreadnought deterrent renewal valued at ~£31bn and an order book of ~£11bn in 2024. The technical moat and brutal switching costs lock customers in, producing chunky, recurring revenue but high cash intensity. Strategy: hold share, scale specialist skills and capitalise on the multi-decade upgrade wave.

Complex warship integration and refit
High-spec modifications, systems integration and upgrades are surging as fleets digitize, and Babcock’s reported order book of about £7.5bn in 2024 underpins its position in complex warship refits. The group owns hard-to-replicate dockside facilities and platform-level systems know-how that create high entry barriers. Margins hinge on flawless program control and delivery sequencing. Investing in tooling and programme talent converts backlog into market dominance.

Mission-critical training for defense and emergency services
Simulation, synthetic training and readiness services sit in structural growth: the global military simulation market was about $6.9bn in 2024 with a ~4.8% CAGR to 2030, supporting Babcock’s mission-critical training as a Star given its strong incumbency and proprietary data advantages that compound performance.
Requires ongoing content refresh and platform investment; scaling curricula and digital delivery can lock multi-year wins through repeatable service contracts and higher-margin software-enabled offerings.
- Market: $6.9bn (2024), CAGR ~4.8% to 2030
- Strength: incumbent contracts + data moat
- Need: content refresh, platform capex
- Strategy: scale curricula, digital delivery for multi-year retainers
International defense support (AUKUS, NATO allies)
Allies are rearming rapidly; SIPRI reported world military expenditure at $2.24 trillion in 2023 and NATO saw 23 members meet the 2% GDP target, driving demand for trusted sovereign suppliers in 2024. Babcock’s SC- and security-cleared heritage aligns with procurement where clearance matters; high market-entry capex and certification pay off via multi-year, sticky support contracts. Double down on partnerships to de-risk access.
- Demand: NATO/AUKUS surge
- Credential: cleared supplier advantage
- Cost: high entry, long payback
- Strategy: partner to de-risk access
Turn submarine refit backlog into high-return naval market leadership
Babcock’s naval sustainment and submarine through-life engineering are Stars: UK defence spend ~£50bn (2024) underpins FY2024 revenue ~£3.1bn and high-margin, capital‑intensive contracts; order book c.£11bn with ~£7.5bn in complex refits. Invest in docks, tooling and simulation to convert backlog into durable, high-return market leadership.
| Metric | 2024 | Note |
|---|---|---|
| UK defence spend | £50bn | 2024 |
| Babcock revenue | £3.1bn | FY2024 |
| Order book | £11bn | incl. £7.5bn refits |
What is included in the product
 Detailed Word Document
In-depth BCG Matrix review of Babcock units, spotlighting Stars, Cash Cows, Question Marks and Dogs with investment guidance.

 Customizable Excel Spreadsheet
One-page BCG matrix placing Babcock business units in quadrants — clarity for decisions, ready for C-suite and slides.
Cash Cows

Legacy naval base operations and maintenance
Legacy naval base operations and maintenance sit as a cash cow for Babcock, delivering mature, contracted revenue with predictable volumes that underpinned c.£2.8bn group revenue in FY 2024. Efficiency programmes flow straight to cash, boosting margins and free cash flow conversion. Competitive threat is limited by high asset specificity and long-term contracts. Maintain service levels, squeeze costs, and bank the yield.
Long-cycle asset management for land fleets
Long-cycle land-fleet asset management delivers stable utilization with established SLAs and low growth (2024 mid-single-digit sector expansion); process discipline and parts procurement drive margin, with Babcock citing >95% SLA compliance in recent contract reports. Customers resist change due to downtime risk, so optimizing supply chain, automating workflows and maintaining churn near zero preserves cash-cow returns.

Nuclear facility support and compliance services
Nuclear facility support and compliance services are a regulated, steady-cadence cash cow for Babcock, with high switching friction locking in long-term framework revenues and strong visibility. Modest growth is offset by predictable compliance work that funds capability retention and skills pipelines. The business generates reliable margins allowing harvest of cash flows while selectively upgrading toolsets and digital inspection platforms. Focus remains on efficiency and contract renewal discipline.

Technical training academies and apprenticeships
Technical training academies and apprenticeships are cash cows for Babcock: recurring cohorts and an accreditation flywheel deliver predictable revenue with moderate capex, and strong brand trust reduces acquisition costs; growth is flat but dependable, so standardizing delivery and improving utilization can lift free cash flow.
- recurring cohorts
- accreditation flywheel
- moderate capex
- brand trust lowers CAC
- flat but dependable growth
- standardize delivery to boost FCF
Spare parts, MRO frameworks, and field service
Contracted MRO with embedded teams and predictable call‑offs gives Babcock high share in a low‑growth MRO market (c.1–2% CAGR), driving stable mid‑teens service margins through scale and parts optimization; focus on tight inventory turns and uptime KPIs to sustain cash generation and avoid heavy capex.
- High share, low growth
- Predictable call‑offs
- Scale benefits margins
- Keep inventory sharp
- Milk, don’t over‑invest
Contracted cash cows: stable revenue, >95% SLA, mid‑teens margins, focus on margin capture
Babcock cash cows deliver predictable, contracted revenue (group revenue c.£2.8bn in FY2024), high SLA compliance (>95%) and mid‑teens service margins, generating strong free cash flow via efficiency programmes; low market growth (MRO c.1–2% CAGR) limits upside so focus is margin capture, supply‑chain optimization and contract retention.
| Segment | FY2024 | Margin | Growth | Key metric |
|---|---|---|---|---|
| Naval O&M | Contributes to c.£2.8bn | Mid‑teens | Flat | SLA >95% |
| MRO | Stable share | Mid‑teens | 1–2% CAGR | Predictable call‑offs |
Preview = Final Product
Babcock International Group BCG Matrix
The file you’re previewing is the exact Babcock International Group BCG Matrix report you’ll receive after purchase — no watermarks, no demo slides, just the fully formatted, ready-to-use analysis. Built for strategic clarity, it highlights stars, cash cows, question marks and dogs for Babcock’s portfolio with editable charts. Buy once, download immediately, present or tweak as needed — no surprises, just actionable insight.

Actionable Strategy Starts Here
Babcock International’s BCG Matrix sketch shows where its defence and engineering units sit—some likely Stars driving growth, others steady Cash Cows funding the portfolio, and a few Question Marks that need choices. This quick read flags strategic pressure points and capital flows, but the full matrix gives the quadrant-by-quadrant data and clear moves to optimize performance. Dive deeper: purchase the complete BCG Matrix for a Word report + Excel summary with actionable recommendations you can use today.
Stars
UK naval fleet support programs
High-growth defense budgets—UK spending around £50bn in 2024—plus Babcock's top-tier share of Royal Navy sustainment position naval fleet support as a BCG Stars business. Babcock leads on availability, deep-dock capability and complex refits, underpinning FY2024 revenues near £3.1bn and a strong orderbook. The arm requires heavy capital and skilled talent but secures strategic positioning; keep investing to cement leadership before sector growth normalizes.
Submarine through-life engineering
Submarine through-life engineering is a nuclear-skilled, scarce-supply Stars business for Babcock, backed by the UK Dreadnought deterrent renewal valued at ~£31bn and an order book of ~£11bn in 2024. The technical moat and brutal switching costs lock customers in, producing chunky, recurring revenue but high cash intensity. Strategy: hold share, scale specialist skills and capitalise on the multi-decade upgrade wave.
Complex warship integration and refit
High-spec modifications, systems integration and upgrades are surging as fleets digitize, and Babcock’s reported order book of about £7.5bn in 2024 underpins its position in complex warship refits. The group owns hard-to-replicate dockside facilities and platform-level systems know-how that create high entry barriers. Margins hinge on flawless program control and delivery sequencing. Investing in tooling and programme talent converts backlog into market dominance.
Mission-critical training for defense and emergency services
Simulation, synthetic training and readiness services sit in structural growth: the global military simulation market was about $6.9bn in 2024 with a ~4.8% CAGR to 2030, supporting Babcock’s mission-critical training as a Star given its strong incumbency and proprietary data advantages that compound performance.
Requires ongoing content refresh and platform investment; scaling curricula and digital delivery can lock multi-year wins through repeatable service contracts and higher-margin software-enabled offerings.
- Market: $6.9bn (2024), CAGR ~4.8% to 2030
- Strength: incumbent contracts + data moat
- Need: content refresh, platform capex
- Strategy: scale curricula, digital delivery for multi-year retainers
International defense support (AUKUS, NATO allies)
Allies are rearming rapidly; SIPRI reported world military expenditure at $2.24 trillion in 2023 and NATO saw 23 members meet the 2% GDP target, driving demand for trusted sovereign suppliers in 2024. Babcock’s SC- and security-cleared heritage aligns with procurement where clearance matters; high market-entry capex and certification pay off via multi-year, sticky support contracts. Double down on partnerships to de-risk access.
- Demand: NATO/AUKUS surge
- Credential: cleared supplier advantage
- Cost: high entry, long payback
- Strategy: partner to de-risk access
Turn submarine refit backlog into high-return naval market leadership
Babcock’s naval sustainment and submarine through-life engineering are Stars: UK defence spend ~£50bn (2024) underpins FY2024 revenue ~£3.1bn and high-margin, capital‑intensive contracts; order book c.£11bn with ~£7.5bn in complex refits. Invest in docks, tooling and simulation to convert backlog into durable, high-return market leadership.
| Metric | 2024 | Note |
|---|---|---|
| UK defence spend | £50bn | 2024 |
| Babcock revenue | £3.1bn | FY2024 |
| Order book | £11bn | incl. £7.5bn refits |
What is included in the product
Detailed Word Document
In-depth BCG Matrix review of Babcock units, spotlighting Stars, Cash Cows, Question Marks and Dogs with investment guidance.
Customizable Excel Spreadsheet
One-page BCG matrix placing Babcock business units in quadrants — clarity for decisions, ready for C-suite and slides.
Cash Cows
Legacy naval base operations and maintenance
Legacy naval base operations and maintenance sit as a cash cow for Babcock, delivering mature, contracted revenue with predictable volumes that underpinned c.£2.8bn group revenue in FY 2024. Efficiency programmes flow straight to cash, boosting margins and free cash flow conversion. Competitive threat is limited by high asset specificity and long-term contracts. Maintain service levels, squeeze costs, and bank the yield.
Long-cycle asset management for land fleets
Long-cycle land-fleet asset management delivers stable utilization with established SLAs and low growth (2024 mid-single-digit sector expansion); process discipline and parts procurement drive margin, with Babcock citing >95% SLA compliance in recent contract reports. Customers resist change due to downtime risk, so optimizing supply chain, automating workflows and maintaining churn near zero preserves cash-cow returns.
Nuclear facility support and compliance services
Nuclear facility support and compliance services are a regulated, steady-cadence cash cow for Babcock, with high switching friction locking in long-term framework revenues and strong visibility. Modest growth is offset by predictable compliance work that funds capability retention and skills pipelines. The business generates reliable margins allowing harvest of cash flows while selectively upgrading toolsets and digital inspection platforms. Focus remains on efficiency and contract renewal discipline.
Technical training academies and apprenticeships
Technical training academies and apprenticeships are cash cows for Babcock: recurring cohorts and an accreditation flywheel deliver predictable revenue with moderate capex, and strong brand trust reduces acquisition costs; growth is flat but dependable, so standardizing delivery and improving utilization can lift free cash flow.
- recurring cohorts
- accreditation flywheel
- moderate capex
- brand trust lowers CAC
- flat but dependable growth
- standardize delivery to boost FCF
Spare parts, MRO frameworks, and field service
Contracted MRO with embedded teams and predictable call‑offs gives Babcock high share in a low‑growth MRO market (c.1–2% CAGR), driving stable mid‑teens service margins through scale and parts optimization; focus on tight inventory turns and uptime KPIs to sustain cash generation and avoid heavy capex.
- High share, low growth
- Predictable call‑offs
- Scale benefits margins
- Keep inventory sharp
- Milk, don’t over‑invest
Contracted cash cows: stable revenue, >95% SLA, mid‑teens margins, focus on margin capture
Babcock cash cows deliver predictable, contracted revenue (group revenue c.£2.8bn in FY2024), high SLA compliance (>95%) and mid‑teens service margins, generating strong free cash flow via efficiency programmes; low market growth (MRO c.1–2% CAGR) limits upside so focus is margin capture, supply‑chain optimization and contract retention.
| Segment | FY2024 | Margin | Growth | Key metric |
|---|---|---|---|---|
| Naval O&M | Contributes to c.£2.8bn | Mid‑teens | Flat | SLA >95% |
| MRO | Stable share | Mid‑teens | 1–2% CAGR | Predictable call‑offs |
Preview = Final Product
Babcock International Group BCG Matrix
The file you’re previewing is the exact Babcock International Group BCG Matrix report you’ll receive after purchase — no watermarks, no demo slides, just the fully formatted, ready-to-use analysis. Built for strategic clarity, it highlights stars, cash cows, question marks and dogs for Babcock’s portfolio with editable charts. Buy once, download immediately, present or tweak as needed — no surprises, just actionable insight.
Original: $10.00
-65%$10.00
$3.50Description
Actionable Strategy Starts Here
Babcock International’s BCG Matrix sketch shows where its defence and engineering units sit—some likely Stars driving growth, others steady Cash Cows funding the portfolio, and a few Question Marks that need choices. This quick read flags strategic pressure points and capital flows, but the full matrix gives the quadrant-by-quadrant data and clear moves to optimize performance. Dive deeper: purchase the complete BCG Matrix for a Word report + Excel summary with actionable recommendations you can use today.
Stars
UK naval fleet support programs
High-growth defense budgets—UK spending around £50bn in 2024—plus Babcock's top-tier share of Royal Navy sustainment position naval fleet support as a BCG Stars business. Babcock leads on availability, deep-dock capability and complex refits, underpinning FY2024 revenues near £3.1bn and a strong orderbook. The arm requires heavy capital and skilled talent but secures strategic positioning; keep investing to cement leadership before sector growth normalizes.
Submarine through-life engineering
Submarine through-life engineering is a nuclear-skilled, scarce-supply Stars business for Babcock, backed by the UK Dreadnought deterrent renewal valued at ~£31bn and an order book of ~£11bn in 2024. The technical moat and brutal switching costs lock customers in, producing chunky, recurring revenue but high cash intensity. Strategy: hold share, scale specialist skills and capitalise on the multi-decade upgrade wave.
Complex warship integration and refit
High-spec modifications, systems integration and upgrades are surging as fleets digitize, and Babcock’s reported order book of about £7.5bn in 2024 underpins its position in complex warship refits. The group owns hard-to-replicate dockside facilities and platform-level systems know-how that create high entry barriers. Margins hinge on flawless program control and delivery sequencing. Investing in tooling and programme talent converts backlog into market dominance.
Mission-critical training for defense and emergency services
Simulation, synthetic training and readiness services sit in structural growth: the global military simulation market was about $6.9bn in 2024 with a ~4.8% CAGR to 2030, supporting Babcock’s mission-critical training as a Star given its strong incumbency and proprietary data advantages that compound performance.
Requires ongoing content refresh and platform investment; scaling curricula and digital delivery can lock multi-year wins through repeatable service contracts and higher-margin software-enabled offerings.
- Market: $6.9bn (2024), CAGR ~4.8% to 2030
- Strength: incumbent contracts + data moat
- Need: content refresh, platform capex
- Strategy: scale curricula, digital delivery for multi-year retainers
International defense support (AUKUS, NATO allies)
Allies are rearming rapidly; SIPRI reported world military expenditure at $2.24 trillion in 2023 and NATO saw 23 members meet the 2% GDP target, driving demand for trusted sovereign suppliers in 2024. Babcock’s SC- and security-cleared heritage aligns with procurement where clearance matters; high market-entry capex and certification pay off via multi-year, sticky support contracts. Double down on partnerships to de-risk access.
- Demand: NATO/AUKUS surge
- Credential: cleared supplier advantage
- Cost: high entry, long payback
- Strategy: partner to de-risk access
Turn submarine refit backlog into high-return naval market leadership
Babcock’s naval sustainment and submarine through-life engineering are Stars: UK defence spend ~£50bn (2024) underpins FY2024 revenue ~£3.1bn and high-margin, capital‑intensive contracts; order book c.£11bn with ~£7.5bn in complex refits. Invest in docks, tooling and simulation to convert backlog into durable, high-return market leadership.
| Metric | 2024 | Note |
|---|---|---|
| UK defence spend | £50bn | 2024 |
| Babcock revenue | £3.1bn | FY2024 |
| Order book | £11bn | incl. £7.5bn refits |
What is included in the product
Detailed Word Document
In-depth BCG Matrix review of Babcock units, spotlighting Stars, Cash Cows, Question Marks and Dogs with investment guidance.
Customizable Excel Spreadsheet
One-page BCG matrix placing Babcock business units in quadrants — clarity for decisions, ready for C-suite and slides.
Cash Cows
Legacy naval base operations and maintenance
Legacy naval base operations and maintenance sit as a cash cow for Babcock, delivering mature, contracted revenue with predictable volumes that underpinned c.£2.8bn group revenue in FY 2024. Efficiency programmes flow straight to cash, boosting margins and free cash flow conversion. Competitive threat is limited by high asset specificity and long-term contracts. Maintain service levels, squeeze costs, and bank the yield.
Long-cycle asset management for land fleets
Long-cycle land-fleet asset management delivers stable utilization with established SLAs and low growth (2024 mid-single-digit sector expansion); process discipline and parts procurement drive margin, with Babcock citing >95% SLA compliance in recent contract reports. Customers resist change due to downtime risk, so optimizing supply chain, automating workflows and maintaining churn near zero preserves cash-cow returns.
Nuclear facility support and compliance services
Nuclear facility support and compliance services are a regulated, steady-cadence cash cow for Babcock, with high switching friction locking in long-term framework revenues and strong visibility. Modest growth is offset by predictable compliance work that funds capability retention and skills pipelines. The business generates reliable margins allowing harvest of cash flows while selectively upgrading toolsets and digital inspection platforms. Focus remains on efficiency and contract renewal discipline.
Technical training academies and apprenticeships
Technical training academies and apprenticeships are cash cows for Babcock: recurring cohorts and an accreditation flywheel deliver predictable revenue with moderate capex, and strong brand trust reduces acquisition costs; growth is flat but dependable, so standardizing delivery and improving utilization can lift free cash flow.
- recurring cohorts
- accreditation flywheel
- moderate capex
- brand trust lowers CAC
- flat but dependable growth
- standardize delivery to boost FCF
Spare parts, MRO frameworks, and field service
Contracted MRO with embedded teams and predictable call‑offs gives Babcock high share in a low‑growth MRO market (c.1–2% CAGR), driving stable mid‑teens service margins through scale and parts optimization; focus on tight inventory turns and uptime KPIs to sustain cash generation and avoid heavy capex.
- High share, low growth
- Predictable call‑offs
- Scale benefits margins
- Keep inventory sharp
- Milk, don’t over‑invest
Contracted cash cows: stable revenue, >95% SLA, mid‑teens margins, focus on margin capture
Babcock cash cows deliver predictable, contracted revenue (group revenue c.£2.8bn in FY2024), high SLA compliance (>95%) and mid‑teens service margins, generating strong free cash flow via efficiency programmes; low market growth (MRO c.1–2% CAGR) limits upside so focus is margin capture, supply‑chain optimization and contract retention.
| Segment | FY2024 | Margin | Growth | Key metric |
|---|---|---|---|---|
| Naval O&M | Contributes to c.£2.8bn | Mid‑teens | Flat | SLA >95% |
| MRO | Stable share | Mid‑teens | 1–2% CAGR | Predictable call‑offs |
Preview = Final Product
Babcock International Group BCG Matrix
The file you’re previewing is the exact Babcock International Group BCG Matrix report you’ll receive after purchase — no watermarks, no demo slides, just the fully formatted, ready-to-use analysis. Built for strategic clarity, it highlights stars, cash cows, question marks and dogs for Babcock’s portfolio with editable charts. Buy once, download immediately, present or tweak as needed — no surprises, just actionable insight.











