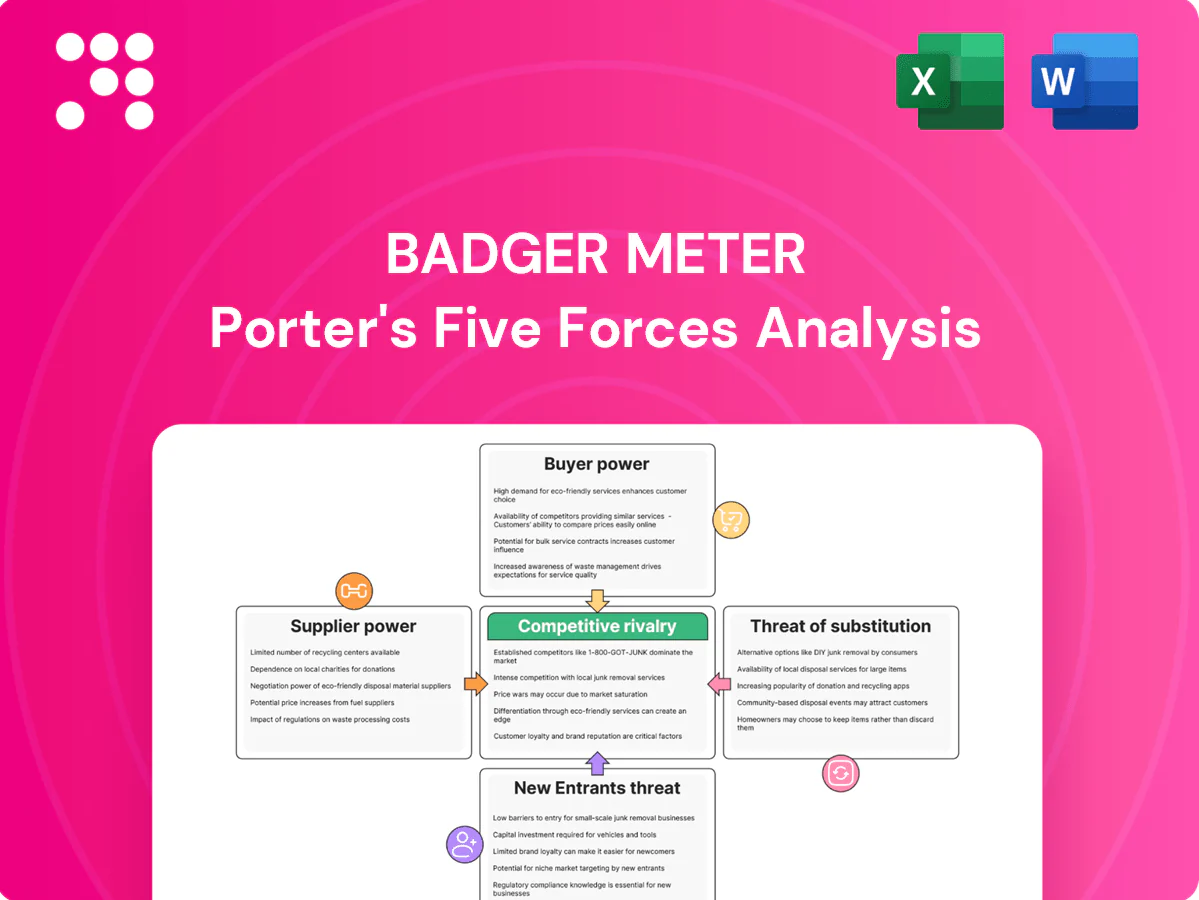
Badger Meter Porter's Five Forces Analysis

Don't Miss the Bigger Picture
Badger Meter faces moderate supplier power, steady buyer demand, and rising competitive pressure from smart metering rivals, while regulatory and substitution risks shape strategic choices for growth. This snapshot highlights key tensions in pricing, innovation, and channel dynamics that drive its market positioning. Unlock the full Porter's Five Forces Analysis to explore force-by-force ratings, visuals, and actionable recommendations tailored to Badger Meter.
Suppliers Bargaining Power

Concentrated specialty components
Ultrasonic transducers, RF modules and precision castings for Badger Meter come from a relatively limited pool of qualified suppliers, concentrating supply and raising switching costs. Qualification and validation cycles often run 6–12 months, giving niche vendors leverage on pricing and lead times. Disruptions can ripple into production schedules and compress margins, with lead times frequently extending several months.
Electronics and semiconductor dependencies
Smart meters and endpoints depend on microcontrollers, sensors and connectivity chipsets that experienced lead times of 20+ weeks during recent cyclic shortages, and allocation typically favors higher-volume customers, squeezing smaller orders. Long-term supply agreements and buffer inventories reduce but do not eliminate disruption risk. Cost inflation from component shortages is difficult to pass through in fixed-bid utility contracts, pressuring margins.

Standards-driven vendor lock
Compliance with AWWA, NSF‑61, MID and recognized cybersecurity frameworks sharply narrows eligible suppliers for Badger Meter products, since each component must meet potable‑water safety and metrology rules. Once a component is certified in a design, requalification requires lab testing and field validation and is time‑consuming and costly, strengthening approved suppliers’ negotiating leverage. Dual‑sourcing can reduce risk but demands full requalification for the alternate vendor, so it is feasible but not trivial.

Mitigating in-house capabilities
Badger Meter’s in-house manufacturing and design control limit supplier leverage; engineering-led redesigns and dual-sourcing have reduced single-vendor dependence, supporting resilience alongside FY2024 revenue of $558.8 million and gross margin expansion that funded CAPEX in 2024.
- In-house design reduces vendor reliance
- Redesigns dilute supplier power
- VMI, should-cost analytics aid negotiations
- Specialized parts remain chokepoints
Commodity inputs with hedging
Brass, copper, and resins remain widely available but price-volatile; LME copper averaged about $9,500/ton in 2024 while polymer resin markets saw recurring swings linked to feedstock and demand—pressures Badger Meter mitigates with hedging and indexed contracts that limit supplier pricing power.
- Hedging: reduces input volatility
- Indexed contracts: cap pass-through risk
- Global sourcing: regional substitutes
- Logistics shocks: transient supplier leverage
Supply risks: 6-12 months requalification, chipsets 20+ weeks, copper $9,500/ton
Supplier power is moderate-to-high due to a concentrated pool for precision components and 6–12 month requalification cycles that raise switching costs. Connectivity chipsets saw 20+ week lead times in shortages, favoring large customers. Badger Meter’s FY2024 revenue of $558.8M and hedging/indexed contracts mitigate input-price impacts; LME copper averaged ~$9,500/ton in 2024.
| Metric | Value |
|---|---|
| FY2024 revenue | $558.8M |
| Qualification cycle | 6–12 months |
| Chipset lead times | 20+ weeks |
| LME copper 2024 | $9,500/ton |
What is included in the product
 Detailed Word Document
Comprehensive Porter's Five Forces for Badger Meter assessing competitive rivalry from global meter and smart-water players, buyer and supplier bargaining power, threats from digital substitutes and low-cost entrants, and barriers driven by regulation, scale, and proprietary IoT/data capabilities.

 Customizable Excel Spreadsheet
A concise one-sheet Porter's Five Forces for Badger Meter that visualizes competitive pressures and lets you tweak force levels to model regulation, new entrants, or technology shifts—ideal for slides, dashboards, and quick strategic decisions.
Customers Bargaining Power

Municipal utility concentration
Large municipal utilities concentrate buying power, issuing sizable, infrequent tenders that give them strong pricing leverage and force competitive RFPs with multi-year frameworks and deep discounts. Procurement increasingly prioritizes lifecycle cost and reliability over lowest upfront price, with long-term service concessions and performance SLAs common. The US has roughly 151,000 public water systems, including about 54,000 community systems, making references and proven performance history decisive in awards.
High switching costs and lock-in
Installed bases of Badger Meter devices and AMI networks, plus analytics platforms, create strong technical and data lock-in by 2024; integrations with billing and GIS systems make rip-and-replace costly and operationally risky, reducing buyer power post-deployment and enabling vendors to sustain margins on upgrades and recurring software services.

Industrial and OEM fragmentation
Commercial/industrial and OEM customers are highly fragmented, diluting individual buyer influence and favoring suppliers with broad distribution. Technical specs and certifications remain decisive; as of 2024 ISO 9001 is the most widely used quality management standard and ANSI/ASME approvals often gate supplier selection. Shorter sales cycles and repeat OEM orders help stabilize pricing. Clear performance differentiation enables value-based selling.

Performance and SLA sensitivity
Customers prioritize meter accuracy (<1% target), multi‑year battery life (industry targets ~10 years) and cybersecurity; 2024 procurement benchmarks demand 99.9% SLA uptime, 3–5 year warranties and integration assurance, with field support mandatory. Vendors that meet KPIs can sustain price premiums; missed SLAs trigger financial penalties (commonly 1–5% of contract value) and reputational risk.
- Accuracy: <1% target
- Battery: ~10‑year target
- SLA: 99.9% uptime
- Warranties/support: 3–5 years; penalties 1–5%
Global public procurement norms
Global public procurement transparency rules and local-content preferences constrain Badger Meter's pricing and require disclosure; public procurement represented roughly 12–20% of GDP globally in 2024. Multi-stage pilots and approvals extend purchase cycles, giving buyers leverage. Currency and funding constraints shift order timing; framework agreements commonly cap annual increases near CPI (~3–5% in 2024).
- PublicProcure: 12–20%GDP
- CycleLeverage: multi-stage pilots
- FundingRisk: FX and budget timing
- PriceCap: CPI-linked 3–5%
Municipal utilities concentrate buying power; compliant vendors command premiums
Large municipal utilities (≈151,000 US public water systems; ≈54,000 community) concentrate buying power and force competitive multi‑year tenders. Installed bases and AMI integrations create strong lock‑in, reducing post‑deployment buyer leverage. Procurement benchmarks (accuracy <1%, battery ≈10y, SLA 99.9%) let compliant vendors command premiums.
| Metric | 2024 |
|---|---|
| US public water systems | 151,000 |
| Community systems | 54,000 |
| Accuracy target | <1% |
| Battery target | ≈10 years |
| SLA | 99.9% |
| Public procurement | 12–20% GDP |
Preview the Actual Deliverable
Badger Meter Porter's Five Forces Analysis
This preview shows the exact Badger Meter Porter’s Five Forces analysis you'll receive immediately after purchase—no placeholders or samples. The document is fully formatted, professionally written, and ready for use upon download. You're viewing the final deliverable; completing your purchase grants instant access to this identical file.

Don't Miss the Bigger Picture
Badger Meter faces moderate supplier power, steady buyer demand, and rising competitive pressure from smart metering rivals, while regulatory and substitution risks shape strategic choices for growth. This snapshot highlights key tensions in pricing, innovation, and channel dynamics that drive its market positioning. Unlock the full Porter's Five Forces Analysis to explore force-by-force ratings, visuals, and actionable recommendations tailored to Badger Meter.
Suppliers Bargaining Power
Concentrated specialty components
Ultrasonic transducers, RF modules and precision castings for Badger Meter come from a relatively limited pool of qualified suppliers, concentrating supply and raising switching costs. Qualification and validation cycles often run 6–12 months, giving niche vendors leverage on pricing and lead times. Disruptions can ripple into production schedules and compress margins, with lead times frequently extending several months.
Electronics and semiconductor dependencies
Smart meters and endpoints depend on microcontrollers, sensors and connectivity chipsets that experienced lead times of 20+ weeks during recent cyclic shortages, and allocation typically favors higher-volume customers, squeezing smaller orders. Long-term supply agreements and buffer inventories reduce but do not eliminate disruption risk. Cost inflation from component shortages is difficult to pass through in fixed-bid utility contracts, pressuring margins.
Standards-driven vendor lock
Compliance with AWWA, NSF‑61, MID and recognized cybersecurity frameworks sharply narrows eligible suppliers for Badger Meter products, since each component must meet potable‑water safety and metrology rules. Once a component is certified in a design, requalification requires lab testing and field validation and is time‑consuming and costly, strengthening approved suppliers’ negotiating leverage. Dual‑sourcing can reduce risk but demands full requalification for the alternate vendor, so it is feasible but not trivial.
Mitigating in-house capabilities
Badger Meter’s in-house manufacturing and design control limit supplier leverage; engineering-led redesigns and dual-sourcing have reduced single-vendor dependence, supporting resilience alongside FY2024 revenue of $558.8 million and gross margin expansion that funded CAPEX in 2024.
- In-house design reduces vendor reliance
- Redesigns dilute supplier power
- VMI, should-cost analytics aid negotiations
- Specialized parts remain chokepoints
Commodity inputs with hedging
Brass, copper, and resins remain widely available but price-volatile; LME copper averaged about $9,500/ton in 2024 while polymer resin markets saw recurring swings linked to feedstock and demand—pressures Badger Meter mitigates with hedging and indexed contracts that limit supplier pricing power.
- Hedging: reduces input volatility
- Indexed contracts: cap pass-through risk
- Global sourcing: regional substitutes
- Logistics shocks: transient supplier leverage
Supply risks: 6-12 months requalification, chipsets 20+ weeks, copper $9,500/ton
Supplier power is moderate-to-high due to a concentrated pool for precision components and 6–12 month requalification cycles that raise switching costs. Connectivity chipsets saw 20+ week lead times in shortages, favoring large customers. Badger Meter’s FY2024 revenue of $558.8M and hedging/indexed contracts mitigate input-price impacts; LME copper averaged ~$9,500/ton in 2024.
| Metric | Value |
|---|---|
| FY2024 revenue | $558.8M |
| Qualification cycle | 6–12 months |
| Chipset lead times | 20+ weeks |
| LME copper 2024 | $9,500/ton |
What is included in the product
Detailed Word Document
Comprehensive Porter's Five Forces for Badger Meter assessing competitive rivalry from global meter and smart-water players, buyer and supplier bargaining power, threats from digital substitutes and low-cost entrants, and barriers driven by regulation, scale, and proprietary IoT/data capabilities.
Customizable Excel Spreadsheet
A concise one-sheet Porter's Five Forces for Badger Meter that visualizes competitive pressures and lets you tweak force levels to model regulation, new entrants, or technology shifts—ideal for slides, dashboards, and quick strategic decisions.
Customers Bargaining Power
Municipal utility concentration
Large municipal utilities concentrate buying power, issuing sizable, infrequent tenders that give them strong pricing leverage and force competitive RFPs with multi-year frameworks and deep discounts. Procurement increasingly prioritizes lifecycle cost and reliability over lowest upfront price, with long-term service concessions and performance SLAs common. The US has roughly 151,000 public water systems, including about 54,000 community systems, making references and proven performance history decisive in awards.
High switching costs and lock-in
Installed bases of Badger Meter devices and AMI networks, plus analytics platforms, create strong technical and data lock-in by 2024; integrations with billing and GIS systems make rip-and-replace costly and operationally risky, reducing buyer power post-deployment and enabling vendors to sustain margins on upgrades and recurring software services.
Industrial and OEM fragmentation
Commercial/industrial and OEM customers are highly fragmented, diluting individual buyer influence and favoring suppliers with broad distribution. Technical specs and certifications remain decisive; as of 2024 ISO 9001 is the most widely used quality management standard and ANSI/ASME approvals often gate supplier selection. Shorter sales cycles and repeat OEM orders help stabilize pricing. Clear performance differentiation enables value-based selling.
Performance and SLA sensitivity
Customers prioritize meter accuracy (<1% target), multi‑year battery life (industry targets ~10 years) and cybersecurity; 2024 procurement benchmarks demand 99.9% SLA uptime, 3–5 year warranties and integration assurance, with field support mandatory. Vendors that meet KPIs can sustain price premiums; missed SLAs trigger financial penalties (commonly 1–5% of contract value) and reputational risk.
- Accuracy: <1% target
- Battery: ~10‑year target
- SLA: 99.9% uptime
- Warranties/support: 3–5 years; penalties 1–5%
Global public procurement norms
Global public procurement transparency rules and local-content preferences constrain Badger Meter's pricing and require disclosure; public procurement represented roughly 12–20% of GDP globally in 2024. Multi-stage pilots and approvals extend purchase cycles, giving buyers leverage. Currency and funding constraints shift order timing; framework agreements commonly cap annual increases near CPI (~3–5% in 2024).
- PublicProcure: 12–20%GDP
- CycleLeverage: multi-stage pilots
- FundingRisk: FX and budget timing
- PriceCap: CPI-linked 3–5%
Municipal utilities concentrate buying power; compliant vendors command premiums
Large municipal utilities (≈151,000 US public water systems; ≈54,000 community) concentrate buying power and force competitive multi‑year tenders. Installed bases and AMI integrations create strong lock‑in, reducing post‑deployment buyer leverage. Procurement benchmarks (accuracy <1%, battery ≈10y, SLA 99.9%) let compliant vendors command premiums.
| Metric | 2024 |
|---|---|
| US public water systems | 151,000 |
| Community systems | 54,000 |
| Accuracy target | <1% |
| Battery target | ≈10 years |
| SLA | 99.9% |
| Public procurement | 12–20% GDP |
Preview the Actual Deliverable
Badger Meter Porter's Five Forces Analysis
This preview shows the exact Badger Meter Porter’s Five Forces analysis you'll receive immediately after purchase—no placeholders or samples. The document is fully formatted, professionally written, and ready for use upon download. You're viewing the final deliverable; completing your purchase grants instant access to this identical file.
Original: $10.00
-65%$10.00
$3.50Description
Don't Miss the Bigger Picture
Badger Meter faces moderate supplier power, steady buyer demand, and rising competitive pressure from smart metering rivals, while regulatory and substitution risks shape strategic choices for growth. This snapshot highlights key tensions in pricing, innovation, and channel dynamics that drive its market positioning. Unlock the full Porter's Five Forces Analysis to explore force-by-force ratings, visuals, and actionable recommendations tailored to Badger Meter.
Suppliers Bargaining Power
Concentrated specialty components
Ultrasonic transducers, RF modules and precision castings for Badger Meter come from a relatively limited pool of qualified suppliers, concentrating supply and raising switching costs. Qualification and validation cycles often run 6–12 months, giving niche vendors leverage on pricing and lead times. Disruptions can ripple into production schedules and compress margins, with lead times frequently extending several months.
Electronics and semiconductor dependencies
Smart meters and endpoints depend on microcontrollers, sensors and connectivity chipsets that experienced lead times of 20+ weeks during recent cyclic shortages, and allocation typically favors higher-volume customers, squeezing smaller orders. Long-term supply agreements and buffer inventories reduce but do not eliminate disruption risk. Cost inflation from component shortages is difficult to pass through in fixed-bid utility contracts, pressuring margins.
Standards-driven vendor lock
Compliance with AWWA, NSF‑61, MID and recognized cybersecurity frameworks sharply narrows eligible suppliers for Badger Meter products, since each component must meet potable‑water safety and metrology rules. Once a component is certified in a design, requalification requires lab testing and field validation and is time‑consuming and costly, strengthening approved suppliers’ negotiating leverage. Dual‑sourcing can reduce risk but demands full requalification for the alternate vendor, so it is feasible but not trivial.
Mitigating in-house capabilities
Badger Meter’s in-house manufacturing and design control limit supplier leverage; engineering-led redesigns and dual-sourcing have reduced single-vendor dependence, supporting resilience alongside FY2024 revenue of $558.8 million and gross margin expansion that funded CAPEX in 2024.
- In-house design reduces vendor reliance
- Redesigns dilute supplier power
- VMI, should-cost analytics aid negotiations
- Specialized parts remain chokepoints
Commodity inputs with hedging
Brass, copper, and resins remain widely available but price-volatile; LME copper averaged about $9,500/ton in 2024 while polymer resin markets saw recurring swings linked to feedstock and demand—pressures Badger Meter mitigates with hedging and indexed contracts that limit supplier pricing power.
- Hedging: reduces input volatility
- Indexed contracts: cap pass-through risk
- Global sourcing: regional substitutes
- Logistics shocks: transient supplier leverage
Supply risks: 6-12 months requalification, chipsets 20+ weeks, copper $9,500/ton
Supplier power is moderate-to-high due to a concentrated pool for precision components and 6–12 month requalification cycles that raise switching costs. Connectivity chipsets saw 20+ week lead times in shortages, favoring large customers. Badger Meter’s FY2024 revenue of $558.8M and hedging/indexed contracts mitigate input-price impacts; LME copper averaged ~$9,500/ton in 2024.
| Metric | Value |
|---|---|
| FY2024 revenue | $558.8M |
| Qualification cycle | 6–12 months |
| Chipset lead times | 20+ weeks |
| LME copper 2024 | $9,500/ton |
What is included in the product
Detailed Word Document
Comprehensive Porter's Five Forces for Badger Meter assessing competitive rivalry from global meter and smart-water players, buyer and supplier bargaining power, threats from digital substitutes and low-cost entrants, and barriers driven by regulation, scale, and proprietary IoT/data capabilities.
Customizable Excel Spreadsheet
A concise one-sheet Porter's Five Forces for Badger Meter that visualizes competitive pressures and lets you tweak force levels to model regulation, new entrants, or technology shifts—ideal for slides, dashboards, and quick strategic decisions.
Customers Bargaining Power
Municipal utility concentration
Large municipal utilities concentrate buying power, issuing sizable, infrequent tenders that give them strong pricing leverage and force competitive RFPs with multi-year frameworks and deep discounts. Procurement increasingly prioritizes lifecycle cost and reliability over lowest upfront price, with long-term service concessions and performance SLAs common. The US has roughly 151,000 public water systems, including about 54,000 community systems, making references and proven performance history decisive in awards.
High switching costs and lock-in
Installed bases of Badger Meter devices and AMI networks, plus analytics platforms, create strong technical and data lock-in by 2024; integrations with billing and GIS systems make rip-and-replace costly and operationally risky, reducing buyer power post-deployment and enabling vendors to sustain margins on upgrades and recurring software services.
Industrial and OEM fragmentation
Commercial/industrial and OEM customers are highly fragmented, diluting individual buyer influence and favoring suppliers with broad distribution. Technical specs and certifications remain decisive; as of 2024 ISO 9001 is the most widely used quality management standard and ANSI/ASME approvals often gate supplier selection. Shorter sales cycles and repeat OEM orders help stabilize pricing. Clear performance differentiation enables value-based selling.
Performance and SLA sensitivity
Customers prioritize meter accuracy (<1% target), multi‑year battery life (industry targets ~10 years) and cybersecurity; 2024 procurement benchmarks demand 99.9% SLA uptime, 3–5 year warranties and integration assurance, with field support mandatory. Vendors that meet KPIs can sustain price premiums; missed SLAs trigger financial penalties (commonly 1–5% of contract value) and reputational risk.
- Accuracy: <1% target
- Battery: ~10‑year target
- SLA: 99.9% uptime
- Warranties/support: 3–5 years; penalties 1–5%
Global public procurement norms
Global public procurement transparency rules and local-content preferences constrain Badger Meter's pricing and require disclosure; public procurement represented roughly 12–20% of GDP globally in 2024. Multi-stage pilots and approvals extend purchase cycles, giving buyers leverage. Currency and funding constraints shift order timing; framework agreements commonly cap annual increases near CPI (~3–5% in 2024).
- PublicProcure: 12–20%GDP
- CycleLeverage: multi-stage pilots
- FundingRisk: FX and budget timing
- PriceCap: CPI-linked 3–5%
Municipal utilities concentrate buying power; compliant vendors command premiums
Large municipal utilities (≈151,000 US public water systems; ≈54,000 community) concentrate buying power and force competitive multi‑year tenders. Installed bases and AMI integrations create strong lock‑in, reducing post‑deployment buyer leverage. Procurement benchmarks (accuracy <1%, battery ≈10y, SLA 99.9%) let compliant vendors command premiums.
| Metric | 2024 |
|---|---|
| US public water systems | 151,000 |
| Community systems | 54,000 |
| Accuracy target | <1% |
| Battery target | ≈10 years |
| SLA | 99.9% |
| Public procurement | 12–20% GDP |
Preview the Actual Deliverable
Badger Meter Porter's Five Forces Analysis
This preview shows the exact Badger Meter Porter’s Five Forces analysis you'll receive immediately after purchase—no placeholders or samples. The document is fully formatted, professionally written, and ready for use upon download. You're viewing the final deliverable; completing your purchase grants instant access to this identical file.











