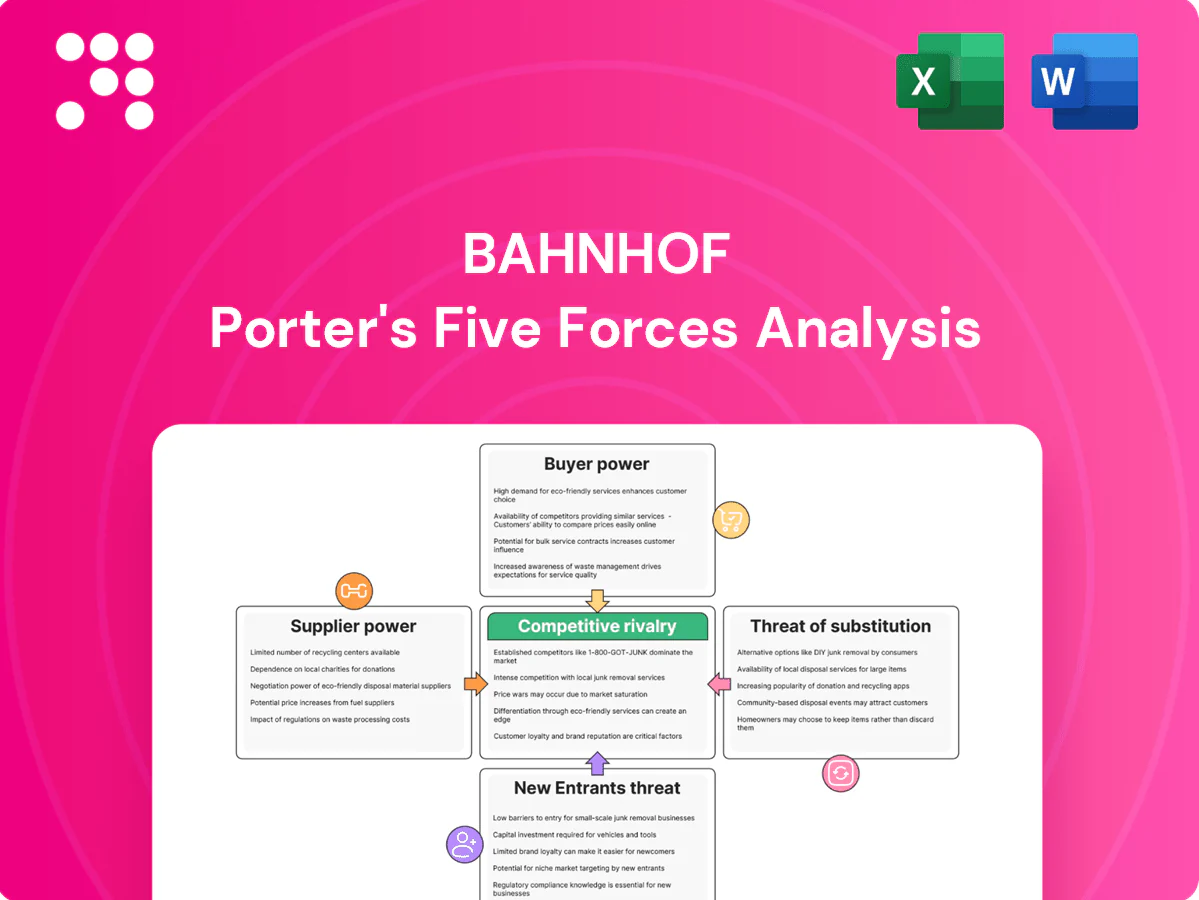
Bahnhof Porter's Five Forces Analysis

Go Beyond the Preview—Access the Full Strategic Report
Bahnhof’s Porter's Five Forces snapshot highlights supplier leverage in network infrastructure, moderate buyer power from corporate clients, and rising threat from regulated substitutes and new entrants in niche segments. This preview scratches the surface—unlock the full report for force-by-force ratings, visuals, and actionable strategy recommendations tailored to Bahnhof.
Suppliers Bargaining Power

Concentrated network equipment vendors
Core routers, switches and optical gear are dominated by a few OEMs (Cisco, Huawei, Nokia, Juniper/Ciena) that held roughly 70–80% of core market share in 2024, boosting supplier leverage on pricing and lead times (average lead times ~12–18 weeks in 2023–24). Proprietary software and support contracts (often 10–20% of hardware cost annually) raise switching costs, while multi‑vendor strategies, open standards and volume/term commitments (securing ~5–15% discounts and priority service) can mitigate lock‑in.
Fiber and wholesale transit dependence
Bahnhof runs its own backbone but remains reliant on dark-fiber leases and IP transit/peering for reach, giving local fiber owners and key route holders leverage over pricing. Participation in aggressive peering and IX platforms materially reduces transit spend and supplier influence. Long-term IRUs lock in capacity and stabilize unit costs but demand significant upfront capital commitments.

Data center real estate and power
Colocation and cloud demand top-tier sites and abundant electricity, making landlords and utilities critical suppliers; data centers consume roughly 1% of global electricity, concentrating supplier leverage. Sweden's electricity mix is dominated by low‑carbon sources (hydro, nuclear, wind) and renewables exceed 50% of generation, easing but not eliminating price and grid capacity risks. Renewable sourcing, on‑site efficiency and corporate PPAs reduce exposure while multi-site strategies and ownership materially curb landlord power.

Software, licensing, and security stacks
Network OS, orchestration, and security tools are highly sticky because deep integration and compliance requirements increase switching costs; Gartner projects worldwide public cloud services spending at $597 billion in 2024, underscoring platform lock-in. Subscription models shift costs to opex and raise cumulative spend, while 2024 Red Hat data shows ~95% enterprise open-source adoption, enabling in-house stacks that reduce supplier dependence. Vendor diversification and exit clauses remain essential defenses against price hikes.
- Stickiness: integration + compliance = higher switching costs
- Cloud spend: Gartner 2024 $597B highlights lock-in
- Open-source: ~95% enterprise use (Red Hat 2024) lowers dependency
- Mitigation: vendor diversification, contractual exit clauses
Domain registries and upstream services
Domain registration relies on roughly 1,200 accredited registrars and ~360 million global domain names (end-2024), so regulated registry fee structures (eg, fixed registry-registrar pricing) cap extreme supplier leverage; accreditation and compliance create switching friction, while volume discounts and bundling offer Bahnhof negotiation room; reliability needs keep preferred upstream partners despite alternatives.
- regulated fees limit supplier power
- ~1,200 registrars → accreditation friction
- ~360M domains → scale for volume pricing
- operational reliability sustains preferred partners
Supply squeeze: OEMs control 70–80%, 12–18w lead times, cloud spend $597B
Supplier power is moderate‑high: core-network OEMs held ~70–80% share in 2024 with 12–18 week lead times, raising price/lead-time leverage. Transit, fiber owners and landlords exert local pricing power; peering, IRUs and multi-site ownership reduce exposure. Cloud/software stickiness (Gartner 2024 $597B) and ~95% enterprise OSS use shape switching costs.
| Item | 2023–24 metric |
|---|---|
| Core OEM share | 70–80% |
| Lead times | 12–18 weeks |
| Cloud spend | $597B (2024) |
| Domains | ~360M (end‑2024) |
What is included in the product
 Detailed Word Document
Comprehensive Porter's Five Forces analysis of Bahnhof that identifies competitive intensity, buyer and supplier leverage, threat of substitutes and new entrants, and strategic barriers protecting incumbency—highlighting disruptive threats, pricing pressure, and actionable strategic levers to bolster Bahnhof’s market position.

 Customizable Excel Spreadsheet
A concise one-sheet Porter's Five Forces analysis for Bahnhof that clarifies competitive pressures, prioritizes key pain points and suggests targeted mitigations—perfect for rapid decisions and slide-ready summaries.
Customers Bargaining Power

Choice-rich Swedish broadband market
Open-access city networks let customers switch providers easily; with fiber reaching ~85% of Swedish households (PTS 2024), buyer power is high. Comparable speeds and SLAs across providers intensify price sensitivity for households. Transparent comparison sites amplify switch propensity, while differentiation on privacy and performance can soften discount pressure.
Enterprise clients negotiate hard
Enterprise clients run formal RFPs and push for bespoke SLAs, driving tougher price and term negotiations; multiyear contracts (commonly 2–5 years) give buyers leverage while creating switching costs. Demonstrable security, compliance and >99.95% uptime enable value-based pricing, and cross-selling colocation plus cloud increases stickiness and lowers churn.

Low switching costs in open fiber
Where service activation is virtual, churn barriers are minimal, amplifying buyer bargaining power; open-fiber markets saw annual churn of about 12–20% in 2024. Short contract terms and aggressive promotional offers encourage hopping, while loyalty programs and bundled TV/voice/IoT can lower churn. Superior customer support and Bahnhof’s strong privacy posture materially reduce propensity to switch.

Price transparency and benchmarking
Public tariffs and frequent promotions let buyers benchmark aggressively; in 2024 customers routinely compare Bahnhof offers against national ISPs, using social reviews and independent speed tests to set expectations. Performance SLAs and published uptime shift negotiations from price toward quality, while clear, no-surprise billing builds trust and reduces friction.
- Price benchmarking via public tariffs
- Social reviews & speed tests drive expectations
- SLAs/uptime emphasize quality over price
- Transparent billing lowers negotiation resistance
Privacy-sensitive segments value premium
Bahnhof’s strong privacy stance attracts privacy-sensitive customers who accept premiums for data protection, weakening pure price-based bargaining. Independent audits and high-profile legal advocacy bolster perceived value, raising switching costs. Bundling privacy with security features increases willingness to pay and reduces customer leverage.
- Privacy premium reduces price pressure
- Audits/legal wins = higher perceived value
- Security+privacy bundles raise WTP
Open fiber (reach ~85%) raises buyer power; churn fuels price sensitivity
Open-access fiber (~85% household reach, PTS 2024) makes switching easy, keeping buyer power high. Enterprises use RFPs and 2–5 year contracts to extract tougher terms, though >99.95% SLAs and security raise willingness to pay. Low activation friction and 12–20% annual churn (2024) amplify price sensitivity, while privacy premiums reduce pure price bargaining.
| Metric | 2024 |
|---|---|
| Fiber reach | ~85% (PTS) |
| Annual churn | 12–20% |
| Contract length | 2–5 yrs |
| Typical SLA | >99.95% |
Same Document Delivered
Bahnhof Porter's Five Forces Analysis
This preview shows the exact Bahnhof Porter's Five Forces Analysis you'll receive after purchase—no placeholders or mockups. It contains the full, professionally formatted assessment of competitive rivalry, supplier and buyer power, threat of entry and substitutes, ready for immediate download and use. Your deliverable is precisely this document.

Go Beyond the Preview—Access the Full Strategic Report
Bahnhof’s Porter's Five Forces snapshot highlights supplier leverage in network infrastructure, moderate buyer power from corporate clients, and rising threat from regulated substitutes and new entrants in niche segments. This preview scratches the surface—unlock the full report for force-by-force ratings, visuals, and actionable strategy recommendations tailored to Bahnhof.
Suppliers Bargaining Power
Concentrated network equipment vendors
Core routers, switches and optical gear are dominated by a few OEMs (Cisco, Huawei, Nokia, Juniper/Ciena) that held roughly 70–80% of core market share in 2024, boosting supplier leverage on pricing and lead times (average lead times ~12–18 weeks in 2023–24). Proprietary software and support contracts (often 10–20% of hardware cost annually) raise switching costs, while multi‑vendor strategies, open standards and volume/term commitments (securing ~5–15% discounts and priority service) can mitigate lock‑in.
Fiber and wholesale transit dependence
Bahnhof runs its own backbone but remains reliant on dark-fiber leases and IP transit/peering for reach, giving local fiber owners and key route holders leverage over pricing. Participation in aggressive peering and IX platforms materially reduces transit spend and supplier influence. Long-term IRUs lock in capacity and stabilize unit costs but demand significant upfront capital commitments.
Data center real estate and power
Colocation and cloud demand top-tier sites and abundant electricity, making landlords and utilities critical suppliers; data centers consume roughly 1% of global electricity, concentrating supplier leverage. Sweden's electricity mix is dominated by low‑carbon sources (hydro, nuclear, wind) and renewables exceed 50% of generation, easing but not eliminating price and grid capacity risks. Renewable sourcing, on‑site efficiency and corporate PPAs reduce exposure while multi-site strategies and ownership materially curb landlord power.
Software, licensing, and security stacks
Network OS, orchestration, and security tools are highly sticky because deep integration and compliance requirements increase switching costs; Gartner projects worldwide public cloud services spending at $597 billion in 2024, underscoring platform lock-in. Subscription models shift costs to opex and raise cumulative spend, while 2024 Red Hat data shows ~95% enterprise open-source adoption, enabling in-house stacks that reduce supplier dependence. Vendor diversification and exit clauses remain essential defenses against price hikes.
- Stickiness: integration + compliance = higher switching costs
- Cloud spend: Gartner 2024 $597B highlights lock-in
- Open-source: ~95% enterprise use (Red Hat 2024) lowers dependency
- Mitigation: vendor diversification, contractual exit clauses
Domain registries and upstream services
Domain registration relies on roughly 1,200 accredited registrars and ~360 million global domain names (end-2024), so regulated registry fee structures (eg, fixed registry-registrar pricing) cap extreme supplier leverage; accreditation and compliance create switching friction, while volume discounts and bundling offer Bahnhof negotiation room; reliability needs keep preferred upstream partners despite alternatives.
- regulated fees limit supplier power
- ~1,200 registrars → accreditation friction
- ~360M domains → scale for volume pricing
- operational reliability sustains preferred partners
Supply squeeze: OEMs control 70–80%, 12–18w lead times, cloud spend $597B
Supplier power is moderate‑high: core-network OEMs held ~70–80% share in 2024 with 12–18 week lead times, raising price/lead-time leverage. Transit, fiber owners and landlords exert local pricing power; peering, IRUs and multi-site ownership reduce exposure. Cloud/software stickiness (Gartner 2024 $597B) and ~95% enterprise OSS use shape switching costs.
| Item | 2023–24 metric |
|---|---|
| Core OEM share | 70–80% |
| Lead times | 12–18 weeks |
| Cloud spend | $597B (2024) |
| Domains | ~360M (end‑2024) |
What is included in the product
Detailed Word Document
Comprehensive Porter's Five Forces analysis of Bahnhof that identifies competitive intensity, buyer and supplier leverage, threat of substitutes and new entrants, and strategic barriers protecting incumbency—highlighting disruptive threats, pricing pressure, and actionable strategic levers to bolster Bahnhof’s market position.
Customizable Excel Spreadsheet
A concise one-sheet Porter's Five Forces analysis for Bahnhof that clarifies competitive pressures, prioritizes key pain points and suggests targeted mitigations—perfect for rapid decisions and slide-ready summaries.
Customers Bargaining Power
Choice-rich Swedish broadband market
Open-access city networks let customers switch providers easily; with fiber reaching ~85% of Swedish households (PTS 2024), buyer power is high. Comparable speeds and SLAs across providers intensify price sensitivity for households. Transparent comparison sites amplify switch propensity, while differentiation on privacy and performance can soften discount pressure.
Enterprise clients negotiate hard
Enterprise clients run formal RFPs and push for bespoke SLAs, driving tougher price and term negotiations; multiyear contracts (commonly 2–5 years) give buyers leverage while creating switching costs. Demonstrable security, compliance and >99.95% uptime enable value-based pricing, and cross-selling colocation plus cloud increases stickiness and lowers churn.
Low switching costs in open fiber
Where service activation is virtual, churn barriers are minimal, amplifying buyer bargaining power; open-fiber markets saw annual churn of about 12–20% in 2024. Short contract terms and aggressive promotional offers encourage hopping, while loyalty programs and bundled TV/voice/IoT can lower churn. Superior customer support and Bahnhof’s strong privacy posture materially reduce propensity to switch.
Price transparency and benchmarking
Public tariffs and frequent promotions let buyers benchmark aggressively; in 2024 customers routinely compare Bahnhof offers against national ISPs, using social reviews and independent speed tests to set expectations. Performance SLAs and published uptime shift negotiations from price toward quality, while clear, no-surprise billing builds trust and reduces friction.
- Price benchmarking via public tariffs
- Social reviews & speed tests drive expectations
- SLAs/uptime emphasize quality over price
- Transparent billing lowers negotiation resistance
Privacy-sensitive segments value premium
Bahnhof’s strong privacy stance attracts privacy-sensitive customers who accept premiums for data protection, weakening pure price-based bargaining. Independent audits and high-profile legal advocacy bolster perceived value, raising switching costs. Bundling privacy with security features increases willingness to pay and reduces customer leverage.
- Privacy premium reduces price pressure
- Audits/legal wins = higher perceived value
- Security+privacy bundles raise WTP
Open fiber (reach ~85%) raises buyer power; churn fuels price sensitivity
Open-access fiber (~85% household reach, PTS 2024) makes switching easy, keeping buyer power high. Enterprises use RFPs and 2–5 year contracts to extract tougher terms, though >99.95% SLAs and security raise willingness to pay. Low activation friction and 12–20% annual churn (2024) amplify price sensitivity, while privacy premiums reduce pure price bargaining.
| Metric | 2024 |
|---|---|
| Fiber reach | ~85% (PTS) |
| Annual churn | 12–20% |
| Contract length | 2–5 yrs |
| Typical SLA | >99.95% |
Same Document Delivered
Bahnhof Porter's Five Forces Analysis
This preview shows the exact Bahnhof Porter's Five Forces Analysis you'll receive after purchase—no placeholders or mockups. It contains the full, professionally formatted assessment of competitive rivalry, supplier and buyer power, threat of entry and substitutes, ready for immediate download and use. Your deliverable is precisely this document.
Description
Go Beyond the Preview—Access the Full Strategic Report
Bahnhof’s Porter's Five Forces snapshot highlights supplier leverage in network infrastructure, moderate buyer power from corporate clients, and rising threat from regulated substitutes and new entrants in niche segments. This preview scratches the surface—unlock the full report for force-by-force ratings, visuals, and actionable strategy recommendations tailored to Bahnhof.
Suppliers Bargaining Power
Concentrated network equipment vendors
Core routers, switches and optical gear are dominated by a few OEMs (Cisco, Huawei, Nokia, Juniper/Ciena) that held roughly 70–80% of core market share in 2024, boosting supplier leverage on pricing and lead times (average lead times ~12–18 weeks in 2023–24). Proprietary software and support contracts (often 10–20% of hardware cost annually) raise switching costs, while multi‑vendor strategies, open standards and volume/term commitments (securing ~5–15% discounts and priority service) can mitigate lock‑in.
Fiber and wholesale transit dependence
Bahnhof runs its own backbone but remains reliant on dark-fiber leases and IP transit/peering for reach, giving local fiber owners and key route holders leverage over pricing. Participation in aggressive peering and IX platforms materially reduces transit spend and supplier influence. Long-term IRUs lock in capacity and stabilize unit costs but demand significant upfront capital commitments.
Data center real estate and power
Colocation and cloud demand top-tier sites and abundant electricity, making landlords and utilities critical suppliers; data centers consume roughly 1% of global electricity, concentrating supplier leverage. Sweden's electricity mix is dominated by low‑carbon sources (hydro, nuclear, wind) and renewables exceed 50% of generation, easing but not eliminating price and grid capacity risks. Renewable sourcing, on‑site efficiency and corporate PPAs reduce exposure while multi-site strategies and ownership materially curb landlord power.
Software, licensing, and security stacks
Network OS, orchestration, and security tools are highly sticky because deep integration and compliance requirements increase switching costs; Gartner projects worldwide public cloud services spending at $597 billion in 2024, underscoring platform lock-in. Subscription models shift costs to opex and raise cumulative spend, while 2024 Red Hat data shows ~95% enterprise open-source adoption, enabling in-house stacks that reduce supplier dependence. Vendor diversification and exit clauses remain essential defenses against price hikes.
- Stickiness: integration + compliance = higher switching costs
- Cloud spend: Gartner 2024 $597B highlights lock-in
- Open-source: ~95% enterprise use (Red Hat 2024) lowers dependency
- Mitigation: vendor diversification, contractual exit clauses
Domain registries and upstream services
Domain registration relies on roughly 1,200 accredited registrars and ~360 million global domain names (end-2024), so regulated registry fee structures (eg, fixed registry-registrar pricing) cap extreme supplier leverage; accreditation and compliance create switching friction, while volume discounts and bundling offer Bahnhof negotiation room; reliability needs keep preferred upstream partners despite alternatives.
- regulated fees limit supplier power
- ~1,200 registrars → accreditation friction
- ~360M domains → scale for volume pricing
- operational reliability sustains preferred partners
Supply squeeze: OEMs control 70–80%, 12–18w lead times, cloud spend $597B
Supplier power is moderate‑high: core-network OEMs held ~70–80% share in 2024 with 12–18 week lead times, raising price/lead-time leverage. Transit, fiber owners and landlords exert local pricing power; peering, IRUs and multi-site ownership reduce exposure. Cloud/software stickiness (Gartner 2024 $597B) and ~95% enterprise OSS use shape switching costs.
| Item | 2023–24 metric |
|---|---|
| Core OEM share | 70–80% |
| Lead times | 12–18 weeks |
| Cloud spend | $597B (2024) |
| Domains | ~360M (end‑2024) |
What is included in the product
Detailed Word Document
Comprehensive Porter's Five Forces analysis of Bahnhof that identifies competitive intensity, buyer and supplier leverage, threat of substitutes and new entrants, and strategic barriers protecting incumbency—highlighting disruptive threats, pricing pressure, and actionable strategic levers to bolster Bahnhof’s market position.
Customizable Excel Spreadsheet
A concise one-sheet Porter's Five Forces analysis for Bahnhof that clarifies competitive pressures, prioritizes key pain points and suggests targeted mitigations—perfect for rapid decisions and slide-ready summaries.
Customers Bargaining Power
Choice-rich Swedish broadband market
Open-access city networks let customers switch providers easily; with fiber reaching ~85% of Swedish households (PTS 2024), buyer power is high. Comparable speeds and SLAs across providers intensify price sensitivity for households. Transparent comparison sites amplify switch propensity, while differentiation on privacy and performance can soften discount pressure.
Enterprise clients negotiate hard
Enterprise clients run formal RFPs and push for bespoke SLAs, driving tougher price and term negotiations; multiyear contracts (commonly 2–5 years) give buyers leverage while creating switching costs. Demonstrable security, compliance and >99.95% uptime enable value-based pricing, and cross-selling colocation plus cloud increases stickiness and lowers churn.
Low switching costs in open fiber
Where service activation is virtual, churn barriers are minimal, amplifying buyer bargaining power; open-fiber markets saw annual churn of about 12–20% in 2024. Short contract terms and aggressive promotional offers encourage hopping, while loyalty programs and bundled TV/voice/IoT can lower churn. Superior customer support and Bahnhof’s strong privacy posture materially reduce propensity to switch.
Price transparency and benchmarking
Public tariffs and frequent promotions let buyers benchmark aggressively; in 2024 customers routinely compare Bahnhof offers against national ISPs, using social reviews and independent speed tests to set expectations. Performance SLAs and published uptime shift negotiations from price toward quality, while clear, no-surprise billing builds trust and reduces friction.
- Price benchmarking via public tariffs
- Social reviews & speed tests drive expectations
- SLAs/uptime emphasize quality over price
- Transparent billing lowers negotiation resistance
Privacy-sensitive segments value premium
Bahnhof’s strong privacy stance attracts privacy-sensitive customers who accept premiums for data protection, weakening pure price-based bargaining. Independent audits and high-profile legal advocacy bolster perceived value, raising switching costs. Bundling privacy with security features increases willingness to pay and reduces customer leverage.
- Privacy premium reduces price pressure
- Audits/legal wins = higher perceived value
- Security+privacy bundles raise WTP
Open fiber (reach ~85%) raises buyer power; churn fuels price sensitivity
Open-access fiber (~85% household reach, PTS 2024) makes switching easy, keeping buyer power high. Enterprises use RFPs and 2–5 year contracts to extract tougher terms, though >99.95% SLAs and security raise willingness to pay. Low activation friction and 12–20% annual churn (2024) amplify price sensitivity, while privacy premiums reduce pure price bargaining.
| Metric | 2024 |
|---|---|
| Fiber reach | ~85% (PTS) |
| Annual churn | 12–20% |
| Contract length | 2–5 yrs |
| Typical SLA | >99.95% |
Same Document Delivered
Bahnhof Porter's Five Forces Analysis
This preview shows the exact Bahnhof Porter's Five Forces Analysis you'll receive after purchase—no placeholders or mockups. It contains the full, professionally formatted assessment of competitive rivalry, supplier and buyer power, threat of entry and substitutes, ready for immediate download and use. Your deliverable is precisely this document.











