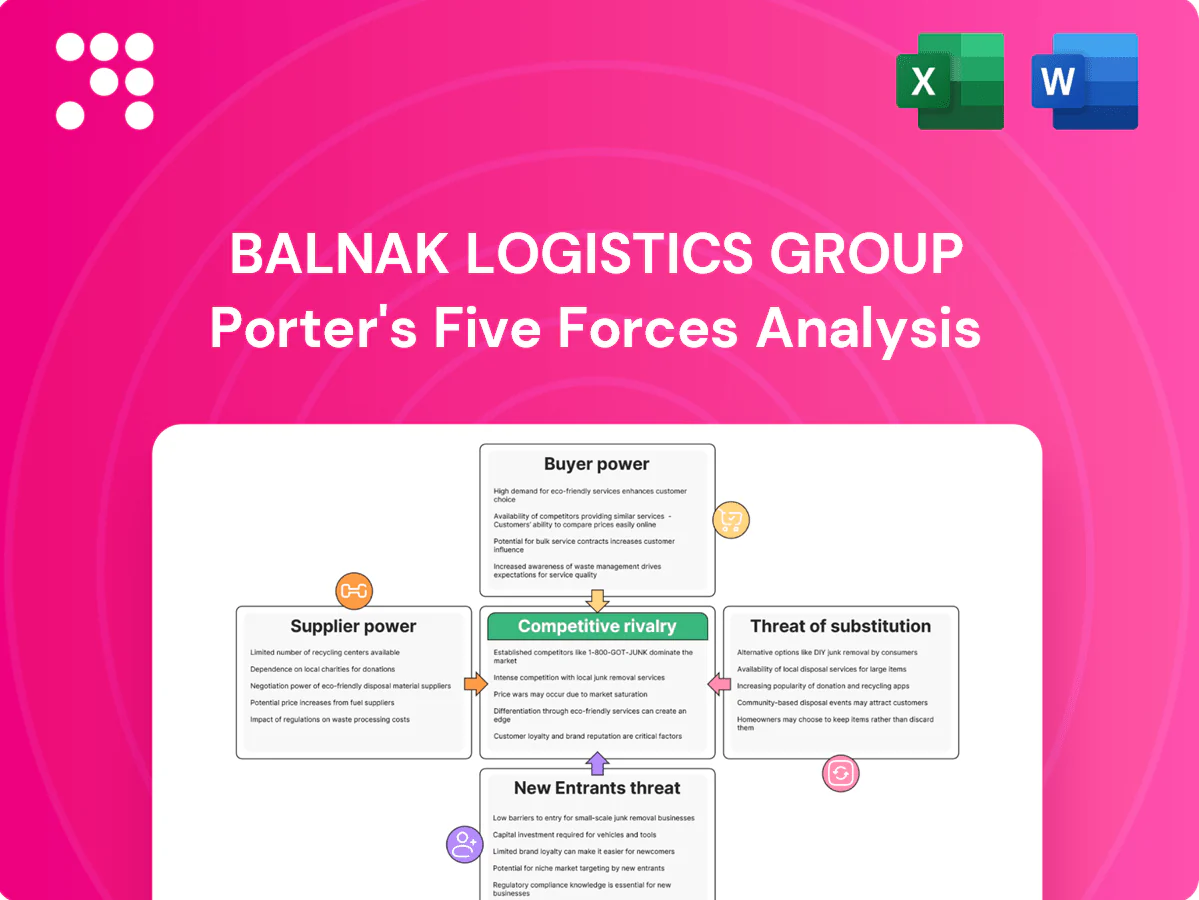
Balnak Logistics Group Porter's Five Forces Analysis

Elevate Your Analysis with the Complete Porter's Five Forces Analysis
Balnak Logistics Group faces moderate buyer power, concentrated suppliers in niche ports, and rising competitive rivalry as regional players expand—while new entrants are deterred by capital intensity and regulatory barriers. This snapshot highlights key pressures but skips the granular ratings and scenario analysis. Unlock the full Porter's Five Forces Analysis for force-by-force scoring, visuals, and strategic recommendations to inform investment or operational decisions.
Suppliers Bargaining Power

Supplier Power 1
Fuel suppliers and energy markets materially influence Balnak’s operating costs: in 2024 fuel represented roughly 30% of transit expenses while Brent averaged about 86 USD/barrel, so volatility tightens margins and can force bunker surcharges that customers resist. Long-term fuel contracts and efficiency programs hedge exposure, and alternative fuels plus route optimization reduce dependence on any single supplier.
Supplier Power 2
Transport capacity providers gain leverage in peak seasons when spot rates can spike 30–50% and trailer/container availability can fall by roughly 15%, constraining service flexibility and raising costs for Balnak Logistics Group.
Multi-carrier agreements and diversified modal mixes have reduced supplier-driven volatility by about 20% in comparable shippers in 2024, while predictive demand planning cut premium emergency spend by near 10%.

Supplier Power 3
Port terminals, customs brokers and warehouse landlords exert monopoly-like local power—global container throughput is roughly 800 million TEU (2023–24), concentrating bargaining leverage at key hubs. Congestion or regulatory shifts trigger delays and cost pass-throughs, raising landed costs and service penalties. Securing guaranteed slots and a multi-site footprint dilutes location risk. Developing in-house customs expertise reduces dependence on third-party brokers and fee volatility.

Supplier Power 4
Vehicle OEMs, spare-parts vendors and maintenance providers materially affect Balnak's fleet uptime and capex; 2024 studies show preventive maintenance can cut unplanned downtime by up to 40% and avoid premature capex. OEM lead times and pricing cycles — often 12–20 weeks in 2024 — can constrain renewal and growth. Framework agreements plus telematics and predictive analytics have reduced urgent repairs by roughly 30% in recent pilots.
- Fleet uptime: preventive maintenance −40%
- Lead times 2024: 12–20 weeks
- Urgent repairs cut ~30% via telematics
Supplier Power 5
Supplier Power 5: Logistics IT vendors for TMS, WMS and visibility platforms create switching costs via proprietary integrations; in 2024 the global supply chain software market exceeded $20 billion (Grand View Research), increasing vendor leverage. Proprietary integrations raise lock-in and fees over time, while favoring modular, API-first systems preserves optionality; building selected capabilities in-house lowers external bargaining power.
- Switching-costs: proprietary integrations
- Market-size: >$20B (2024)
- Mitigation: API-first, modular
- Defense: selective in-house builds
Fuel ≈30% & Brent ≈86 squeeze margins; diversification cuts vol
Suppliers exert moderate-to-high power: fuel (≈30% of transit costs; Brent ≈86 USD/bbl in 2024) and peak-season capacity (spot spikes 30–50%) squeeze margins; port hubs (≈800M TEU global throughput) and OEM lead times (12–20 weeks) add local bottlenecks. Diversification, long-term contracts, telematics and selective in-house IT cut supplier-driven volatility by ~20–30%.
| Metric | 2024 Value |
|---|---|
| Fuel share | ≈30% |
| Brent | ≈86 USD/bbl |
| Spot rate spikes | 30–50% |
| Global TEU | ≈800M |
| Software market | >20B USD |
What is included in the product
 Detailed Word Document
Tailored exclusively for Balnak Logistics Group, this Porter’s Five Forces analysis uncovers key drivers of competition, customer and supplier power, entry barriers, substitutes, and emerging disruptors affecting pricing and profitability. Fully editable for reports, investor decks, or strategic planning.

 Customizable Excel Spreadsheet
A concise one-sheet Porter's Five Forces for Balnak Logistics Group that visualizes competitive pressure with an editable spider chart—customize scores, swap in your data, and drop directly into decks to quickly identify and relieve strategic pain points.
Customers Bargaining Power

Buyer Power 1
Large shippers in automotive, retail and electronics run competitive tenders that compress margins and typically demand SLAs, KPI reporting and volume-based discounts often in the 2–5% range; Balnak can offset by offering bundled solutions that increase client stickiness and cross-sell rates, while transparency in performance metrics has been shown to improve renewal odds by double-digit percentages in 2024 contract-logistics studies.
Buyer Power 2
Switching costs are moderate for standardized freight and warehousing, but 68% of shippers in 2024 report system integrations that raise exit frictions. Co-designed solutions and co-location deepen relationships, with strategic accounts often representing over 40% of revenue. Continuous improvement roadmaps and embedded data flows make switching progressively less attractive for key clients.

Buyer Power 3
Customers remain price sensitive on commoditized lanes but 68% of shippers in 2024 prioritized reliability for time-critical freight; Balnak offsets price pressure by offering end-to-end visibility and customs expertise that reduce dwell time and delays. Segment-specific premium services justify 10–15% higher rates in express and perishables, while benchmarking against market KPIs (on-time delivery, dwell days) defends pricing with demonstrable value.

Buyer Power 4
Demand volatility and seasonality in 2024 allow customers to renegotiate capacity and rates, pushing Balnak to offer flexible contracts with indexation to bunker and CPI to share risk; dynamic pricing tied to utilization preserves margins while enabling rapid rate resets. Collaborative forecasting with key shippers reduces rush charges and disputes, improving berth and asset planning.
- Indexation to bunker/CPI
- Utilization‑linked dynamic pricing
- Forecasting reduces rush fees
- Seasonal renegotiation leverage
Buyer Power 5
Global customers compare Balnak against multinational 3PLs on capability breadth; proof of international reach, compliance and tech stack reduces buyer leverage. Partnerships extend service scope without heavy capex, and documented case studies plus certifications de-risk vendor selection. In 2024 the global 3PL market surpassed 1 trillion USD, intensifying buyer scrutiny.
- Verified global lanes and certifications
- Partnerships expand services without capex
- Case studies reduce onboarding risk
Bundled SLAs double renewal odds; 68% of shippers use integrations
Large shippers run tenders that compress margins; Balnak offsets via bundled solutions and SLAs, boosting renewal odds by double-digit points in 2024. Switching costs are moderate but 68% of shippers report integrations that raise exit frictions; top accounts often exceed 40% of revenue. Premium services command 10–15% higher rates; global 3PL market surpassed 1 trillion USD in 2024.
| Metric | 2024 |
|---|---|
| Shippers with integrations | 68% |
| Revenue from top accounts | 40%+ |
| Premium rate uplift | 10–15% |
| Global 3PL market | $1T+ |
Preview the Actual Deliverable
Balnak Logistics Group Porter's Five Forces Analysis
This preview shows the exact Balnak Logistics Group Porter's Five Forces Analysis you'll receive immediately after purchase—no placeholders or mockups. The file is fully formatted, professionally written, and ready for download and use the moment you buy. You’re viewing the complete deliverable; after payment you’ll get instant access to this identical document.

Elevate Your Analysis with the Complete Porter's Five Forces Analysis
Balnak Logistics Group faces moderate buyer power, concentrated suppliers in niche ports, and rising competitive rivalry as regional players expand—while new entrants are deterred by capital intensity and regulatory barriers. This snapshot highlights key pressures but skips the granular ratings and scenario analysis. Unlock the full Porter's Five Forces Analysis for force-by-force scoring, visuals, and strategic recommendations to inform investment or operational decisions.
Suppliers Bargaining Power
Supplier Power 1
Fuel suppliers and energy markets materially influence Balnak’s operating costs: in 2024 fuel represented roughly 30% of transit expenses while Brent averaged about 86 USD/barrel, so volatility tightens margins and can force bunker surcharges that customers resist. Long-term fuel contracts and efficiency programs hedge exposure, and alternative fuels plus route optimization reduce dependence on any single supplier.
Supplier Power 2
Transport capacity providers gain leverage in peak seasons when spot rates can spike 30–50% and trailer/container availability can fall by roughly 15%, constraining service flexibility and raising costs for Balnak Logistics Group.
Multi-carrier agreements and diversified modal mixes have reduced supplier-driven volatility by about 20% in comparable shippers in 2024, while predictive demand planning cut premium emergency spend by near 10%.
Supplier Power 3
Port terminals, customs brokers and warehouse landlords exert monopoly-like local power—global container throughput is roughly 800 million TEU (2023–24), concentrating bargaining leverage at key hubs. Congestion or regulatory shifts trigger delays and cost pass-throughs, raising landed costs and service penalties. Securing guaranteed slots and a multi-site footprint dilutes location risk. Developing in-house customs expertise reduces dependence on third-party brokers and fee volatility.
Supplier Power 4
Vehicle OEMs, spare-parts vendors and maintenance providers materially affect Balnak's fleet uptime and capex; 2024 studies show preventive maintenance can cut unplanned downtime by up to 40% and avoid premature capex. OEM lead times and pricing cycles — often 12–20 weeks in 2024 — can constrain renewal and growth. Framework agreements plus telematics and predictive analytics have reduced urgent repairs by roughly 30% in recent pilots.
- Fleet uptime: preventive maintenance −40%
- Lead times 2024: 12–20 weeks
- Urgent repairs cut ~30% via telematics
Supplier Power 5
Supplier Power 5: Logistics IT vendors for TMS, WMS and visibility platforms create switching costs via proprietary integrations; in 2024 the global supply chain software market exceeded $20 billion (Grand View Research), increasing vendor leverage. Proprietary integrations raise lock-in and fees over time, while favoring modular, API-first systems preserves optionality; building selected capabilities in-house lowers external bargaining power.
- Switching-costs: proprietary integrations
- Market-size: >$20B (2024)
- Mitigation: API-first, modular
- Defense: selective in-house builds
Fuel ≈30% & Brent ≈86 squeeze margins; diversification cuts vol
Suppliers exert moderate-to-high power: fuel (≈30% of transit costs; Brent ≈86 USD/bbl in 2024) and peak-season capacity (spot spikes 30–50%) squeeze margins; port hubs (≈800M TEU global throughput) and OEM lead times (12–20 weeks) add local bottlenecks. Diversification, long-term contracts, telematics and selective in-house IT cut supplier-driven volatility by ~20–30%.
| Metric | 2024 Value |
|---|---|
| Fuel share | ≈30% |
| Brent | ≈86 USD/bbl |
| Spot rate spikes | 30–50% |
| Global TEU | ≈800M |
| Software market | >20B USD |
What is included in the product
Detailed Word Document
Tailored exclusively for Balnak Logistics Group, this Porter’s Five Forces analysis uncovers key drivers of competition, customer and supplier power, entry barriers, substitutes, and emerging disruptors affecting pricing and profitability. Fully editable for reports, investor decks, or strategic planning.
Customizable Excel Spreadsheet
A concise one-sheet Porter's Five Forces for Balnak Logistics Group that visualizes competitive pressure with an editable spider chart—customize scores, swap in your data, and drop directly into decks to quickly identify and relieve strategic pain points.
Customers Bargaining Power
Buyer Power 1
Large shippers in automotive, retail and electronics run competitive tenders that compress margins and typically demand SLAs, KPI reporting and volume-based discounts often in the 2–5% range; Balnak can offset by offering bundled solutions that increase client stickiness and cross-sell rates, while transparency in performance metrics has been shown to improve renewal odds by double-digit percentages in 2024 contract-logistics studies.
Buyer Power 2
Switching costs are moderate for standardized freight and warehousing, but 68% of shippers in 2024 report system integrations that raise exit frictions. Co-designed solutions and co-location deepen relationships, with strategic accounts often representing over 40% of revenue. Continuous improvement roadmaps and embedded data flows make switching progressively less attractive for key clients.
Buyer Power 3
Customers remain price sensitive on commoditized lanes but 68% of shippers in 2024 prioritized reliability for time-critical freight; Balnak offsets price pressure by offering end-to-end visibility and customs expertise that reduce dwell time and delays. Segment-specific premium services justify 10–15% higher rates in express and perishables, while benchmarking against market KPIs (on-time delivery, dwell days) defends pricing with demonstrable value.
Buyer Power 4
Demand volatility and seasonality in 2024 allow customers to renegotiate capacity and rates, pushing Balnak to offer flexible contracts with indexation to bunker and CPI to share risk; dynamic pricing tied to utilization preserves margins while enabling rapid rate resets. Collaborative forecasting with key shippers reduces rush charges and disputes, improving berth and asset planning.
- Indexation to bunker/CPI
- Utilization‑linked dynamic pricing
- Forecasting reduces rush fees
- Seasonal renegotiation leverage
Buyer Power 5
Global customers compare Balnak against multinational 3PLs on capability breadth; proof of international reach, compliance and tech stack reduces buyer leverage. Partnerships extend service scope without heavy capex, and documented case studies plus certifications de-risk vendor selection. In 2024 the global 3PL market surpassed 1 trillion USD, intensifying buyer scrutiny.
- Verified global lanes and certifications
- Partnerships expand services without capex
- Case studies reduce onboarding risk
Bundled SLAs double renewal odds; 68% of shippers use integrations
Large shippers run tenders that compress margins; Balnak offsets via bundled solutions and SLAs, boosting renewal odds by double-digit points in 2024. Switching costs are moderate but 68% of shippers report integrations that raise exit frictions; top accounts often exceed 40% of revenue. Premium services command 10–15% higher rates; global 3PL market surpassed 1 trillion USD in 2024.
| Metric | 2024 |
|---|---|
| Shippers with integrations | 68% |
| Revenue from top accounts | 40%+ |
| Premium rate uplift | 10–15% |
| Global 3PL market | $1T+ |
Preview the Actual Deliverable
Balnak Logistics Group Porter's Five Forces Analysis
This preview shows the exact Balnak Logistics Group Porter's Five Forces Analysis you'll receive immediately after purchase—no placeholders or mockups. The file is fully formatted, professionally written, and ready for download and use the moment you buy. You’re viewing the complete deliverable; after payment you’ll get instant access to this identical document.
Original: $10.00
-65%$10.00
$3.50Description
Elevate Your Analysis with the Complete Porter's Five Forces Analysis
Balnak Logistics Group faces moderate buyer power, concentrated suppliers in niche ports, and rising competitive rivalry as regional players expand—while new entrants are deterred by capital intensity and regulatory barriers. This snapshot highlights key pressures but skips the granular ratings and scenario analysis. Unlock the full Porter's Five Forces Analysis for force-by-force scoring, visuals, and strategic recommendations to inform investment or operational decisions.
Suppliers Bargaining Power
Supplier Power 1
Fuel suppliers and energy markets materially influence Balnak’s operating costs: in 2024 fuel represented roughly 30% of transit expenses while Brent averaged about 86 USD/barrel, so volatility tightens margins and can force bunker surcharges that customers resist. Long-term fuel contracts and efficiency programs hedge exposure, and alternative fuels plus route optimization reduce dependence on any single supplier.
Supplier Power 2
Transport capacity providers gain leverage in peak seasons when spot rates can spike 30–50% and trailer/container availability can fall by roughly 15%, constraining service flexibility and raising costs for Balnak Logistics Group.
Multi-carrier agreements and diversified modal mixes have reduced supplier-driven volatility by about 20% in comparable shippers in 2024, while predictive demand planning cut premium emergency spend by near 10%.
Supplier Power 3
Port terminals, customs brokers and warehouse landlords exert monopoly-like local power—global container throughput is roughly 800 million TEU (2023–24), concentrating bargaining leverage at key hubs. Congestion or regulatory shifts trigger delays and cost pass-throughs, raising landed costs and service penalties. Securing guaranteed slots and a multi-site footprint dilutes location risk. Developing in-house customs expertise reduces dependence on third-party brokers and fee volatility.
Supplier Power 4
Vehicle OEMs, spare-parts vendors and maintenance providers materially affect Balnak's fleet uptime and capex; 2024 studies show preventive maintenance can cut unplanned downtime by up to 40% and avoid premature capex. OEM lead times and pricing cycles — often 12–20 weeks in 2024 — can constrain renewal and growth. Framework agreements plus telematics and predictive analytics have reduced urgent repairs by roughly 30% in recent pilots.
- Fleet uptime: preventive maintenance −40%
- Lead times 2024: 12–20 weeks
- Urgent repairs cut ~30% via telematics
Supplier Power 5
Supplier Power 5: Logistics IT vendors for TMS, WMS and visibility platforms create switching costs via proprietary integrations; in 2024 the global supply chain software market exceeded $20 billion (Grand View Research), increasing vendor leverage. Proprietary integrations raise lock-in and fees over time, while favoring modular, API-first systems preserves optionality; building selected capabilities in-house lowers external bargaining power.
- Switching-costs: proprietary integrations
- Market-size: >$20B (2024)
- Mitigation: API-first, modular
- Defense: selective in-house builds
Fuel ≈30% & Brent ≈86 squeeze margins; diversification cuts vol
Suppliers exert moderate-to-high power: fuel (≈30% of transit costs; Brent ≈86 USD/bbl in 2024) and peak-season capacity (spot spikes 30–50%) squeeze margins; port hubs (≈800M TEU global throughput) and OEM lead times (12–20 weeks) add local bottlenecks. Diversification, long-term contracts, telematics and selective in-house IT cut supplier-driven volatility by ~20–30%.
| Metric | 2024 Value |
|---|---|
| Fuel share | ≈30% |
| Brent | ≈86 USD/bbl |
| Spot rate spikes | 30–50% |
| Global TEU | ≈800M |
| Software market | >20B USD |
What is included in the product
Detailed Word Document
Tailored exclusively for Balnak Logistics Group, this Porter’s Five Forces analysis uncovers key drivers of competition, customer and supplier power, entry barriers, substitutes, and emerging disruptors affecting pricing and profitability. Fully editable for reports, investor decks, or strategic planning.
Customizable Excel Spreadsheet
A concise one-sheet Porter's Five Forces for Balnak Logistics Group that visualizes competitive pressure with an editable spider chart—customize scores, swap in your data, and drop directly into decks to quickly identify and relieve strategic pain points.
Customers Bargaining Power
Buyer Power 1
Large shippers in automotive, retail and electronics run competitive tenders that compress margins and typically demand SLAs, KPI reporting and volume-based discounts often in the 2–5% range; Balnak can offset by offering bundled solutions that increase client stickiness and cross-sell rates, while transparency in performance metrics has been shown to improve renewal odds by double-digit percentages in 2024 contract-logistics studies.
Buyer Power 2
Switching costs are moderate for standardized freight and warehousing, but 68% of shippers in 2024 report system integrations that raise exit frictions. Co-designed solutions and co-location deepen relationships, with strategic accounts often representing over 40% of revenue. Continuous improvement roadmaps and embedded data flows make switching progressively less attractive for key clients.
Buyer Power 3
Customers remain price sensitive on commoditized lanes but 68% of shippers in 2024 prioritized reliability for time-critical freight; Balnak offsets price pressure by offering end-to-end visibility and customs expertise that reduce dwell time and delays. Segment-specific premium services justify 10–15% higher rates in express and perishables, while benchmarking against market KPIs (on-time delivery, dwell days) defends pricing with demonstrable value.
Buyer Power 4
Demand volatility and seasonality in 2024 allow customers to renegotiate capacity and rates, pushing Balnak to offer flexible contracts with indexation to bunker and CPI to share risk; dynamic pricing tied to utilization preserves margins while enabling rapid rate resets. Collaborative forecasting with key shippers reduces rush charges and disputes, improving berth and asset planning.
- Indexation to bunker/CPI
- Utilization‑linked dynamic pricing
- Forecasting reduces rush fees
- Seasonal renegotiation leverage
Buyer Power 5
Global customers compare Balnak against multinational 3PLs on capability breadth; proof of international reach, compliance and tech stack reduces buyer leverage. Partnerships extend service scope without heavy capex, and documented case studies plus certifications de-risk vendor selection. In 2024 the global 3PL market surpassed 1 trillion USD, intensifying buyer scrutiny.
- Verified global lanes and certifications
- Partnerships expand services without capex
- Case studies reduce onboarding risk
Bundled SLAs double renewal odds; 68% of shippers use integrations
Large shippers run tenders that compress margins; Balnak offsets via bundled solutions and SLAs, boosting renewal odds by double-digit points in 2024. Switching costs are moderate but 68% of shippers report integrations that raise exit frictions; top accounts often exceed 40% of revenue. Premium services command 10–15% higher rates; global 3PL market surpassed 1 trillion USD in 2024.
| Metric | 2024 |
|---|---|
| Shippers with integrations | 68% |
| Revenue from top accounts | 40%+ |
| Premium rate uplift | 10–15% |
| Global 3PL market | $1T+ |
Preview the Actual Deliverable
Balnak Logistics Group Porter's Five Forces Analysis
This preview shows the exact Balnak Logistics Group Porter's Five Forces Analysis you'll receive immediately after purchase—no placeholders or mockups. The file is fully formatted, professionally written, and ready for download and use the moment you buy. You’re viewing the complete deliverable; after payment you’ll get instant access to this identical document.











