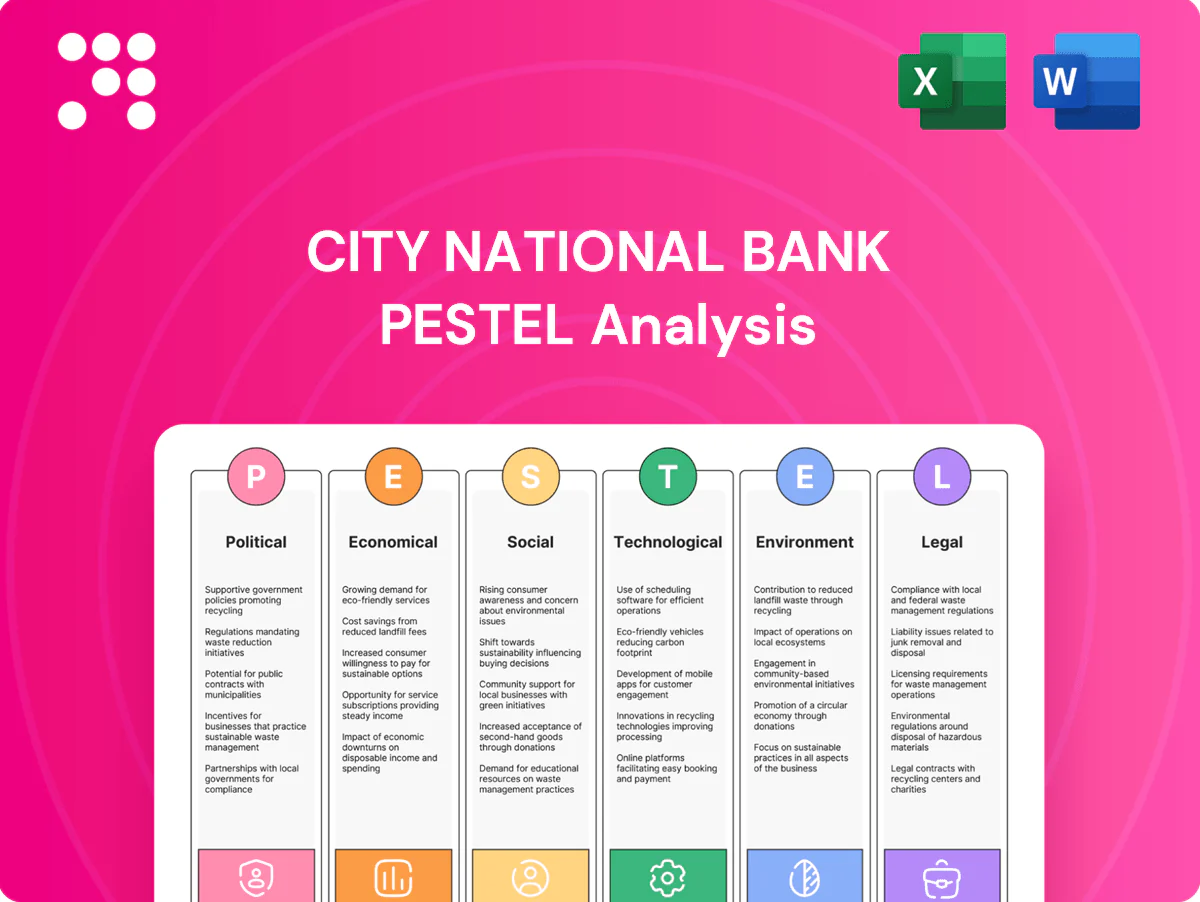
City National Bank PESTLE Analysis

Your Competitive Advantage Starts with This Report
Unlock strategic advantage with our PESTLE Analysis of City National Bank—concise, data-driven and focused on political, economic and regulatory shifts shaping performance. Ideal for investors and strategists seeking market clarity. Purchase the full report for actionable insights and editable charts.
Political factors

Monetary policy influence
Federal policy moves—with the federal funds rate near 5.25–5.50% and 30‑year mortgage rates around 7% in 2024–25—directly steer City National’s loan demand, deposit pricing and net interest margins. Tightening has compressed mortgage and CRE volumes in Southern California and New York, while easing historically triggers refinancing waves. Policy guidance shapes client expectations and balance‑sheet duration strategy, so coordination with liquidity buffers is critical around inflection points.
Federal fiscal priorities
Federal spending patterns—including the $1.2 trillion Bipartisan Infrastructure Law and roughly $6.2 trillion in FY2024 federal outlays—influence activity in Los Angeles, D.C., and New York corridors by driving project pipelines and defense and healthcare contracting. SBA and government‑backed programs expand small‑business lending channels and referral flows. Shifts in tax policy reshape HNW planning and cross‑market wealth movement, while budget uncertainty can delay capital projects and reduce credit demand.

Regional political dynamics
State and city housing, zoning, and public safety policies shape CRE pipelines in LA, NYC and Las Vegas, where 2024 transaction activity remained concentrated in core office and multifamily corridors; incentives in Nashville and Atlanta supported over 60 corporate relocations in 2024, lifting middle‑market banking demand; local tax and fee changes (property tax adjustments of 1–3% in some metros) alter operating costs and client siting; election cycles in 2024 lengthened permitting timelines by as much as 20–30%, delaying deals.

Trade and immigration stance
Trade policy shapes demand from entertainment, tech and professional services concentrated in California, which produces roughly 15% of US GDP; restrictive tariffs or trade wars compress cross‑border revenue for City National Bank clients. Immigration rules affect labor supply for hospitality and services in Las Vegas and Southern California, where leisure and hospitality represent about 30% of local employment. Geopolitical risk drives cross‑border capital flows and FX volatility, altering deposit inflows and wealth management needs.
- Trade impact on coastal client revenues
- Immigration affects labor for Vegas/SoCal hospitality
- Geopolitics shifts deposit/FX and wealth management demand
Public–private funding climate
Partnerships for affordable housing and community development hinge on political will and grant continuity; banks can tap New Markets Tax Credits (NMTC, recent annual allocations ~5 billion) and municipal programs to originate mission‑aligned loans, but changes in program funding erode pipeline visibility and forecastability.
Stakeholder engagement with city councils and local housing authorities can unlock zoning approvals and municipal subsidies.
- NMTC ~5 billion annual allocation
- Program stability = pipeline visibility
- City council engagement unlocks local subsidies
Fed 5.25–5.50% compresses CRE/mortgages; US outlays back projects
Federal policy (fed funds 5.25–5.50%, 30‑yr mortgage ~7%) drives loan demand, deposit pricing and NIMs; tightening compressed CRE and mortgage activity. Federal outlays (~$6.2T FY2024) and NMTC (~$5B) underpin project pipelines and community lending. State/city zoning, taxes (property adj. 1–3%) and election delays (permits +20–30%) reshape CRE timing; trade, immigration and geopolitics alter client revenues and FX flows.
| Metric | Value |
|---|---|
| Fed funds | 5.25–5.50% |
| 30‑yr mortgage | ~7% |
| FY2024 outlays | $6.2T |
| NMTC | ~$5B |
What is included in the product
 Detailed Word Document
Explores how Political, Economic, Social, Technological, Environmental and Legal forces uniquely affect City National Bank, with data-backed trends, forward-looking insights and actionable examples to help executives, consultants and investors identify risks, opportunities and strategy-ready scenarios.

 Customizable Excel Spreadsheet
A concise, visually segmented City National Bank PESTLE summary that distills regulatory, economic, and technological risks into a single-slide-ready format, helping teams quickly align on external threats and strategic opportunities during planning or client briefings.
Economic factors

Interest rate cycle
Elevated policy rates (Fed funds 5.25–5.50% mid‑2025) boost loan yields and can widen NIM but raise deposit betas and margin volatility; high rates pressure CRE and leveraged finance while supporting deposit growth as clients chase yield. Lower rates historically revive mortgage/refi volumes (30‑yr avg ~7% in 2024–25). Balance‑sheet hedging and asset duration management are critical levers for City National.
Regional growth dispersion
Sunbelt metros like Nashville and Atlanta are outpacing many coastal peers, diversifying loan demand as Atlanta added about 100,000 residents 2020–2023 and Nashville showed similar gains; this shifts mortgage and commercial lending mix. Tourism cycles—Las Vegas hosted ~42.3M visitors in 2023 and LAX handled ~66M passengers—drive volatile deposits and card spend. Sector mix alters credit costs and cross‑sell potential; portfolio allocation should mirror regional momentum.

Credit cycle and CRE exposure
Office vacancy in NYC (about 15.6% Q4 2024) and LA (about 21.8% Q4 2024) elevates delinquency and impairment risk, with bank CRE delinquency at roughly 1.4% (FDIC Q4 2024). Strong underwriting and collateral discipline limit losses but reduce origination volumes. Construction lending hinges on absorption, rising cap rates (office cap rates near 6–7% in 2024) and lender competition. Active workout capabilities help preserve collateral value through the cycle.

Labor market and wage trends
Tight U.S. labor markets (unemployment 3.7% June 2025, BLS) lift operating costs and drive small‑business credit demand; average hourly earnings up ~4.0% YoY (May 2025, BLS) which supports deposits and spending but compresses efficiency ratios. Remote/hybrid work (~30% of workforce, McKinsey 2024) reduces branch traffic and office demand. Recruiting specialized wealth and tech talent remains highly competitive.
- Unemployment: 3.7% (BLS Jun 2025)
- Wage growth: AHE ~4.0% YoY (May 2025)
- Remote/hybrid: ~30% (McKinsey 2024)
- Talent competition: elevated in wealth & tech
Capital markets conditions
Capital markets conditions drive City National Bank's flows: IPO and M&A cycles in New York and Los Angeles materially boost treasury, payments, and wealth inflows, while volatility (VIX avg 16.3 in 2024) lifts trading-related client activity but often delays financing deals; middle‑market loan pricing tracks liquidity premiums and spreads, and stable markets enable fee income from syndications and advisory.
- VIX avg 16.3 (2024)
- Middle‑market spreads set loan pricing
- Stable markets → syndication/advisory fees
Fed 5.25–5.50% compresses CRE/mortgages; US outlays back projects
Higher policy rates (Fed funds 5.25–5.50% mid‑2025) lift loan yields but raise deposit betas and CRE stress; unemployment 3.7% (Jun 2025) and AHE +4.0% (May 2025) support deposits but raise costs. Office vacancy NYC 15.6% / LA 21.8% (Q4 2024) increases CRE impairments; VIX avg 16.3 (2024) moderates fee activity.
| Metric | Value |
|---|---|
| Fed funds | 5.25–5.50% |
| Unemployment | 3.7% |
| AHE | +4.0% YoY |
| Office vacancy (NYC/LA) | 15.6% / 21.8% |
| VIX avg | 16.3 |
| CRE delinquency | ~1.4% |
Same Document Delivered
City National Bank PESTLE Analysis
The preview shown here is the exact City National Bank PESTLE Analysis you’ll receive after purchase—fully formatted and ready to use. The layout, content, and structure visible are identical to the downloadable file. No placeholders or surprises; this is the final, professionally structured document.

Your Competitive Advantage Starts with This Report
Unlock strategic advantage with our PESTLE Analysis of City National Bank—concise, data-driven and focused on political, economic and regulatory shifts shaping performance. Ideal for investors and strategists seeking market clarity. Purchase the full report for actionable insights and editable charts.
Political factors
Monetary policy influence
Federal policy moves—with the federal funds rate near 5.25–5.50% and 30‑year mortgage rates around 7% in 2024–25—directly steer City National’s loan demand, deposit pricing and net interest margins. Tightening has compressed mortgage and CRE volumes in Southern California and New York, while easing historically triggers refinancing waves. Policy guidance shapes client expectations and balance‑sheet duration strategy, so coordination with liquidity buffers is critical around inflection points.
Federal fiscal priorities
Federal spending patterns—including the $1.2 trillion Bipartisan Infrastructure Law and roughly $6.2 trillion in FY2024 federal outlays—influence activity in Los Angeles, D.C., and New York corridors by driving project pipelines and defense and healthcare contracting. SBA and government‑backed programs expand small‑business lending channels and referral flows. Shifts in tax policy reshape HNW planning and cross‑market wealth movement, while budget uncertainty can delay capital projects and reduce credit demand.
Regional political dynamics
State and city housing, zoning, and public safety policies shape CRE pipelines in LA, NYC and Las Vegas, where 2024 transaction activity remained concentrated in core office and multifamily corridors; incentives in Nashville and Atlanta supported over 60 corporate relocations in 2024, lifting middle‑market banking demand; local tax and fee changes (property tax adjustments of 1–3% in some metros) alter operating costs and client siting; election cycles in 2024 lengthened permitting timelines by as much as 20–30%, delaying deals.
Trade and immigration stance
Trade policy shapes demand from entertainment, tech and professional services concentrated in California, which produces roughly 15% of US GDP; restrictive tariffs or trade wars compress cross‑border revenue for City National Bank clients. Immigration rules affect labor supply for hospitality and services in Las Vegas and Southern California, where leisure and hospitality represent about 30% of local employment. Geopolitical risk drives cross‑border capital flows and FX volatility, altering deposit inflows and wealth management needs.
- Trade impact on coastal client revenues
- Immigration affects labor for Vegas/SoCal hospitality
- Geopolitics shifts deposit/FX and wealth management demand
Public–private funding climate
Partnerships for affordable housing and community development hinge on political will and grant continuity; banks can tap New Markets Tax Credits (NMTC, recent annual allocations ~5 billion) and municipal programs to originate mission‑aligned loans, but changes in program funding erode pipeline visibility and forecastability.
Stakeholder engagement with city councils and local housing authorities can unlock zoning approvals and municipal subsidies.
- NMTC ~5 billion annual allocation
- Program stability = pipeline visibility
- City council engagement unlocks local subsidies
Fed 5.25–5.50% compresses CRE/mortgages; US outlays back projects
Federal policy (fed funds 5.25–5.50%, 30‑yr mortgage ~7%) drives loan demand, deposit pricing and NIMs; tightening compressed CRE and mortgage activity. Federal outlays (~$6.2T FY2024) and NMTC (~$5B) underpin project pipelines and community lending. State/city zoning, taxes (property adj. 1–3%) and election delays (permits +20–30%) reshape CRE timing; trade, immigration and geopolitics alter client revenues and FX flows.
| Metric | Value |
|---|---|
| Fed funds | 5.25–5.50% |
| 30‑yr mortgage | ~7% |
| FY2024 outlays | $6.2T |
| NMTC | ~$5B |
What is included in the product
Detailed Word Document
Explores how Political, Economic, Social, Technological, Environmental and Legal forces uniquely affect City National Bank, with data-backed trends, forward-looking insights and actionable examples to help executives, consultants and investors identify risks, opportunities and strategy-ready scenarios.
Customizable Excel Spreadsheet
A concise, visually segmented City National Bank PESTLE summary that distills regulatory, economic, and technological risks into a single-slide-ready format, helping teams quickly align on external threats and strategic opportunities during planning or client briefings.
Economic factors
Interest rate cycle
Elevated policy rates (Fed funds 5.25–5.50% mid‑2025) boost loan yields and can widen NIM but raise deposit betas and margin volatility; high rates pressure CRE and leveraged finance while supporting deposit growth as clients chase yield. Lower rates historically revive mortgage/refi volumes (30‑yr avg ~7% in 2024–25). Balance‑sheet hedging and asset duration management are critical levers for City National.
Regional growth dispersion
Sunbelt metros like Nashville and Atlanta are outpacing many coastal peers, diversifying loan demand as Atlanta added about 100,000 residents 2020–2023 and Nashville showed similar gains; this shifts mortgage and commercial lending mix. Tourism cycles—Las Vegas hosted ~42.3M visitors in 2023 and LAX handled ~66M passengers—drive volatile deposits and card spend. Sector mix alters credit costs and cross‑sell potential; portfolio allocation should mirror regional momentum.
Credit cycle and CRE exposure
Office vacancy in NYC (about 15.6% Q4 2024) and LA (about 21.8% Q4 2024) elevates delinquency and impairment risk, with bank CRE delinquency at roughly 1.4% (FDIC Q4 2024). Strong underwriting and collateral discipline limit losses but reduce origination volumes. Construction lending hinges on absorption, rising cap rates (office cap rates near 6–7% in 2024) and lender competition. Active workout capabilities help preserve collateral value through the cycle.
Labor market and wage trends
Tight U.S. labor markets (unemployment 3.7% June 2025, BLS) lift operating costs and drive small‑business credit demand; average hourly earnings up ~4.0% YoY (May 2025, BLS) which supports deposits and spending but compresses efficiency ratios. Remote/hybrid work (~30% of workforce, McKinsey 2024) reduces branch traffic and office demand. Recruiting specialized wealth and tech talent remains highly competitive.
- Unemployment: 3.7% (BLS Jun 2025)
- Wage growth: AHE ~4.0% YoY (May 2025)
- Remote/hybrid: ~30% (McKinsey 2024)
- Talent competition: elevated in wealth & tech
Capital markets conditions
Capital markets conditions drive City National Bank's flows: IPO and M&A cycles in New York and Los Angeles materially boost treasury, payments, and wealth inflows, while volatility (VIX avg 16.3 in 2024) lifts trading-related client activity but often delays financing deals; middle‑market loan pricing tracks liquidity premiums and spreads, and stable markets enable fee income from syndications and advisory.
- VIX avg 16.3 (2024)
- Middle‑market spreads set loan pricing
- Stable markets → syndication/advisory fees
Fed 5.25–5.50% compresses CRE/mortgages; US outlays back projects
Higher policy rates (Fed funds 5.25–5.50% mid‑2025) lift loan yields but raise deposit betas and CRE stress; unemployment 3.7% (Jun 2025) and AHE +4.0% (May 2025) support deposits but raise costs. Office vacancy NYC 15.6% / LA 21.8% (Q4 2024) increases CRE impairments; VIX avg 16.3 (2024) moderates fee activity.
| Metric | Value |
|---|---|
| Fed funds | 5.25–5.50% |
| Unemployment | 3.7% |
| AHE | +4.0% YoY |
| Office vacancy (NYC/LA) | 15.6% / 21.8% |
| VIX avg | 16.3 |
| CRE delinquency | ~1.4% |
Same Document Delivered
City National Bank PESTLE Analysis
The preview shown here is the exact City National Bank PESTLE Analysis you’ll receive after purchase—fully formatted and ready to use. The layout, content, and structure visible are identical to the downloadable file. No placeholders or surprises; this is the final, professionally structured document.
Original: $10.00
-65%$10.00
$3.50Description
Your Competitive Advantage Starts with This Report
Unlock strategic advantage with our PESTLE Analysis of City National Bank—concise, data-driven and focused on political, economic and regulatory shifts shaping performance. Ideal for investors and strategists seeking market clarity. Purchase the full report for actionable insights and editable charts.
Political factors
Monetary policy influence
Federal policy moves—with the federal funds rate near 5.25–5.50% and 30‑year mortgage rates around 7% in 2024–25—directly steer City National’s loan demand, deposit pricing and net interest margins. Tightening has compressed mortgage and CRE volumes in Southern California and New York, while easing historically triggers refinancing waves. Policy guidance shapes client expectations and balance‑sheet duration strategy, so coordination with liquidity buffers is critical around inflection points.
Federal fiscal priorities
Federal spending patterns—including the $1.2 trillion Bipartisan Infrastructure Law and roughly $6.2 trillion in FY2024 federal outlays—influence activity in Los Angeles, D.C., and New York corridors by driving project pipelines and defense and healthcare contracting. SBA and government‑backed programs expand small‑business lending channels and referral flows. Shifts in tax policy reshape HNW planning and cross‑market wealth movement, while budget uncertainty can delay capital projects and reduce credit demand.
Regional political dynamics
State and city housing, zoning, and public safety policies shape CRE pipelines in LA, NYC and Las Vegas, where 2024 transaction activity remained concentrated in core office and multifamily corridors; incentives in Nashville and Atlanta supported over 60 corporate relocations in 2024, lifting middle‑market banking demand; local tax and fee changes (property tax adjustments of 1–3% in some metros) alter operating costs and client siting; election cycles in 2024 lengthened permitting timelines by as much as 20–30%, delaying deals.
Trade and immigration stance
Trade policy shapes demand from entertainment, tech and professional services concentrated in California, which produces roughly 15% of US GDP; restrictive tariffs or trade wars compress cross‑border revenue for City National Bank clients. Immigration rules affect labor supply for hospitality and services in Las Vegas and Southern California, where leisure and hospitality represent about 30% of local employment. Geopolitical risk drives cross‑border capital flows and FX volatility, altering deposit inflows and wealth management needs.
- Trade impact on coastal client revenues
- Immigration affects labor for Vegas/SoCal hospitality
- Geopolitics shifts deposit/FX and wealth management demand
Public–private funding climate
Partnerships for affordable housing and community development hinge on political will and grant continuity; banks can tap New Markets Tax Credits (NMTC, recent annual allocations ~5 billion) and municipal programs to originate mission‑aligned loans, but changes in program funding erode pipeline visibility and forecastability.
Stakeholder engagement with city councils and local housing authorities can unlock zoning approvals and municipal subsidies.
- NMTC ~5 billion annual allocation
- Program stability = pipeline visibility
- City council engagement unlocks local subsidies
Fed 5.25–5.50% compresses CRE/mortgages; US outlays back projects
Federal policy (fed funds 5.25–5.50%, 30‑yr mortgage ~7%) drives loan demand, deposit pricing and NIMs; tightening compressed CRE and mortgage activity. Federal outlays (~$6.2T FY2024) and NMTC (~$5B) underpin project pipelines and community lending. State/city zoning, taxes (property adj. 1–3%) and election delays (permits +20–30%) reshape CRE timing; trade, immigration and geopolitics alter client revenues and FX flows.
| Metric | Value |
|---|---|
| Fed funds | 5.25–5.50% |
| 30‑yr mortgage | ~7% |
| FY2024 outlays | $6.2T |
| NMTC | ~$5B |
What is included in the product
Detailed Word Document
Explores how Political, Economic, Social, Technological, Environmental and Legal forces uniquely affect City National Bank, with data-backed trends, forward-looking insights and actionable examples to help executives, consultants and investors identify risks, opportunities and strategy-ready scenarios.
Customizable Excel Spreadsheet
A concise, visually segmented City National Bank PESTLE summary that distills regulatory, economic, and technological risks into a single-slide-ready format, helping teams quickly align on external threats and strategic opportunities during planning or client briefings.
Economic factors
Interest rate cycle
Elevated policy rates (Fed funds 5.25–5.50% mid‑2025) boost loan yields and can widen NIM but raise deposit betas and margin volatility; high rates pressure CRE and leveraged finance while supporting deposit growth as clients chase yield. Lower rates historically revive mortgage/refi volumes (30‑yr avg ~7% in 2024–25). Balance‑sheet hedging and asset duration management are critical levers for City National.
Regional growth dispersion
Sunbelt metros like Nashville and Atlanta are outpacing many coastal peers, diversifying loan demand as Atlanta added about 100,000 residents 2020–2023 and Nashville showed similar gains; this shifts mortgage and commercial lending mix. Tourism cycles—Las Vegas hosted ~42.3M visitors in 2023 and LAX handled ~66M passengers—drive volatile deposits and card spend. Sector mix alters credit costs and cross‑sell potential; portfolio allocation should mirror regional momentum.
Credit cycle and CRE exposure
Office vacancy in NYC (about 15.6% Q4 2024) and LA (about 21.8% Q4 2024) elevates delinquency and impairment risk, with bank CRE delinquency at roughly 1.4% (FDIC Q4 2024). Strong underwriting and collateral discipline limit losses but reduce origination volumes. Construction lending hinges on absorption, rising cap rates (office cap rates near 6–7% in 2024) and lender competition. Active workout capabilities help preserve collateral value through the cycle.
Labor market and wage trends
Tight U.S. labor markets (unemployment 3.7% June 2025, BLS) lift operating costs and drive small‑business credit demand; average hourly earnings up ~4.0% YoY (May 2025, BLS) which supports deposits and spending but compresses efficiency ratios. Remote/hybrid work (~30% of workforce, McKinsey 2024) reduces branch traffic and office demand. Recruiting specialized wealth and tech talent remains highly competitive.
- Unemployment: 3.7% (BLS Jun 2025)
- Wage growth: AHE ~4.0% YoY (May 2025)
- Remote/hybrid: ~30% (McKinsey 2024)
- Talent competition: elevated in wealth & tech
Capital markets conditions
Capital markets conditions drive City National Bank's flows: IPO and M&A cycles in New York and Los Angeles materially boost treasury, payments, and wealth inflows, while volatility (VIX avg 16.3 in 2024) lifts trading-related client activity but often delays financing deals; middle‑market loan pricing tracks liquidity premiums and spreads, and stable markets enable fee income from syndications and advisory.
- VIX avg 16.3 (2024)
- Middle‑market spreads set loan pricing
- Stable markets → syndication/advisory fees
Fed 5.25–5.50% compresses CRE/mortgages; US outlays back projects
Higher policy rates (Fed funds 5.25–5.50% mid‑2025) lift loan yields but raise deposit betas and CRE stress; unemployment 3.7% (Jun 2025) and AHE +4.0% (May 2025) support deposits but raise costs. Office vacancy NYC 15.6% / LA 21.8% (Q4 2024) increases CRE impairments; VIX avg 16.3 (2024) moderates fee activity.
| Metric | Value |
|---|---|
| Fed funds | 5.25–5.50% |
| Unemployment | 3.7% |
| AHE | +4.0% YoY |
| Office vacancy (NYC/LA) | 15.6% / 21.8% |
| VIX avg | 16.3 |
| CRE delinquency | ~1.4% |
Same Document Delivered
City National Bank PESTLE Analysis
The preview shown here is the exact City National Bank PESTLE Analysis you’ll receive after purchase—fully formatted and ready to use. The layout, content, and structure visible are identical to the downloadable file. No placeholders or surprises; this is the final, professionally structured document.











