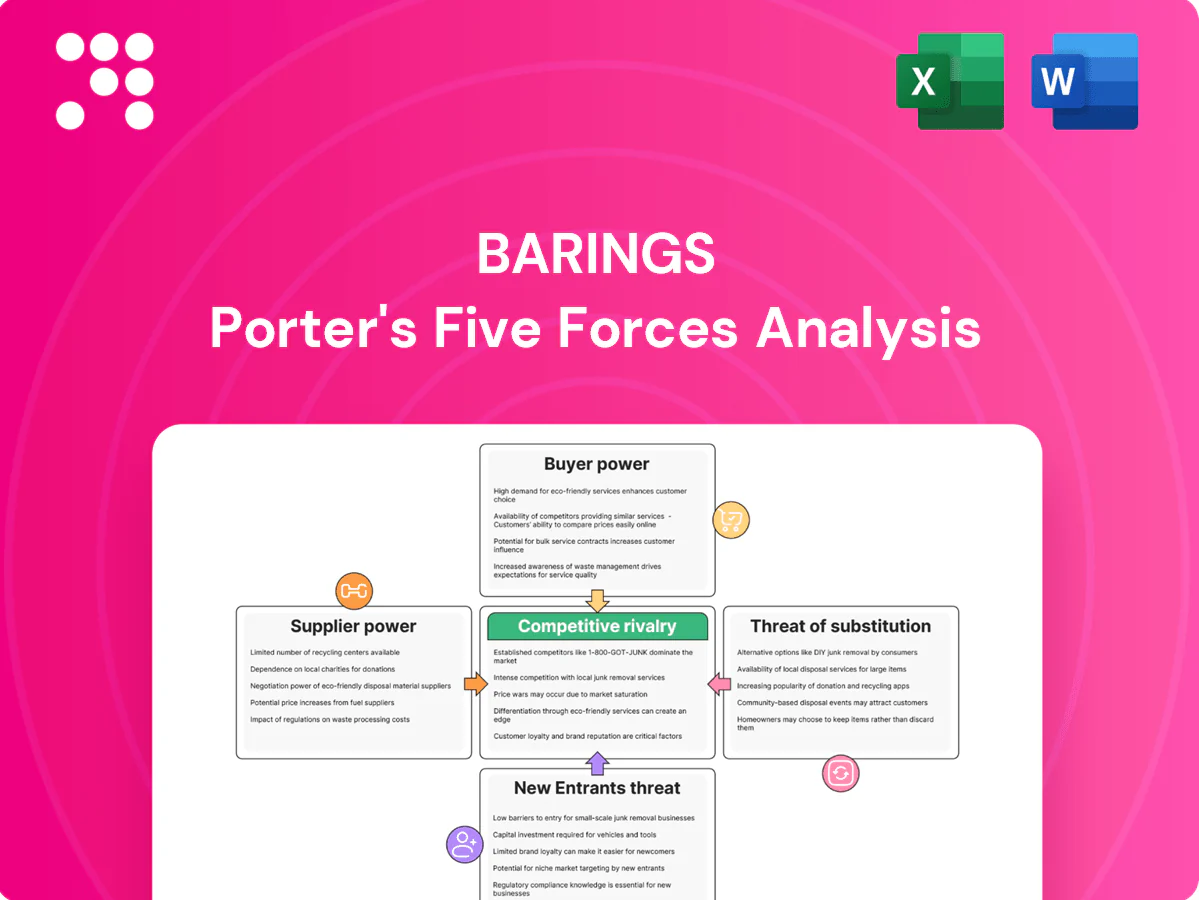
Barings Porter's Five Forces Analysis

A Must-Have Tool for Decision-Makers
Barings’s Porter's Five Forces snapshot highlights key pressures—buyer and supplier power, competitive rivalry, threat of substitutes, and new entrants—and how they shape profitability. This brief teases strategic insights and market risks; unlock the full Porter's Five Forces Analysis for force-by-force ratings, visuals, and actionable recommendations to inform investment or strategy decisions.
Suppliers Bargaining Power

Scarce investment talent
Barings, managing about $347 billion in AUM (2024), depends on scarce portfolio managers, analysts and deal originators in private credit and real assets, elevating wage and retention costs as top performers are mobile. Talent concentration in key teams increases key-person risk and potential deal disruption. Robust culture, carried-interest structures and clear career paths materially reduce supplier leverage and turnover.
Proprietary deal flow and intermediaries
In private markets sponsors, banks and boutique advisors control access to quality deal flow, and in 2024 global private equity deal value was roughly $900 billion, concentrating leverage with intermediaries. Competition for origination tightens pricing and weakens covenants, while long-standing relationships and scale—e.g., larger sponsors originating a disproportionate share—improve bargaining. Disintermediation via direct sourcing is growing, reducing dependence over time.

Market data, analytics, and tech vendors
Essential pricing, benchmark and ESG feeds plus OMS, risk and compliance platforms are concentrated among a few providers (top vendors serving over 70% of institutional firms), giving suppliers strong leverage. Switching costs and integration complexity can reach tens of millions and typically span 3–5 year projects, locking clients in. Volume contracts and multi-year agreements commonly deliver 5–15% cost reductions. Wider use of open architecture and in-house analytics (adopted by about 45% of asset managers in 2024) can rebalance vendor power.

Trading venues, brokers, and liquidity providers
Execution quality in fixed income and derivatives depends on dealers and electronic venues; in stressed episodes (eg March 2020) bid-ask spreads widened up to 5x and transaction costs surged. Liquidity thinning raises market impact and funding costs. Barings, with roughly $331bn AUM in 2024, leverages aggregated flow to secure tighter spreads and venue access. A diversified counterparty list reduces single-supplier concentration risk.
- Execution reliance: dealers, e-platforms
- Stress impact: spreads up to 5x wider
- Scale: Barings ~331bn AUM (2024) improves access
- Risk mitigation: diversified counterparties
Fund administration, custody, and service providers
Custodians, administrators and auditors are concentrated and highly regulated, giving moderate supplier power; BNY Mellon reported $46.2T AUC/A at end‑2023.
Standardized services limit differentiation but raise switching costs; multi‑provider setups boost resilience and bargaining.
Long‑term partnerships produce SLAs and pricing stability via multi‑year fee schedules.
- Concentration: BNY 46.2T (2023)
- Switching costs: operational migration
- Mitigation: multi‑provider + long‑term SLAs
Vendors squeeze asset managers; $900bn PE deals and 3–5yr switching costs
Barings (AUM ~$347bn in 2024) faces high supplier power for scarce talent, specialized data/tech vendors (top vendors serve >70% of institutions) and concentrated dealers; switching costs often span 3–5 years and tens of millions. Deep sponsor networks concentrate private origination (global PE deal value ~$900bn in 2024). Multi-vendor setups and direct sourcing reduce supplier leverage.
| Metric | 2023/2024 |
|---|---|
| Barings AUM | $347bn (2024) |
| Global PE deal value | $900bn (2024) |
| Top-vendor reach | >70% institutions |
| Switching cost horizon | 3–5 years |
What is included in the product
 Detailed Word Document
Concise Porter's Five Forces review tailored to Barings, examining competitive rivalry, buyer/supplier power, entry barriers, and substitutes to highlight strategic risks and opportunities.

 Customizable Excel Spreadsheet
Barings Porter's Five Forces: a one-sheet summary that distills competitive pressures into an editable radar view, instantly updateable with live data and ready for decks—no macros, simple for non-finance users to customize and act on.
Customers Bargaining Power

Institutional fee negotiations
Pension funds, insurers and sovereigns overseeing over $50 trillion in global assets (2024) apply procurement rigor that forces steep negotiations on management fees and hurdle structures. Carried interest typically remains at 20% with hurdles around 7–8%, but headline management fees have fallen roughly 15% since 2019 as buyers demand better economics. Managers increasingly offer performance‑linked fees, tiered pricing and co‑invest access; enhanced transparent reporting often secures improved terms without across‑the‑board fee cuts.
Mandate portability and switching costs
Clients can reallocate mandates to competitors or passive funds; global ETF AUM reached about $12.5 trillion in 2024, highlighting easy passive migration. Operational and tax frictions exist but are typically manageable for institutional investors, with mandate transfers often completed within weeks. Consistent excess-return delivery materially reduces churn risk. High-quality onboarding and client service increase perceived switching costs and retention.

Demand for customization
Buyers increasingly demand tailored guidelines, ESG tilts, and liability-aware designs, fragmenting standardized products and shifting bargaining power to clients; sustainable assets reached about 41.1 trillion USD in 2022, underscoring client focus on ESG. Customization deepens client embedding and extends relationship duration, but pricing must reflect added complexity to preserve margins and avoid margin compression.

Performance and risk transparency
Underperformance triggers rapid redemptions or mandate reviews; in 2024 many institutions accelerated reviews within 6–12 months after persistent underperformance, amplifying buyer leverage. Granular, timely analytics are table stakes—clients now expect daily attribution and stress-testing dashboards. Superior communication and context can sustain patience through cycles, while peer-relative results and benchmarks (eg S&P 500/YTD peers) anchor negotiation power.
Multi-manager diversification
Large allocators increasingly split mandates across multiple managers, intensifying fee and performance comparisons and boosting client bargaining power over fees and terms.
Barings can use co-invest and exclusive capacity grants to differentiate; in 2024 multi-manager mandates favored managers offering bespoke capacity and lower institutional fees.
Strong consultant endorsements—present for Barings in several 2024 consultant league tables—help mitigate buyer leverage.
- Multi-manager mandates: higher price pressure
- Co-invest/capacity: key differentiator
- Consultant ratings: partial counterweight
Institutions ($50T) force fee cuts, ETF migration and higher co-invest demand
Pension funds, insurers and sovereigns overseeing about $50 trillion in assets (2024) exert strong fee and terms pressure; headline management fees down ~15% since 2019 while carried interest often stays ~20% with 7–8% hurdles. Easy passive migration (ETF AUM ~$12.5T in 2024) and multi-manager splits raise buyer leverage; bespoke capacity, co-invest and consultant ratings partly offset.
| Metric | 2024 |
|---|---|
| Institutional AUM overseeing | $50T |
| ETF AUM | $12.5T |
| Headline fee change since 2019 | -15% |
Same Document Delivered
Barings Porter's Five Forces Analysis
This preview shows the exact Barings Porter's Five Forces analysis you'll receive after purchase—fully formatted, professional, and ready to use. No placeholders or mockups; the document here is the final deliverable and will be available for immediate download upon payment. Use it for decision-making or reporting right away.

A Must-Have Tool for Decision-Makers
Barings’s Porter's Five Forces snapshot highlights key pressures—buyer and supplier power, competitive rivalry, threat of substitutes, and new entrants—and how they shape profitability. This brief teases strategic insights and market risks; unlock the full Porter's Five Forces Analysis for force-by-force ratings, visuals, and actionable recommendations to inform investment or strategy decisions.
Suppliers Bargaining Power
Scarce investment talent
Barings, managing about $347 billion in AUM (2024), depends on scarce portfolio managers, analysts and deal originators in private credit and real assets, elevating wage and retention costs as top performers are mobile. Talent concentration in key teams increases key-person risk and potential deal disruption. Robust culture, carried-interest structures and clear career paths materially reduce supplier leverage and turnover.
Proprietary deal flow and intermediaries
In private markets sponsors, banks and boutique advisors control access to quality deal flow, and in 2024 global private equity deal value was roughly $900 billion, concentrating leverage with intermediaries. Competition for origination tightens pricing and weakens covenants, while long-standing relationships and scale—e.g., larger sponsors originating a disproportionate share—improve bargaining. Disintermediation via direct sourcing is growing, reducing dependence over time.
Market data, analytics, and tech vendors
Essential pricing, benchmark and ESG feeds plus OMS, risk and compliance platforms are concentrated among a few providers (top vendors serving over 70% of institutional firms), giving suppliers strong leverage. Switching costs and integration complexity can reach tens of millions and typically span 3–5 year projects, locking clients in. Volume contracts and multi-year agreements commonly deliver 5–15% cost reductions. Wider use of open architecture and in-house analytics (adopted by about 45% of asset managers in 2024) can rebalance vendor power.
Trading venues, brokers, and liquidity providers
Execution quality in fixed income and derivatives depends on dealers and electronic venues; in stressed episodes (eg March 2020) bid-ask spreads widened up to 5x and transaction costs surged. Liquidity thinning raises market impact and funding costs. Barings, with roughly $331bn AUM in 2024, leverages aggregated flow to secure tighter spreads and venue access. A diversified counterparty list reduces single-supplier concentration risk.
- Execution reliance: dealers, e-platforms
- Stress impact: spreads up to 5x wider
- Scale: Barings ~331bn AUM (2024) improves access
- Risk mitigation: diversified counterparties
Fund administration, custody, and service providers
Custodians, administrators and auditors are concentrated and highly regulated, giving moderate supplier power; BNY Mellon reported $46.2T AUC/A at end‑2023.
Standardized services limit differentiation but raise switching costs; multi‑provider setups boost resilience and bargaining.
Long‑term partnerships produce SLAs and pricing stability via multi‑year fee schedules.
- Concentration: BNY 46.2T (2023)
- Switching costs: operational migration
- Mitigation: multi‑provider + long‑term SLAs
Vendors squeeze asset managers; $900bn PE deals and 3–5yr switching costs
Barings (AUM ~$347bn in 2024) faces high supplier power for scarce talent, specialized data/tech vendors (top vendors serve >70% of institutions) and concentrated dealers; switching costs often span 3–5 years and tens of millions. Deep sponsor networks concentrate private origination (global PE deal value ~$900bn in 2024). Multi-vendor setups and direct sourcing reduce supplier leverage.
| Metric | 2023/2024 |
|---|---|
| Barings AUM | $347bn (2024) |
| Global PE deal value | $900bn (2024) |
| Top-vendor reach | >70% institutions |
| Switching cost horizon | 3–5 years |
What is included in the product
Detailed Word Document
Concise Porter's Five Forces review tailored to Barings, examining competitive rivalry, buyer/supplier power, entry barriers, and substitutes to highlight strategic risks and opportunities.
Customizable Excel Spreadsheet
Barings Porter's Five Forces: a one-sheet summary that distills competitive pressures into an editable radar view, instantly updateable with live data and ready for decks—no macros, simple for non-finance users to customize and act on.
Customers Bargaining Power
Institutional fee negotiations
Pension funds, insurers and sovereigns overseeing over $50 trillion in global assets (2024) apply procurement rigor that forces steep negotiations on management fees and hurdle structures. Carried interest typically remains at 20% with hurdles around 7–8%, but headline management fees have fallen roughly 15% since 2019 as buyers demand better economics. Managers increasingly offer performance‑linked fees, tiered pricing and co‑invest access; enhanced transparent reporting often secures improved terms without across‑the‑board fee cuts.
Mandate portability and switching costs
Clients can reallocate mandates to competitors or passive funds; global ETF AUM reached about $12.5 trillion in 2024, highlighting easy passive migration. Operational and tax frictions exist but are typically manageable for institutional investors, with mandate transfers often completed within weeks. Consistent excess-return delivery materially reduces churn risk. High-quality onboarding and client service increase perceived switching costs and retention.
Demand for customization
Buyers increasingly demand tailored guidelines, ESG tilts, and liability-aware designs, fragmenting standardized products and shifting bargaining power to clients; sustainable assets reached about 41.1 trillion USD in 2022, underscoring client focus on ESG. Customization deepens client embedding and extends relationship duration, but pricing must reflect added complexity to preserve margins and avoid margin compression.
Performance and risk transparency
Underperformance triggers rapid redemptions or mandate reviews; in 2024 many institutions accelerated reviews within 6–12 months after persistent underperformance, amplifying buyer leverage. Granular, timely analytics are table stakes—clients now expect daily attribution and stress-testing dashboards. Superior communication and context can sustain patience through cycles, while peer-relative results and benchmarks (eg S&P 500/YTD peers) anchor negotiation power.
Multi-manager diversification
Large allocators increasingly split mandates across multiple managers, intensifying fee and performance comparisons and boosting client bargaining power over fees and terms.
Barings can use co-invest and exclusive capacity grants to differentiate; in 2024 multi-manager mandates favored managers offering bespoke capacity and lower institutional fees.
Strong consultant endorsements—present for Barings in several 2024 consultant league tables—help mitigate buyer leverage.
- Multi-manager mandates: higher price pressure
- Co-invest/capacity: key differentiator
- Consultant ratings: partial counterweight
Institutions ($50T) force fee cuts, ETF migration and higher co-invest demand
Pension funds, insurers and sovereigns overseeing about $50 trillion in assets (2024) exert strong fee and terms pressure; headline management fees down ~15% since 2019 while carried interest often stays ~20% with 7–8% hurdles. Easy passive migration (ETF AUM ~$12.5T in 2024) and multi-manager splits raise buyer leverage; bespoke capacity, co-invest and consultant ratings partly offset.
| Metric | 2024 |
|---|---|
| Institutional AUM overseeing | $50T |
| ETF AUM | $12.5T |
| Headline fee change since 2019 | -15% |
Same Document Delivered
Barings Porter's Five Forces Analysis
This preview shows the exact Barings Porter's Five Forces analysis you'll receive after purchase—fully formatted, professional, and ready to use. No placeholders or mockups; the document here is the final deliverable and will be available for immediate download upon payment. Use it for decision-making or reporting right away.
Original: $10.00
-65%$10.00
$3.50Description
A Must-Have Tool for Decision-Makers
Barings’s Porter's Five Forces snapshot highlights key pressures—buyer and supplier power, competitive rivalry, threat of substitutes, and new entrants—and how they shape profitability. This brief teases strategic insights and market risks; unlock the full Porter's Five Forces Analysis for force-by-force ratings, visuals, and actionable recommendations to inform investment or strategy decisions.
Suppliers Bargaining Power
Scarce investment talent
Barings, managing about $347 billion in AUM (2024), depends on scarce portfolio managers, analysts and deal originators in private credit and real assets, elevating wage and retention costs as top performers are mobile. Talent concentration in key teams increases key-person risk and potential deal disruption. Robust culture, carried-interest structures and clear career paths materially reduce supplier leverage and turnover.
Proprietary deal flow and intermediaries
In private markets sponsors, banks and boutique advisors control access to quality deal flow, and in 2024 global private equity deal value was roughly $900 billion, concentrating leverage with intermediaries. Competition for origination tightens pricing and weakens covenants, while long-standing relationships and scale—e.g., larger sponsors originating a disproportionate share—improve bargaining. Disintermediation via direct sourcing is growing, reducing dependence over time.
Market data, analytics, and tech vendors
Essential pricing, benchmark and ESG feeds plus OMS, risk and compliance platforms are concentrated among a few providers (top vendors serving over 70% of institutional firms), giving suppliers strong leverage. Switching costs and integration complexity can reach tens of millions and typically span 3–5 year projects, locking clients in. Volume contracts and multi-year agreements commonly deliver 5–15% cost reductions. Wider use of open architecture and in-house analytics (adopted by about 45% of asset managers in 2024) can rebalance vendor power.
Trading venues, brokers, and liquidity providers
Execution quality in fixed income and derivatives depends on dealers and electronic venues; in stressed episodes (eg March 2020) bid-ask spreads widened up to 5x and transaction costs surged. Liquidity thinning raises market impact and funding costs. Barings, with roughly $331bn AUM in 2024, leverages aggregated flow to secure tighter spreads and venue access. A diversified counterparty list reduces single-supplier concentration risk.
- Execution reliance: dealers, e-platforms
- Stress impact: spreads up to 5x wider
- Scale: Barings ~331bn AUM (2024) improves access
- Risk mitigation: diversified counterparties
Fund administration, custody, and service providers
Custodians, administrators and auditors are concentrated and highly regulated, giving moderate supplier power; BNY Mellon reported $46.2T AUC/A at end‑2023.
Standardized services limit differentiation but raise switching costs; multi‑provider setups boost resilience and bargaining.
Long‑term partnerships produce SLAs and pricing stability via multi‑year fee schedules.
- Concentration: BNY 46.2T (2023)
- Switching costs: operational migration
- Mitigation: multi‑provider + long‑term SLAs
Vendors squeeze asset managers; $900bn PE deals and 3–5yr switching costs
Barings (AUM ~$347bn in 2024) faces high supplier power for scarce talent, specialized data/tech vendors (top vendors serve >70% of institutions) and concentrated dealers; switching costs often span 3–5 years and tens of millions. Deep sponsor networks concentrate private origination (global PE deal value ~$900bn in 2024). Multi-vendor setups and direct sourcing reduce supplier leverage.
| Metric | 2023/2024 |
|---|---|
| Barings AUM | $347bn (2024) |
| Global PE deal value | $900bn (2024) |
| Top-vendor reach | >70% institutions |
| Switching cost horizon | 3–5 years |
What is included in the product
Detailed Word Document
Concise Porter's Five Forces review tailored to Barings, examining competitive rivalry, buyer/supplier power, entry barriers, and substitutes to highlight strategic risks and opportunities.
Customizable Excel Spreadsheet
Barings Porter's Five Forces: a one-sheet summary that distills competitive pressures into an editable radar view, instantly updateable with live data and ready for decks—no macros, simple for non-finance users to customize and act on.
Customers Bargaining Power
Institutional fee negotiations
Pension funds, insurers and sovereigns overseeing over $50 trillion in global assets (2024) apply procurement rigor that forces steep negotiations on management fees and hurdle structures. Carried interest typically remains at 20% with hurdles around 7–8%, but headline management fees have fallen roughly 15% since 2019 as buyers demand better economics. Managers increasingly offer performance‑linked fees, tiered pricing and co‑invest access; enhanced transparent reporting often secures improved terms without across‑the‑board fee cuts.
Mandate portability and switching costs
Clients can reallocate mandates to competitors or passive funds; global ETF AUM reached about $12.5 trillion in 2024, highlighting easy passive migration. Operational and tax frictions exist but are typically manageable for institutional investors, with mandate transfers often completed within weeks. Consistent excess-return delivery materially reduces churn risk. High-quality onboarding and client service increase perceived switching costs and retention.
Demand for customization
Buyers increasingly demand tailored guidelines, ESG tilts, and liability-aware designs, fragmenting standardized products and shifting bargaining power to clients; sustainable assets reached about 41.1 trillion USD in 2022, underscoring client focus on ESG. Customization deepens client embedding and extends relationship duration, but pricing must reflect added complexity to preserve margins and avoid margin compression.
Performance and risk transparency
Underperformance triggers rapid redemptions or mandate reviews; in 2024 many institutions accelerated reviews within 6–12 months after persistent underperformance, amplifying buyer leverage. Granular, timely analytics are table stakes—clients now expect daily attribution and stress-testing dashboards. Superior communication and context can sustain patience through cycles, while peer-relative results and benchmarks (eg S&P 500/YTD peers) anchor negotiation power.
Multi-manager diversification
Large allocators increasingly split mandates across multiple managers, intensifying fee and performance comparisons and boosting client bargaining power over fees and terms.
Barings can use co-invest and exclusive capacity grants to differentiate; in 2024 multi-manager mandates favored managers offering bespoke capacity and lower institutional fees.
Strong consultant endorsements—present for Barings in several 2024 consultant league tables—help mitigate buyer leverage.
- Multi-manager mandates: higher price pressure
- Co-invest/capacity: key differentiator
- Consultant ratings: partial counterweight
Institutions ($50T) force fee cuts, ETF migration and higher co-invest demand
Pension funds, insurers and sovereigns overseeing about $50 trillion in assets (2024) exert strong fee and terms pressure; headline management fees down ~15% since 2019 while carried interest often stays ~20% with 7–8% hurdles. Easy passive migration (ETF AUM ~$12.5T in 2024) and multi-manager splits raise buyer leverage; bespoke capacity, co-invest and consultant ratings partly offset.
| Metric | 2024 |
|---|---|
| Institutional AUM overseeing | $50T |
| ETF AUM | $12.5T |
| Headline fee change since 2019 | -15% |
Same Document Delivered
Barings Porter's Five Forces Analysis
This preview shows the exact Barings Porter's Five Forces analysis you'll receive after purchase—fully formatted, professional, and ready to use. No placeholders or mockups; the document here is the final deliverable and will be available for immediate download upon payment. Use it for decision-making or reporting right away.











