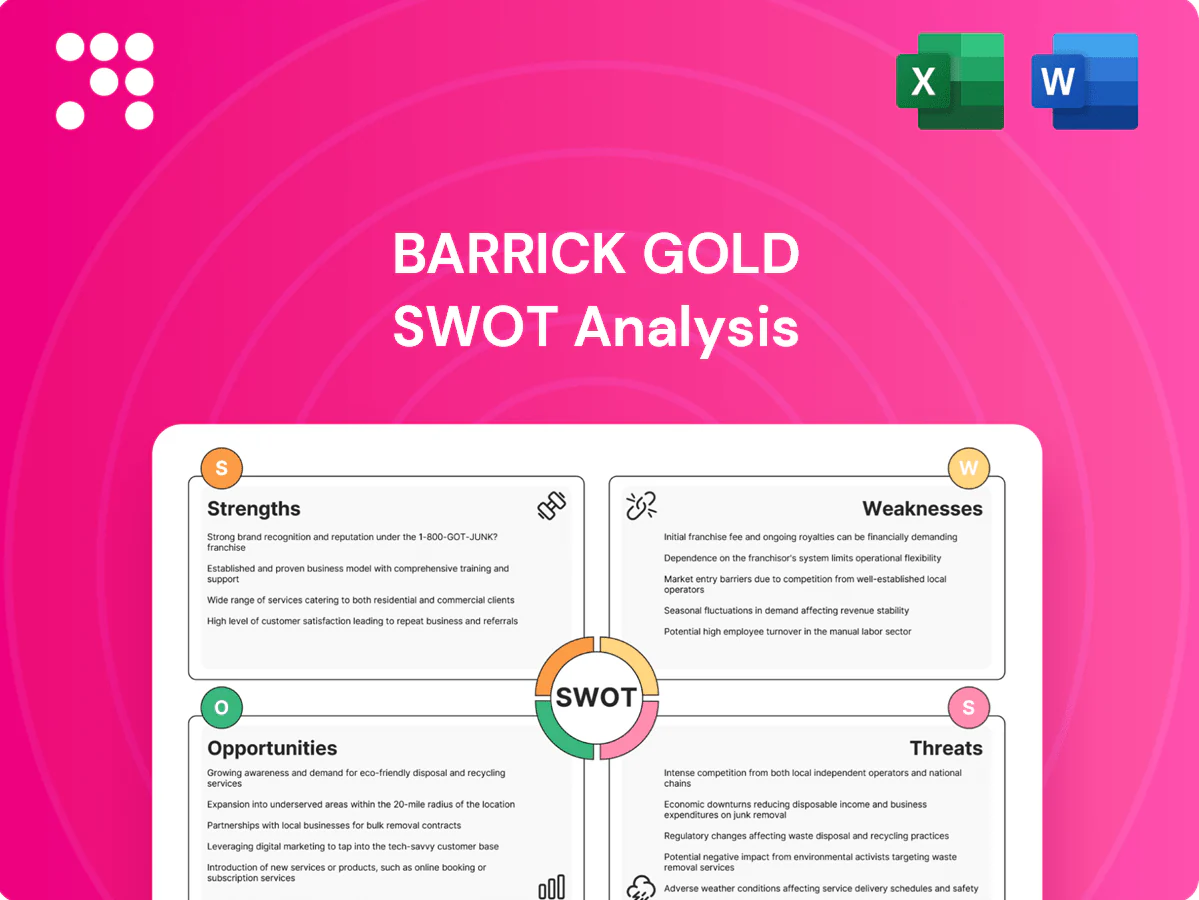
Barrick Gold SWOT Analysis

Make Insightful Decisions Backed by Expert Research
Barrick Gold boasts scale and diversified assets yet faces geopolitical, environmental and metal-price volatility; our concise SWOT highlights these dynamics. The full analysis dissects competitive strengths, operational risks and growth opportunities with financial context. Purchase the complete, editable Word + Excel SWOT to support investment, strategy or pitch preparation.
Strengths

Global Tier-One asset base
Barrick operates large, long-life, low-cost mines across multiple continents, reducing single-asset risk and enabling steady free cash flow generation. Its portfolio balances legacy gold assets with a growing copper footprint, providing earnings diversity as copper exposure increases through projects and JVs. Geographic spread offers operational optionality and resilience through commodity cycles, while scale delivers procurement leverage and rapid deployment of best practices.
Proven operational excellence
Barrick’s proven operational excellence spans exploration, mine development and efficient processing, supporting 2024 production guidance of 4.1–4.6 million ounces. Continuous improvement and disciplined cost management have kept AISC near the industry-leading ~1,000 USD/oz level, underpinning strong free cash flow. Deep technical teams enable unlocking complex ore bodies and reliable operations drive predictable cash generation.

Strategic partnerships and JVs
Collaborations with leading peers de-risk mega-assets and optimize regional synergies, exemplified by the Nevada Gold Mines JV formed in 2019 where Barrick holds a 61.5% stake, creating the world’s largest gold complex. Shared infrastructure and expertise boost throughput and lower per-unit costs across adjacent operations. JVs enable faster ramp-ups and capital efficiency through pooled funding and shared risk. Partnering also eases navigation of regulatory and community dynamics in challenging jurisdictions.

Robust balance sheet and liquidity
Prudent capital allocation has sustained dividends and reinvestment through cycles, with Barrick returning roughly $1.4bn to shareholders in 2024 while funding growth projects.
Access to diversified funding — including a $5bn revolving credit facility and bond issuances — lowers project cost of capital for large builds like Pascua-Lama-stage work.
Strong liquidity buffers (about $5bn cash and ~10.5bn total available liquidity) absorb operational volatility and enable countercyclical M&A and project acceleration.
- Dividend continuity
- Diversified funding
- ~$5bn cash
- ~$10.5bn liquidity
ESG and responsible mining focus
Barrick’s explicit focus on safety, community engagement and environmental stewardship strengthens its social license and supported continued operations amid 2024 production of ~4.0 Moz attributable gold. Transparent reporting and upgraded tailings governance cut non-technical risk and aided permitting. Biodiversity, water stewardship and decarbonization programs lower long-term costs and improve investor access.
- Safety/community: social license
- Reporting/tailings: lower non-technical risk
- Biodiversity/water/decarbonization: cost reduction
- ESG credibility: permitting & investor access
Large low-cost gold portfolio: ~4.0 Moz 2024, AISC 1,000 USD/oz
Barrick’s large, low‑cost, diversified portfolio (Nevada Gold Mines 61.5% stake) supports steady cash flow; 2024 production ~4.0 Moz attributable with 2024 guidance 4.1–4.6 Moz. AISC ~1,000 USD/oz and strong liquidity (~$5bn cash, ~$10.5bn total) enabled ~$1.4bn shareholder returns in 2024.
| Metric | 2024 |
|---|---|
| Attributed production | ~4.0 Moz |
| AISC | ~1,000 USD/oz |
| Cash | ~$5bn |
| Liquidity | ~$10.5bn |
| Shareholder returns | ~$1.4bn |
What is included in the product
 Detailed Word Document
Maps out Barrick Gold’s market strengths, operational gaps, and risks by outlining internal capabilities, strategic opportunities, and external threats shaping the company’s competitive position and future growth.

 Customizable Excel Spreadsheet
Provides a focused Barrick Gold SWOT matrix to quickly align strategy against commodity volatility and geopolitical risk; editable format enables rapid updates for shifting gold prices, regulatory changes, and operational priorities.
Weaknesses

Jurisdictional exposure
Operations in higher-risk countries elevate political, fiscal and permitting uncertainty for Barrick, which operates across 10 countries, exposing material portions of cash flow to sovereign actions. Currency controls, export restrictions and past contract renegotiations in jurisdictions like Tanzania and Papua New Guinea have disrupted receipts and production timing. Security and infrastructure constraints increase capital and operating costs and extend project timelines. Diversification across assets mitigates but does not eliminate concentration risk.
Operational complexity
Barrick runs multiple large sites across 10+ countries, including Cortez, Pueblo Viejo and Kibali, which increases planning and execution challenges and logistics complexity.
Integration of new projects and joint ventures has strained IT, supply-chain and cultural alignment in recent expansions.
High variability in ore grades and metallurgy drives production swings quarter-to-quarter, raising sustaining capex and working capital requirements.

High capital intensity
Barrick faces high capital intensity as gold and copper projects require multi‑billion‑dollar upfront and sustaining investments, with long payback horizons that increase exposure to metal price cycles and cost inflation. Capex overruns and schedule slippage on large mines can materially impair returns and margins. Intense competition for capital across development, exploration and returns may defer attractive growth projects.

Reserve replacement pressure
Reserve replacement pressure threatens Barrick as sustaining long mine lives requires continuous exploration success; Barrick reported about 71.1 Moz proven and probable gold reserves at end-2023 while 2024 production targeted ~4.6 Moz, shrinking reserves per ounce produced. Brownfield gains have limited upside, pushing greener but riskier greenfield projects; inflation-driven higher cut-off grades can materially reduce reported reserves, and ounce-accretive M&A brings integration and valuation risks.
- 71.1 Moz P&P reserves (end-2023)
- ≈4.6 Moz 2024 production guidance
- Brownfield plateau → greenfield risk
- Rising cut-off grades reduce reserves
- M&A adds integration/valuation risk
Environmental and social liabilities
Tailings, water use and land impacts create remediation and reputational costs for Barrick, with reported closure and rehabilitation provisions of about US$2.2 billion in 2024, and long-tail liabilities at legacy sites.
Community disputes have delayed projects in 2024, and ESG missteps risk investor outflows and stricter regulatory oversight in key jurisdictions.
- Remediation provisions: ~US$2.2B (2024)
- Legacy site obligations: ongoing
- Community disputes: project delays (2024)
- ESG risk: potential investor outflows/heightened oversight
10+ high-risk countries, reserve squeeze and US$2.2B closure drag
Operations across 10+ higher‑risk countries raise political, fiscal and permitting exposure, disrupting receipts and timelines. High capital intensity and grade variability drive sustaining capex, working capital swings and long payback horizons. Reserve pressure (71.1 Moz P&P end‑2023 vs ~4.6 Moz 2024 guidance) plus ~$2.2B closure provisions constrain flexibility.
| Metric | Value |
|---|---|
| Countries | 10+ |
| P&P Reserves (end‑2023) | 71.1 Moz |
| 2024 Prod. Guidance | ≈4.6 Moz |
| Closure provisions (2024) | ~US$2.2B |
Same Document Delivered
Barrick Gold SWOT Analysis
This is the actual SWOT analysis document you’ll receive upon purchase—no surprises, just professional quality. The preview below is taken directly from the full SWOT report you'll get; buying unlocks the complete, editable version with detailed strengths, weaknesses, opportunities, and threats. You're viewing a live excerpt of the real file, ready for immediate use after checkout.

Make Insightful Decisions Backed by Expert Research
Barrick Gold boasts scale and diversified assets yet faces geopolitical, environmental and metal-price volatility; our concise SWOT highlights these dynamics. The full analysis dissects competitive strengths, operational risks and growth opportunities with financial context. Purchase the complete, editable Word + Excel SWOT to support investment, strategy or pitch preparation.
Strengths
Global Tier-One asset base
Barrick operates large, long-life, low-cost mines across multiple continents, reducing single-asset risk and enabling steady free cash flow generation. Its portfolio balances legacy gold assets with a growing copper footprint, providing earnings diversity as copper exposure increases through projects and JVs. Geographic spread offers operational optionality and resilience through commodity cycles, while scale delivers procurement leverage and rapid deployment of best practices.
Proven operational excellence
Barrick’s proven operational excellence spans exploration, mine development and efficient processing, supporting 2024 production guidance of 4.1–4.6 million ounces. Continuous improvement and disciplined cost management have kept AISC near the industry-leading ~1,000 USD/oz level, underpinning strong free cash flow. Deep technical teams enable unlocking complex ore bodies and reliable operations drive predictable cash generation.
Strategic partnerships and JVs
Collaborations with leading peers de-risk mega-assets and optimize regional synergies, exemplified by the Nevada Gold Mines JV formed in 2019 where Barrick holds a 61.5% stake, creating the world’s largest gold complex. Shared infrastructure and expertise boost throughput and lower per-unit costs across adjacent operations. JVs enable faster ramp-ups and capital efficiency through pooled funding and shared risk. Partnering also eases navigation of regulatory and community dynamics in challenging jurisdictions.
Robust balance sheet and liquidity
Prudent capital allocation has sustained dividends and reinvestment through cycles, with Barrick returning roughly $1.4bn to shareholders in 2024 while funding growth projects.
Access to diversified funding — including a $5bn revolving credit facility and bond issuances — lowers project cost of capital for large builds like Pascua-Lama-stage work.
Strong liquidity buffers (about $5bn cash and ~10.5bn total available liquidity) absorb operational volatility and enable countercyclical M&A and project acceleration.
- Dividend continuity
- Diversified funding
- ~$5bn cash
- ~$10.5bn liquidity
ESG and responsible mining focus
Barrick’s explicit focus on safety, community engagement and environmental stewardship strengthens its social license and supported continued operations amid 2024 production of ~4.0 Moz attributable gold. Transparent reporting and upgraded tailings governance cut non-technical risk and aided permitting. Biodiversity, water stewardship and decarbonization programs lower long-term costs and improve investor access.
- Safety/community: social license
- Reporting/tailings: lower non-technical risk
- Biodiversity/water/decarbonization: cost reduction
- ESG credibility: permitting & investor access
Large low-cost gold portfolio: ~4.0 Moz 2024, AISC 1,000 USD/oz
Barrick’s large, low‑cost, diversified portfolio (Nevada Gold Mines 61.5% stake) supports steady cash flow; 2024 production ~4.0 Moz attributable with 2024 guidance 4.1–4.6 Moz. AISC ~1,000 USD/oz and strong liquidity (~$5bn cash, ~$10.5bn total) enabled ~$1.4bn shareholder returns in 2024.
| Metric | 2024 |
|---|---|
| Attributed production | ~4.0 Moz |
| AISC | ~1,000 USD/oz |
| Cash | ~$5bn |
| Liquidity | ~$10.5bn |
| Shareholder returns | ~$1.4bn |
What is included in the product
Detailed Word Document
Maps out Barrick Gold’s market strengths, operational gaps, and risks by outlining internal capabilities, strategic opportunities, and external threats shaping the company’s competitive position and future growth.
Customizable Excel Spreadsheet
Provides a focused Barrick Gold SWOT matrix to quickly align strategy against commodity volatility and geopolitical risk; editable format enables rapid updates for shifting gold prices, regulatory changes, and operational priorities.
Weaknesses
Jurisdictional exposure
Operations in higher-risk countries elevate political, fiscal and permitting uncertainty for Barrick, which operates across 10 countries, exposing material portions of cash flow to sovereign actions. Currency controls, export restrictions and past contract renegotiations in jurisdictions like Tanzania and Papua New Guinea have disrupted receipts and production timing. Security and infrastructure constraints increase capital and operating costs and extend project timelines. Diversification across assets mitigates but does not eliminate concentration risk.
Operational complexity
Barrick runs multiple large sites across 10+ countries, including Cortez, Pueblo Viejo and Kibali, which increases planning and execution challenges and logistics complexity.
Integration of new projects and joint ventures has strained IT, supply-chain and cultural alignment in recent expansions.
High variability in ore grades and metallurgy drives production swings quarter-to-quarter, raising sustaining capex and working capital requirements.
High capital intensity
Barrick faces high capital intensity as gold and copper projects require multi‑billion‑dollar upfront and sustaining investments, with long payback horizons that increase exposure to metal price cycles and cost inflation. Capex overruns and schedule slippage on large mines can materially impair returns and margins. Intense competition for capital across development, exploration and returns may defer attractive growth projects.
Reserve replacement pressure
Reserve replacement pressure threatens Barrick as sustaining long mine lives requires continuous exploration success; Barrick reported about 71.1 Moz proven and probable gold reserves at end-2023 while 2024 production targeted ~4.6 Moz, shrinking reserves per ounce produced. Brownfield gains have limited upside, pushing greener but riskier greenfield projects; inflation-driven higher cut-off grades can materially reduce reported reserves, and ounce-accretive M&A brings integration and valuation risks.
- 71.1 Moz P&P reserves (end-2023)
- ≈4.6 Moz 2024 production guidance
- Brownfield plateau → greenfield risk
- Rising cut-off grades reduce reserves
- M&A adds integration/valuation risk
Environmental and social liabilities
Tailings, water use and land impacts create remediation and reputational costs for Barrick, with reported closure and rehabilitation provisions of about US$2.2 billion in 2024, and long-tail liabilities at legacy sites.
Community disputes have delayed projects in 2024, and ESG missteps risk investor outflows and stricter regulatory oversight in key jurisdictions.
- Remediation provisions: ~US$2.2B (2024)
- Legacy site obligations: ongoing
- Community disputes: project delays (2024)
- ESG risk: potential investor outflows/heightened oversight
10+ high-risk countries, reserve squeeze and US$2.2B closure drag
Operations across 10+ higher‑risk countries raise political, fiscal and permitting exposure, disrupting receipts and timelines. High capital intensity and grade variability drive sustaining capex, working capital swings and long payback horizons. Reserve pressure (71.1 Moz P&P end‑2023 vs ~4.6 Moz 2024 guidance) plus ~$2.2B closure provisions constrain flexibility.
| Metric | Value |
|---|---|
| Countries | 10+ |
| P&P Reserves (end‑2023) | 71.1 Moz |
| 2024 Prod. Guidance | ≈4.6 Moz |
| Closure provisions (2024) | ~US$2.2B |
Same Document Delivered
Barrick Gold SWOT Analysis
This is the actual SWOT analysis document you’ll receive upon purchase—no surprises, just professional quality. The preview below is taken directly from the full SWOT report you'll get; buying unlocks the complete, editable version with detailed strengths, weaknesses, opportunities, and threats. You're viewing a live excerpt of the real file, ready for immediate use after checkout.
Description
Make Insightful Decisions Backed by Expert Research
Barrick Gold boasts scale and diversified assets yet faces geopolitical, environmental and metal-price volatility; our concise SWOT highlights these dynamics. The full analysis dissects competitive strengths, operational risks and growth opportunities with financial context. Purchase the complete, editable Word + Excel SWOT to support investment, strategy or pitch preparation.
Strengths
Global Tier-One asset base
Barrick operates large, long-life, low-cost mines across multiple continents, reducing single-asset risk and enabling steady free cash flow generation. Its portfolio balances legacy gold assets with a growing copper footprint, providing earnings diversity as copper exposure increases through projects and JVs. Geographic spread offers operational optionality and resilience through commodity cycles, while scale delivers procurement leverage and rapid deployment of best practices.
Proven operational excellence
Barrick’s proven operational excellence spans exploration, mine development and efficient processing, supporting 2024 production guidance of 4.1–4.6 million ounces. Continuous improvement and disciplined cost management have kept AISC near the industry-leading ~1,000 USD/oz level, underpinning strong free cash flow. Deep technical teams enable unlocking complex ore bodies and reliable operations drive predictable cash generation.
Strategic partnerships and JVs
Collaborations with leading peers de-risk mega-assets and optimize regional synergies, exemplified by the Nevada Gold Mines JV formed in 2019 where Barrick holds a 61.5% stake, creating the world’s largest gold complex. Shared infrastructure and expertise boost throughput and lower per-unit costs across adjacent operations. JVs enable faster ramp-ups and capital efficiency through pooled funding and shared risk. Partnering also eases navigation of regulatory and community dynamics in challenging jurisdictions.
Robust balance sheet and liquidity
Prudent capital allocation has sustained dividends and reinvestment through cycles, with Barrick returning roughly $1.4bn to shareholders in 2024 while funding growth projects.
Access to diversified funding — including a $5bn revolving credit facility and bond issuances — lowers project cost of capital for large builds like Pascua-Lama-stage work.
Strong liquidity buffers (about $5bn cash and ~10.5bn total available liquidity) absorb operational volatility and enable countercyclical M&A and project acceleration.
- Dividend continuity
- Diversified funding
- ~$5bn cash
- ~$10.5bn liquidity
ESG and responsible mining focus
Barrick’s explicit focus on safety, community engagement and environmental stewardship strengthens its social license and supported continued operations amid 2024 production of ~4.0 Moz attributable gold. Transparent reporting and upgraded tailings governance cut non-technical risk and aided permitting. Biodiversity, water stewardship and decarbonization programs lower long-term costs and improve investor access.
- Safety/community: social license
- Reporting/tailings: lower non-technical risk
- Biodiversity/water/decarbonization: cost reduction
- ESG credibility: permitting & investor access
Large low-cost gold portfolio: ~4.0 Moz 2024, AISC 1,000 USD/oz
Barrick’s large, low‑cost, diversified portfolio (Nevada Gold Mines 61.5% stake) supports steady cash flow; 2024 production ~4.0 Moz attributable with 2024 guidance 4.1–4.6 Moz. AISC ~1,000 USD/oz and strong liquidity (~$5bn cash, ~$10.5bn total) enabled ~$1.4bn shareholder returns in 2024.
| Metric | 2024 |
|---|---|
| Attributed production | ~4.0 Moz |
| AISC | ~1,000 USD/oz |
| Cash | ~$5bn |
| Liquidity | ~$10.5bn |
| Shareholder returns | ~$1.4bn |
What is included in the product
Detailed Word Document
Maps out Barrick Gold’s market strengths, operational gaps, and risks by outlining internal capabilities, strategic opportunities, and external threats shaping the company’s competitive position and future growth.
Customizable Excel Spreadsheet
Provides a focused Barrick Gold SWOT matrix to quickly align strategy against commodity volatility and geopolitical risk; editable format enables rapid updates for shifting gold prices, regulatory changes, and operational priorities.
Weaknesses
Jurisdictional exposure
Operations in higher-risk countries elevate political, fiscal and permitting uncertainty for Barrick, which operates across 10 countries, exposing material portions of cash flow to sovereign actions. Currency controls, export restrictions and past contract renegotiations in jurisdictions like Tanzania and Papua New Guinea have disrupted receipts and production timing. Security and infrastructure constraints increase capital and operating costs and extend project timelines. Diversification across assets mitigates but does not eliminate concentration risk.
Operational complexity
Barrick runs multiple large sites across 10+ countries, including Cortez, Pueblo Viejo and Kibali, which increases planning and execution challenges and logistics complexity.
Integration of new projects and joint ventures has strained IT, supply-chain and cultural alignment in recent expansions.
High variability in ore grades and metallurgy drives production swings quarter-to-quarter, raising sustaining capex and working capital requirements.
High capital intensity
Barrick faces high capital intensity as gold and copper projects require multi‑billion‑dollar upfront and sustaining investments, with long payback horizons that increase exposure to metal price cycles and cost inflation. Capex overruns and schedule slippage on large mines can materially impair returns and margins. Intense competition for capital across development, exploration and returns may defer attractive growth projects.
Reserve replacement pressure
Reserve replacement pressure threatens Barrick as sustaining long mine lives requires continuous exploration success; Barrick reported about 71.1 Moz proven and probable gold reserves at end-2023 while 2024 production targeted ~4.6 Moz, shrinking reserves per ounce produced. Brownfield gains have limited upside, pushing greener but riskier greenfield projects; inflation-driven higher cut-off grades can materially reduce reported reserves, and ounce-accretive M&A brings integration and valuation risks.
- 71.1 Moz P&P reserves (end-2023)
- ≈4.6 Moz 2024 production guidance
- Brownfield plateau → greenfield risk
- Rising cut-off grades reduce reserves
- M&A adds integration/valuation risk
Environmental and social liabilities
Tailings, water use and land impacts create remediation and reputational costs for Barrick, with reported closure and rehabilitation provisions of about US$2.2 billion in 2024, and long-tail liabilities at legacy sites.
Community disputes have delayed projects in 2024, and ESG missteps risk investor outflows and stricter regulatory oversight in key jurisdictions.
- Remediation provisions: ~US$2.2B (2024)
- Legacy site obligations: ongoing
- Community disputes: project delays (2024)
- ESG risk: potential investor outflows/heightened oversight
10+ high-risk countries, reserve squeeze and US$2.2B closure drag
Operations across 10+ higher‑risk countries raise political, fiscal and permitting exposure, disrupting receipts and timelines. High capital intensity and grade variability drive sustaining capex, working capital swings and long payback horizons. Reserve pressure (71.1 Moz P&P end‑2023 vs ~4.6 Moz 2024 guidance) plus ~$2.2B closure provisions constrain flexibility.
| Metric | Value |
|---|---|
| Countries | 10+ |
| P&P Reserves (end‑2023) | 71.1 Moz |
| 2024 Prod. Guidance | ≈4.6 Moz |
| Closure provisions (2024) | ~US$2.2B |
Same Document Delivered
Barrick Gold SWOT Analysis
This is the actual SWOT analysis document you’ll receive upon purchase—no surprises, just professional quality. The preview below is taken directly from the full SWOT report you'll get; buying unlocks the complete, editable version with detailed strengths, weaknesses, opportunities, and threats. You're viewing a live excerpt of the real file, ready for immediate use after checkout.











