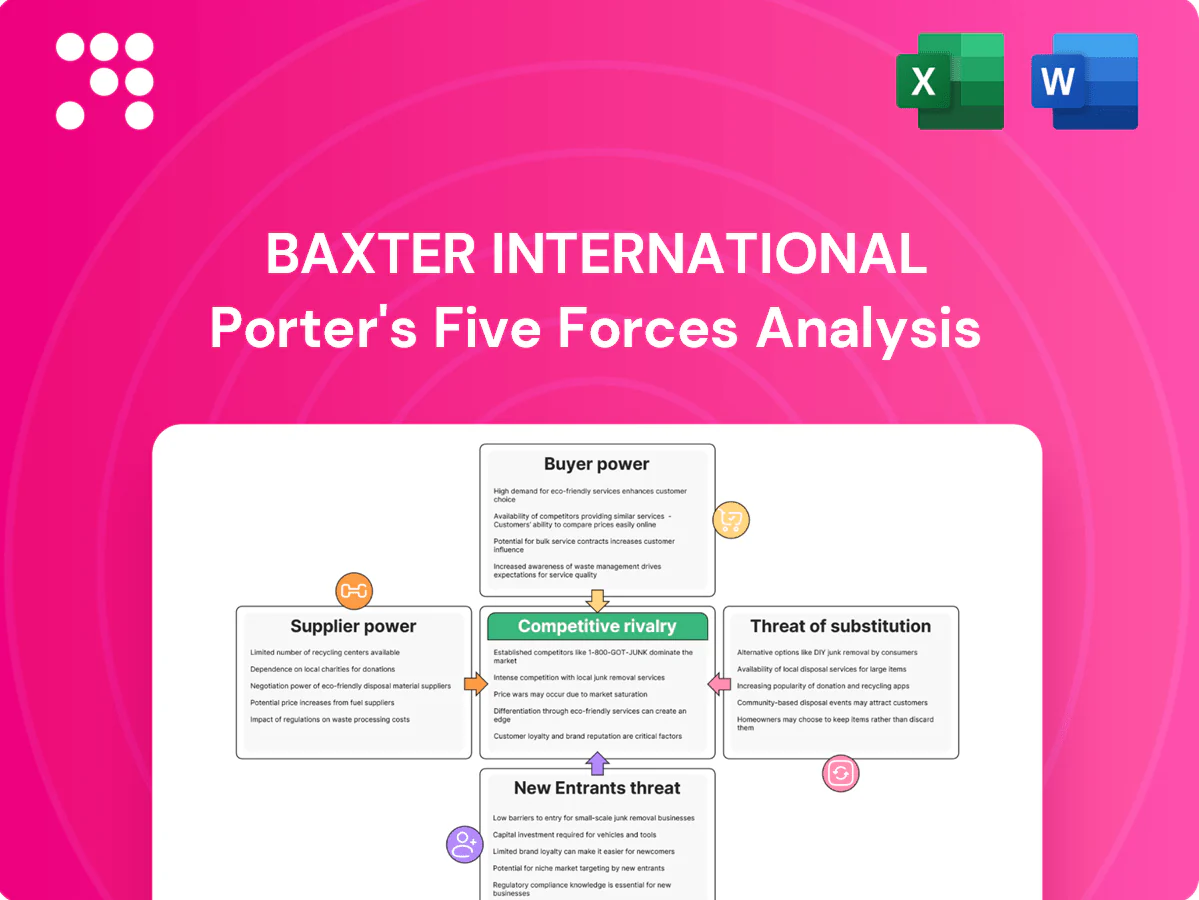
Baxter International Porter's Five Forces Analysis

Elevate Your Analysis with the Complete Porter's Five Forces Analysis
Baxter International faces intense regulatory scrutiny, differentiated product layers, and varied supplier and buyer power that shape pricing and margins; substitutes and emerging entrants add strategic pressure on its clinical portfolio. This brief snapshot only scratches the surface. Unlock the full Porter's Five Forces Analysis to explore Baxter International’s competitive dynamics, market pressures, and strategic advantages in detail.
Suppliers Bargaining Power

Sterile inputs concentration
Many critical inputs—medical-grade resins, IV bags, tubing, filters and EtO/gamma sterilization—are sourced from a concentrated supplier base, and limited commercial sterilization capacity plus heavy regulatory scrutiny elevate dependency and allocation risk. This concentration can force higher input prices or supply constraints. Baxter mitigates through dual-sourcing and long-term contracts but cannot fully diversify away the systemic supplier concentration risk.
Specialized components
Infusion pumps and dialysis systems depend on specialized electronics, sensors and embedded software, and only a limited pool of vendors meet medical-grade quality and traceability standards. Supplier changes frequently trigger revalidation and may require FDA 510(k) submissions or PMA supplements under 21 CFR 820, raising time and compliance costs. These regulatory and technical barriers increase switching costs and grant niche suppliers significant leverage.

Regulatory-grade quality
Regulatory-grade suppliers must meet GMP, ISO 13485 and sterilization standards, which shrinks the qualified pool and heightens bargaining power. Noncompliance risks recalls and supply interruptions that threaten Baxter’s revenue base (2023 revenue $11.3B), increasing reliance on proven partners. Auditing and qualification timelines often run 6–12 months, reinforcing supplier leverage.

Commodity vs. custom mix
While some inputs for Baxter are commodity-based, many disposables are custom tooled to Baxter’s proprietary specs; tooling, molds and unique formulations create high switching costs and supplier lock-in. Requalification of alternate suppliers often requires 3–9 months and can delay production, shifting bargaining power toward suppliers with exclusive capabilities and IP.
- custom tooling: increases lock-in
- requalification: 3–9 months
- proprietary specs: supplier leverage
Logistics and scarcity shocks
Global freight volatility and periodic resin/solvent shortages continued into 2024, constraining Baxter’s input flows; healthcare allocation eases access but emergency allocation still limits volumes during shocks. Suppliers can impose surcharges or minimum order quantities, and Baxter’s scale improves negotiation leverage, yet scarcity raises supplier bargaining power cyclically.
- 2024: healthcare prioritization mitigates but does not eliminate allocation
- Suppliers: surcharges and minimums increase transaction costs
- Baxter scale: stronger negotiating position during normal supply
- Scarcity: episodic spikes boost supplier power
Medtech hit by supplier power; requalification 3-9 months; revenue $11.3B
Baxter faces elevated supplier bargaining power due to concentrated providers for sterilization, resins and specialty electronics, limited qualified vendors and regulatory revalidation costs; requalification typically 3–9 months and audits 6–12 months. Scale gives negotiating leverage, but 2024 resin/sterilization constraints and episodic shortages sustain supplier pricing and allocation power despite Baxter’s 2023 revenue of $11.3B.
| Metric | Value | Note |
|---|---|---|
| 2023 revenue | $11.3B | Company reported |
| Requalification time | 3–9 months | Typical industry timelines |
| Audit/qualification | 6–12 months | GMP/ISO13485 |
| 2024 supply risk | Ongoing resin/sterilization constraints | Market observations 2024 |
What is included in the product
 Detailed Word Document
Uncovers key drivers of competition, supplier and buyer power, substitutes, entry barriers and industry rivalry tailored to Baxter International, highlighting disruptive threats and strategic levers that influence its pricing, profitability and market positioning.

 Customizable Excel Spreadsheet
A clear, one-sheet Porter’s Five Forces summary tailored to Baxter International—perfect for quick decision-making and ready to drop into pitch decks or boardroom slides.
Customers Bargaining Power

GPO and tender leverage
Hospitals and IDNs largely procure Baxter products via GPOs and national tenders, with GPOs covering roughly 75–90% of U.S. hospital purchasing and tenders often spanning 3–5 year cycles. Aggregated volumes from these channels enable double-digit discounts and rebate structures, pressuring list prices. Multi-year, winner-take-most awards concentrate spend with single suppliers, magnifying buyer leverage and compressing margins across Baxter’s product portfolio.
Dialysis chain concentration
Large dialysis chains centralize purchasing and set technical standards, with Fresenius and DaVita accounting for about 63% of US in‑center dialysis capacity in 2024, allowing them to play vendors against each other on machines and disposables. They extract service-level and compliance concessions, often winning double-digit price discounts; this buyer concentration intensifies price pressure on suppliers like Baxter.

High switching costs
High switching costs stem from integrated drug-device combinations and EMR-integrated pumps that create lock-in; Baxter reported $11.6 billion revenue in 2024, reflecting deep hospital penetration. Clinician training and patient-safety protocols—often months of retraining—deter rapid change. Buyers weigh risk of transition failures and clinical disruption, which dampens their pricing leverage despite attempts to push on cost.

Reimbursement constraints
Fixed DRGs and bundled payments cap hospital reimbursements, squeezing provider budgets and forcing suppliers like Baxter to accept tighter margins; value-based contracts covered about 40% of US healthcare payments in 2024, increasing pressure on list pricing. Buyers now demand total cost of ownership cuts and outcome-linked terms while demand remains steady but highly price-sensitive. Macro economic pressure and tighter provider margins strengthen buyer bargaining power.
- DRG/bundles limit reimbursements
- ~40% value-based coverage (2024)
- Buyers push TCO and outcome pricing
- Steady demand, higher price sensitivity
Quality and continuity needs
Baxter's mission-critical therapies demand assured supply, rapid service and recall responsiveness, and buyers reward firms with strong regulatory track records; Baxter reported 2024 revenue of $11.6 billion, underscoring scale and supply presence. This reliability supports preferred-vendor status and drives customers to keep multi-source safeguards, while dependence on continuity partially offsets buyer bargaining power.
Buyers: GPOs75-90%, dial~63%, VBP~40%
Buyers wield strong leverage: GPOs cover 75–90% of U.S. hospital purchasing and national tenders create winner-take-most discounts that compress Baxter's margins. Dialysis chains (Fresenius+DaVita ~63% of US in‑center capacity in 2024) extract double-digit concessions. High switching costs and Baxter's $11.6B 2024 revenue limit exits, but ~40% value-based payments raise price sensitivity.
| Metric | 2024 |
|---|---|
| GPO coverage | 75–90% |
| Dialysis share (F+D) | ~63% |
| Value-based payments | ~40% |
| Baxter revenue | $11.6B |
Preview Before You Purchase
Baxter International Porter's Five Forces Analysis
This preview shows the exact Porter’s Five Forces analysis of Baxter International you'll receive—fully formatted, complete and ready to use. It assesses competitive rivalry, threat of new entrants, buyer and supplier power, and substitutes with actionable insights. No placeholders or samples; purchase grants instant access to this identical file.

Elevate Your Analysis with the Complete Porter's Five Forces Analysis
Baxter International faces intense regulatory scrutiny, differentiated product layers, and varied supplier and buyer power that shape pricing and margins; substitutes and emerging entrants add strategic pressure on its clinical portfolio. This brief snapshot only scratches the surface. Unlock the full Porter's Five Forces Analysis to explore Baxter International’s competitive dynamics, market pressures, and strategic advantages in detail.
Suppliers Bargaining Power
Sterile inputs concentration
Many critical inputs—medical-grade resins, IV bags, tubing, filters and EtO/gamma sterilization—are sourced from a concentrated supplier base, and limited commercial sterilization capacity plus heavy regulatory scrutiny elevate dependency and allocation risk. This concentration can force higher input prices or supply constraints. Baxter mitigates through dual-sourcing and long-term contracts but cannot fully diversify away the systemic supplier concentration risk.
Specialized components
Infusion pumps and dialysis systems depend on specialized electronics, sensors and embedded software, and only a limited pool of vendors meet medical-grade quality and traceability standards. Supplier changes frequently trigger revalidation and may require FDA 510(k) submissions or PMA supplements under 21 CFR 820, raising time and compliance costs. These regulatory and technical barriers increase switching costs and grant niche suppliers significant leverage.
Regulatory-grade quality
Regulatory-grade suppliers must meet GMP, ISO 13485 and sterilization standards, which shrinks the qualified pool and heightens bargaining power. Noncompliance risks recalls and supply interruptions that threaten Baxter’s revenue base (2023 revenue $11.3B), increasing reliance on proven partners. Auditing and qualification timelines often run 6–12 months, reinforcing supplier leverage.
Commodity vs. custom mix
While some inputs for Baxter are commodity-based, many disposables are custom tooled to Baxter’s proprietary specs; tooling, molds and unique formulations create high switching costs and supplier lock-in. Requalification of alternate suppliers often requires 3–9 months and can delay production, shifting bargaining power toward suppliers with exclusive capabilities and IP.
- custom tooling: increases lock-in
- requalification: 3–9 months
- proprietary specs: supplier leverage
Logistics and scarcity shocks
Global freight volatility and periodic resin/solvent shortages continued into 2024, constraining Baxter’s input flows; healthcare allocation eases access but emergency allocation still limits volumes during shocks. Suppliers can impose surcharges or minimum order quantities, and Baxter’s scale improves negotiation leverage, yet scarcity raises supplier bargaining power cyclically.
- 2024: healthcare prioritization mitigates but does not eliminate allocation
- Suppliers: surcharges and minimums increase transaction costs
- Baxter scale: stronger negotiating position during normal supply
- Scarcity: episodic spikes boost supplier power
Medtech hit by supplier power; requalification 3-9 months; revenue $11.3B
Baxter faces elevated supplier bargaining power due to concentrated providers for sterilization, resins and specialty electronics, limited qualified vendors and regulatory revalidation costs; requalification typically 3–9 months and audits 6–12 months. Scale gives negotiating leverage, but 2024 resin/sterilization constraints and episodic shortages sustain supplier pricing and allocation power despite Baxter’s 2023 revenue of $11.3B.
| Metric | Value | Note |
|---|---|---|
| 2023 revenue | $11.3B | Company reported |
| Requalification time | 3–9 months | Typical industry timelines |
| Audit/qualification | 6–12 months | GMP/ISO13485 |
| 2024 supply risk | Ongoing resin/sterilization constraints | Market observations 2024 |
What is included in the product
Detailed Word Document
Uncovers key drivers of competition, supplier and buyer power, substitutes, entry barriers and industry rivalry tailored to Baxter International, highlighting disruptive threats and strategic levers that influence its pricing, profitability and market positioning.
Customizable Excel Spreadsheet
A clear, one-sheet Porter’s Five Forces summary tailored to Baxter International—perfect for quick decision-making and ready to drop into pitch decks or boardroom slides.
Customers Bargaining Power
GPO and tender leverage
Hospitals and IDNs largely procure Baxter products via GPOs and national tenders, with GPOs covering roughly 75–90% of U.S. hospital purchasing and tenders often spanning 3–5 year cycles. Aggregated volumes from these channels enable double-digit discounts and rebate structures, pressuring list prices. Multi-year, winner-take-most awards concentrate spend with single suppliers, magnifying buyer leverage and compressing margins across Baxter’s product portfolio.
Dialysis chain concentration
Large dialysis chains centralize purchasing and set technical standards, with Fresenius and DaVita accounting for about 63% of US in‑center dialysis capacity in 2024, allowing them to play vendors against each other on machines and disposables. They extract service-level and compliance concessions, often winning double-digit price discounts; this buyer concentration intensifies price pressure on suppliers like Baxter.
High switching costs
High switching costs stem from integrated drug-device combinations and EMR-integrated pumps that create lock-in; Baxter reported $11.6 billion revenue in 2024, reflecting deep hospital penetration. Clinician training and patient-safety protocols—often months of retraining—deter rapid change. Buyers weigh risk of transition failures and clinical disruption, which dampens their pricing leverage despite attempts to push on cost.
Reimbursement constraints
Fixed DRGs and bundled payments cap hospital reimbursements, squeezing provider budgets and forcing suppliers like Baxter to accept tighter margins; value-based contracts covered about 40% of US healthcare payments in 2024, increasing pressure on list pricing. Buyers now demand total cost of ownership cuts and outcome-linked terms while demand remains steady but highly price-sensitive. Macro economic pressure and tighter provider margins strengthen buyer bargaining power.
- DRG/bundles limit reimbursements
- ~40% value-based coverage (2024)
- Buyers push TCO and outcome pricing
- Steady demand, higher price sensitivity
Quality and continuity needs
Baxter's mission-critical therapies demand assured supply, rapid service and recall responsiveness, and buyers reward firms with strong regulatory track records; Baxter reported 2024 revenue of $11.6 billion, underscoring scale and supply presence. This reliability supports preferred-vendor status and drives customers to keep multi-source safeguards, while dependence on continuity partially offsets buyer bargaining power.
Buyers: GPOs75-90%, dial~63%, VBP~40%
Buyers wield strong leverage: GPOs cover 75–90% of U.S. hospital purchasing and national tenders create winner-take-most discounts that compress Baxter's margins. Dialysis chains (Fresenius+DaVita ~63% of US in‑center capacity in 2024) extract double-digit concessions. High switching costs and Baxter's $11.6B 2024 revenue limit exits, but ~40% value-based payments raise price sensitivity.
| Metric | 2024 |
|---|---|
| GPO coverage | 75–90% |
| Dialysis share (F+D) | ~63% |
| Value-based payments | ~40% |
| Baxter revenue | $11.6B |
Preview Before You Purchase
Baxter International Porter's Five Forces Analysis
This preview shows the exact Porter’s Five Forces analysis of Baxter International you'll receive—fully formatted, complete and ready to use. It assesses competitive rivalry, threat of new entrants, buyer and supplier power, and substitutes with actionable insights. No placeholders or samples; purchase grants instant access to this identical file.
Description
Elevate Your Analysis with the Complete Porter's Five Forces Analysis
Baxter International faces intense regulatory scrutiny, differentiated product layers, and varied supplier and buyer power that shape pricing and margins; substitutes and emerging entrants add strategic pressure on its clinical portfolio. This brief snapshot only scratches the surface. Unlock the full Porter's Five Forces Analysis to explore Baxter International’s competitive dynamics, market pressures, and strategic advantages in detail.
Suppliers Bargaining Power
Sterile inputs concentration
Many critical inputs—medical-grade resins, IV bags, tubing, filters and EtO/gamma sterilization—are sourced from a concentrated supplier base, and limited commercial sterilization capacity plus heavy regulatory scrutiny elevate dependency and allocation risk. This concentration can force higher input prices or supply constraints. Baxter mitigates through dual-sourcing and long-term contracts but cannot fully diversify away the systemic supplier concentration risk.
Specialized components
Infusion pumps and dialysis systems depend on specialized electronics, sensors and embedded software, and only a limited pool of vendors meet medical-grade quality and traceability standards. Supplier changes frequently trigger revalidation and may require FDA 510(k) submissions or PMA supplements under 21 CFR 820, raising time and compliance costs. These regulatory and technical barriers increase switching costs and grant niche suppliers significant leverage.
Regulatory-grade quality
Regulatory-grade suppliers must meet GMP, ISO 13485 and sterilization standards, which shrinks the qualified pool and heightens bargaining power. Noncompliance risks recalls and supply interruptions that threaten Baxter’s revenue base (2023 revenue $11.3B), increasing reliance on proven partners. Auditing and qualification timelines often run 6–12 months, reinforcing supplier leverage.
Commodity vs. custom mix
While some inputs for Baxter are commodity-based, many disposables are custom tooled to Baxter’s proprietary specs; tooling, molds and unique formulations create high switching costs and supplier lock-in. Requalification of alternate suppliers often requires 3–9 months and can delay production, shifting bargaining power toward suppliers with exclusive capabilities and IP.
- custom tooling: increases lock-in
- requalification: 3–9 months
- proprietary specs: supplier leverage
Logistics and scarcity shocks
Global freight volatility and periodic resin/solvent shortages continued into 2024, constraining Baxter’s input flows; healthcare allocation eases access but emergency allocation still limits volumes during shocks. Suppliers can impose surcharges or minimum order quantities, and Baxter’s scale improves negotiation leverage, yet scarcity raises supplier bargaining power cyclically.
- 2024: healthcare prioritization mitigates but does not eliminate allocation
- Suppliers: surcharges and minimums increase transaction costs
- Baxter scale: stronger negotiating position during normal supply
- Scarcity: episodic spikes boost supplier power
Medtech hit by supplier power; requalification 3-9 months; revenue $11.3B
Baxter faces elevated supplier bargaining power due to concentrated providers for sterilization, resins and specialty electronics, limited qualified vendors and regulatory revalidation costs; requalification typically 3–9 months and audits 6–12 months. Scale gives negotiating leverage, but 2024 resin/sterilization constraints and episodic shortages sustain supplier pricing and allocation power despite Baxter’s 2023 revenue of $11.3B.
| Metric | Value | Note |
|---|---|---|
| 2023 revenue | $11.3B | Company reported |
| Requalification time | 3–9 months | Typical industry timelines |
| Audit/qualification | 6–12 months | GMP/ISO13485 |
| 2024 supply risk | Ongoing resin/sterilization constraints | Market observations 2024 |
What is included in the product
Detailed Word Document
Uncovers key drivers of competition, supplier and buyer power, substitutes, entry barriers and industry rivalry tailored to Baxter International, highlighting disruptive threats and strategic levers that influence its pricing, profitability and market positioning.
Customizable Excel Spreadsheet
A clear, one-sheet Porter’s Five Forces summary tailored to Baxter International—perfect for quick decision-making and ready to drop into pitch decks or boardroom slides.
Customers Bargaining Power
GPO and tender leverage
Hospitals and IDNs largely procure Baxter products via GPOs and national tenders, with GPOs covering roughly 75–90% of U.S. hospital purchasing and tenders often spanning 3–5 year cycles. Aggregated volumes from these channels enable double-digit discounts and rebate structures, pressuring list prices. Multi-year, winner-take-most awards concentrate spend with single suppliers, magnifying buyer leverage and compressing margins across Baxter’s product portfolio.
Dialysis chain concentration
Large dialysis chains centralize purchasing and set technical standards, with Fresenius and DaVita accounting for about 63% of US in‑center dialysis capacity in 2024, allowing them to play vendors against each other on machines and disposables. They extract service-level and compliance concessions, often winning double-digit price discounts; this buyer concentration intensifies price pressure on suppliers like Baxter.
High switching costs
High switching costs stem from integrated drug-device combinations and EMR-integrated pumps that create lock-in; Baxter reported $11.6 billion revenue in 2024, reflecting deep hospital penetration. Clinician training and patient-safety protocols—often months of retraining—deter rapid change. Buyers weigh risk of transition failures and clinical disruption, which dampens their pricing leverage despite attempts to push on cost.
Reimbursement constraints
Fixed DRGs and bundled payments cap hospital reimbursements, squeezing provider budgets and forcing suppliers like Baxter to accept tighter margins; value-based contracts covered about 40% of US healthcare payments in 2024, increasing pressure on list pricing. Buyers now demand total cost of ownership cuts and outcome-linked terms while demand remains steady but highly price-sensitive. Macro economic pressure and tighter provider margins strengthen buyer bargaining power.
- DRG/bundles limit reimbursements
- ~40% value-based coverage (2024)
- Buyers push TCO and outcome pricing
- Steady demand, higher price sensitivity
Quality and continuity needs
Baxter's mission-critical therapies demand assured supply, rapid service and recall responsiveness, and buyers reward firms with strong regulatory track records; Baxter reported 2024 revenue of $11.6 billion, underscoring scale and supply presence. This reliability supports preferred-vendor status and drives customers to keep multi-source safeguards, while dependence on continuity partially offsets buyer bargaining power.
Buyers: GPOs75-90%, dial~63%, VBP~40%
Buyers wield strong leverage: GPOs cover 75–90% of U.S. hospital purchasing and national tenders create winner-take-most discounts that compress Baxter's margins. Dialysis chains (Fresenius+DaVita ~63% of US in‑center capacity in 2024) extract double-digit concessions. High switching costs and Baxter's $11.6B 2024 revenue limit exits, but ~40% value-based payments raise price sensitivity.
| Metric | 2024 |
|---|---|
| GPO coverage | 75–90% |
| Dialysis share (F+D) | ~63% |
| Value-based payments | ~40% |
| Baxter revenue | $11.6B |
Preview Before You Purchase
Baxter International Porter's Five Forces Analysis
This preview shows the exact Porter’s Five Forces analysis of Baxter International you'll receive—fully formatted, complete and ready to use. It assesses competitive rivalry, threat of new entrants, buyer and supplier power, and substitutes with actionable insights. No placeholders or samples; purchase grants instant access to this identical file.











