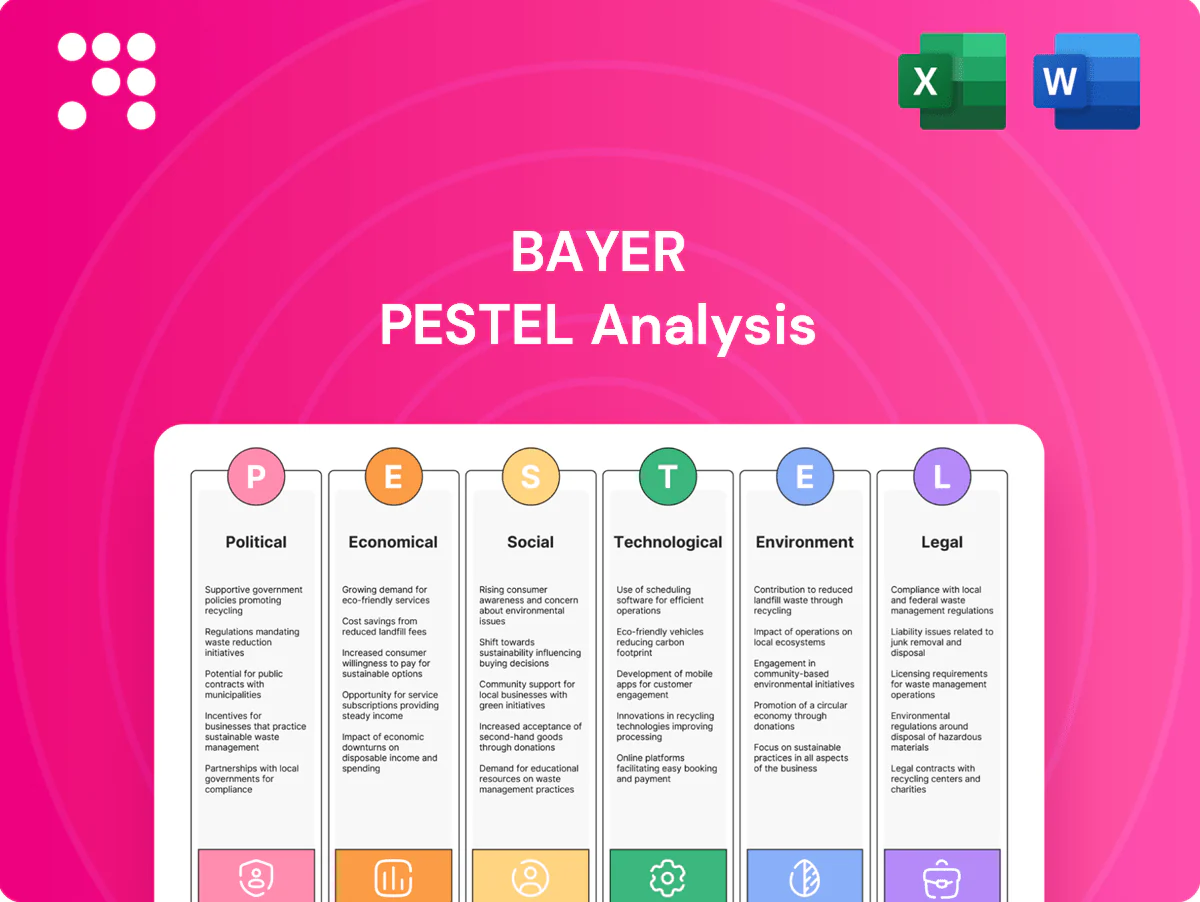
Bayer PESTLE Analysis

Plan Smarter. Present Sharper. Compete Stronger.
Unlock how political shifts, regulatory pressure, economic cycles and technological change are shaping Bayer’s strategic path in our concise PESTLE snapshot—perfect for investors and strategists seeking an edge. This expert analysis highlights risks and opportunities you can act on today; buy the full PESTLE to get the complete, editable report instantly.
Political factors

Drug pricing reforms
US cost-containment from the Inflation Reduction Act (Medicare price negotiation beginning 2026) and EU HTA regulation effective January 2025 compress pharma margins; the CBO estimated IRA savings at about 98 billion USD over 2022–2031. HTA bodies like NICE maintain value thresholds around 20,000–30,000 GBP per QALY, tightening market access. Bayer must manage reference pricing and cyclic negotiations across emerging markets, where policy shifts can delay launches and shorten lifecycle revenues.
Agri-policy and GMO stance
EU Green Deal Farm to Fork targets a 50% reduction in chemical pesticide use by 2030, pressuring Bayer to accelerate low-input solutions. GMO and gene-edited crop approvals differ sharply—EU remains restrictive while the US, Brazil and Argentina are permissive, affecting market access across over 60 countries. Bayer’s seed and trait launches face staggered regulatory timelines and commercial delays. Aligning with regenerative farming incentives is critical to protect revenue and margins.

Trade and supply-chain geopolitics
Tariffs, export controls and sanctions have increasingly disrupted APIs and crop inputs, with China supplying an estimated 40% of global APIs and WTO average applied tariffs near 3.3% adding cost volatility; export restrictions since 2022 have tightened flows. A strong localization push—about 60% of manufacturers citing regionalization plans in 2024 surveys—encourages regional manufacturing footprints. Political instability in key raw-material regions (Russia/Belarus still supply ~30% of global potash) raises logistics and price risk, making diversification and dual-sourcing policy-sensitive and cost-impactful decisions.

Public procurement and HTA influence
National formularies and tendering increasingly determine volume and price, while from 2025 the EU HTA Regulation introduces mandatory joint clinical assessments that reshape evidence strategies. HTA agencies' standards now drive clinical development planning and endpoint selection, and regulators and payers are demanding more real-world data to demonstrate effectiveness. Aligning outcomes-based contracts with payers can secure market access.
- EU HTA Regulation (joint assessments) effective 2025
- HTA-driven endpoints shape trials
- RWD requirements rising
- Outcomes contracts improve access
Subsidies and farmer support programs
- CAP 2023–27: €387bn
- Favours biologicals & precision tools
- Subsidy design can boost Bayer digital uptake
- Risk: reallocation from conventional chemistries
US IRA, EU HTA and Farm to Fork drive pharma margin squeeze and supply regionalization
US IRA Medicare price negotiation starts 2026 (CBO estimated savings USD 98bn 2022–31) compressing pharma margins; EU HTA Regulation mandatory joint assessments from Jan 2025 reshape market access. Farm to Fork aims 50% pesticide reduction by 2030 and CAP 2023–27 budgets €387bn, favoring biologicals and digital farming. Supply risks: China ~40% of APIs, Russia/Belarus ~30% potash; 2024 survey ~60% firms pursuing regionalization.
| Factor | Key datapoint | Impact |
|---|---|---|
| US IRA | USD 98bn savings (2022–31) | Price pressure |
| EU HTA | Joint assessments from 2025 | Evidence-driven access |
| Farm to Fork / CAP | 50% reduction by 2030; €387bn | Shifts to biologicals |
| Supply concentration | China APIs ~40%; potash ~30% | Regionalize sourcing |
What is included in the product
 Detailed Word Document
Explores how Political, Economic, Social, Technological, Environmental and Legal forces uniquely affect Bayer, with data-backed trends and industry-specific examples; designed to help executives, investors and strategists identify risks, opportunities and forward-looking scenarios for decision-making.

 Customizable Excel Spreadsheet
A concise, visually segmented Bayer PESTLE summary that can be dropped into presentations, shared for quick team alignment, and annotated with region- or business-line notes to streamline risk discussions and strategic planning.
Economic factors

Currency and macro volatility
Bayer’s global revenue mix exposes results to EUR, USD, BRL and CNY swings, with EUR/USD averaging about 1.08 in 2024 which amplified translation effects.
FX volatility has compressed reported top-line growth and raised input costs despite hedging programs that reduce but do not eliminate short-term swings.
Emerging-market slowdowns — IMF 2024 growth ~5.2% for China and ~3.0% for Brazil — risk denting Consumer Health and Crop Science volumes.
Inflation and input costs
Energy, solvents and intermediates are major COGS drivers for Bayer’s pharma and crop‑protection businesses, and volatility since 2022 has forced raw‑material sensitivity into margins; Bayer reported R&D spend of about €4.9bn in 2024 while SG&A remained near €7bn, exposing wage inflation pressures. Pricing power varies by segment and geography, so efficiency and targeted procurement programs are required to protect margins.

R&D productivity and patent cycles
Bayer's long-term growth hinges on pipeline success; R&D investment rose to about €4.5bn in 2024 to boost productivity and late-stage assets.
Patent expiries through 2024–26 expose key products to generic and biosimilar erosion, risking several hundred million euros of annual sales.
Capital allocation across Pharma, Consumer Health and Crop Science must balance risk and return, while partnering and M&A bridge pipeline and capability gaps.

Farmer income and commodity prices
Soft commodity cycles compress farmer purchasing power; after 2022 peaks the FAO Food Price Index eased to roughly 120 in 2024, reducing immediate cash for inputs.
High crop prices historically lift uptake of premium seeds and traits, while droughts or bumper harvests shift timing of purchases and inventory buildup.
Higher borrowing costs (US fed funds ~5.25–5.5% in 2024–25) tighten dealer and farmer financing, constraining demand.
- commodity-index: FAO ~120 (2024)
- interest-rate: US fed ~5.25–5.5% (2024–25)
- demand-timing: weather-driven
- premium-adoption: linked to crop-price spikes
Capital markets and leverage
Rising interest rates (ECB policy rate around 4% in mid‑2025) increase Bayer’s refinancing costs and limit new investment, while litigation reserves and ongoing restructuring programs continue to tie up cash and reduce strategic flexibility; equity market sentiment affects valuation and M&A optionality, making disciplined cash generation critical for deleveraging given net financial debt roughly €30bn in 2024.
- Interest rate pressure: ECB ≈4% (mid‑2025)
- Net debt: ≈€30bn (2024)
- Cash focus: essential for deleveraging and deal optionality
US IRA, EU HTA and Farm to Fork drive pharma margin squeeze and supply regionalization
Bayer’s earnings remain FX‑sensitive (EUR/USD ~1.08 in 2024) and exposed to commodity and energy swings that pressure COGS and margins. Emerging‑market slowdowns (China growth ~5.2% 2024; Brazil ~3.0% 2024) and softer soft‑commodity prices (FAO ~120 2024) weigh on volumes. Higher rates (US fed 5.25–5.5% 2024–25; ECB ≈4% mid‑2025) and net debt ≈€30bn (2024) constrain investment and M&A.
| Metric | Value |
|---|---|
| EUR/USD | ~1.08 (2024) |
| FAO Food Price Index | ~120 (2024) |
| US fed funds | 5.25–5.5% (2024–25) |
| ECB policy | ≈4% (mid‑2025) |
| Net debt | ≈€30bn (2024) |
| R&D spend | ≈€4.9bn (2024) |
Same Document Delivered
Bayer PESTLE Analysis
The Bayer PESTLE Analysis shown here is the exact document you’ll receive after purchase—fully formatted and ready to use. It covers political, economic, social, technological, legal and environmental factors specific to Bayer. No placeholders or teasers—this is the final, professionally structured file you’ll download immediately after payment.

Plan Smarter. Present Sharper. Compete Stronger.
Unlock how political shifts, regulatory pressure, economic cycles and technological change are shaping Bayer’s strategic path in our concise PESTLE snapshot—perfect for investors and strategists seeking an edge. This expert analysis highlights risks and opportunities you can act on today; buy the full PESTLE to get the complete, editable report instantly.
Political factors
Drug pricing reforms
US cost-containment from the Inflation Reduction Act (Medicare price negotiation beginning 2026) and EU HTA regulation effective January 2025 compress pharma margins; the CBO estimated IRA savings at about 98 billion USD over 2022–2031. HTA bodies like NICE maintain value thresholds around 20,000–30,000 GBP per QALY, tightening market access. Bayer must manage reference pricing and cyclic negotiations across emerging markets, where policy shifts can delay launches and shorten lifecycle revenues.
Agri-policy and GMO stance
EU Green Deal Farm to Fork targets a 50% reduction in chemical pesticide use by 2030, pressuring Bayer to accelerate low-input solutions. GMO and gene-edited crop approvals differ sharply—EU remains restrictive while the US, Brazil and Argentina are permissive, affecting market access across over 60 countries. Bayer’s seed and trait launches face staggered regulatory timelines and commercial delays. Aligning with regenerative farming incentives is critical to protect revenue and margins.
Trade and supply-chain geopolitics
Tariffs, export controls and sanctions have increasingly disrupted APIs and crop inputs, with China supplying an estimated 40% of global APIs and WTO average applied tariffs near 3.3% adding cost volatility; export restrictions since 2022 have tightened flows. A strong localization push—about 60% of manufacturers citing regionalization plans in 2024 surveys—encourages regional manufacturing footprints. Political instability in key raw-material regions (Russia/Belarus still supply ~30% of global potash) raises logistics and price risk, making diversification and dual-sourcing policy-sensitive and cost-impactful decisions.
Public procurement and HTA influence
National formularies and tendering increasingly determine volume and price, while from 2025 the EU HTA Regulation introduces mandatory joint clinical assessments that reshape evidence strategies. HTA agencies' standards now drive clinical development planning and endpoint selection, and regulators and payers are demanding more real-world data to demonstrate effectiveness. Aligning outcomes-based contracts with payers can secure market access.
- EU HTA Regulation (joint assessments) effective 2025
- HTA-driven endpoints shape trials
- RWD requirements rising
- Outcomes contracts improve access
Subsidies and farmer support programs
- CAP 2023–27: €387bn
- Favours biologicals & precision tools
- Subsidy design can boost Bayer digital uptake
- Risk: reallocation from conventional chemistries
US IRA, EU HTA and Farm to Fork drive pharma margin squeeze and supply regionalization
US IRA Medicare price negotiation starts 2026 (CBO estimated savings USD 98bn 2022–31) compressing pharma margins; EU HTA Regulation mandatory joint assessments from Jan 2025 reshape market access. Farm to Fork aims 50% pesticide reduction by 2030 and CAP 2023–27 budgets €387bn, favoring biologicals and digital farming. Supply risks: China ~40% of APIs, Russia/Belarus ~30% potash; 2024 survey ~60% firms pursuing regionalization.
| Factor | Key datapoint | Impact |
|---|---|---|
| US IRA | USD 98bn savings (2022–31) | Price pressure |
| EU HTA | Joint assessments from 2025 | Evidence-driven access |
| Farm to Fork / CAP | 50% reduction by 2030; €387bn | Shifts to biologicals |
| Supply concentration | China APIs ~40%; potash ~30% | Regionalize sourcing |
What is included in the product
Detailed Word Document
Explores how Political, Economic, Social, Technological, Environmental and Legal forces uniquely affect Bayer, with data-backed trends and industry-specific examples; designed to help executives, investors and strategists identify risks, opportunities and forward-looking scenarios for decision-making.
Customizable Excel Spreadsheet
A concise, visually segmented Bayer PESTLE summary that can be dropped into presentations, shared for quick team alignment, and annotated with region- or business-line notes to streamline risk discussions and strategic planning.
Economic factors
Currency and macro volatility
Bayer’s global revenue mix exposes results to EUR, USD, BRL and CNY swings, with EUR/USD averaging about 1.08 in 2024 which amplified translation effects.
FX volatility has compressed reported top-line growth and raised input costs despite hedging programs that reduce but do not eliminate short-term swings.
Emerging-market slowdowns — IMF 2024 growth ~5.2% for China and ~3.0% for Brazil — risk denting Consumer Health and Crop Science volumes.
Inflation and input costs
Energy, solvents and intermediates are major COGS drivers for Bayer’s pharma and crop‑protection businesses, and volatility since 2022 has forced raw‑material sensitivity into margins; Bayer reported R&D spend of about €4.9bn in 2024 while SG&A remained near €7bn, exposing wage inflation pressures. Pricing power varies by segment and geography, so efficiency and targeted procurement programs are required to protect margins.
R&D productivity and patent cycles
Bayer's long-term growth hinges on pipeline success; R&D investment rose to about €4.5bn in 2024 to boost productivity and late-stage assets.
Patent expiries through 2024–26 expose key products to generic and biosimilar erosion, risking several hundred million euros of annual sales.
Capital allocation across Pharma, Consumer Health and Crop Science must balance risk and return, while partnering and M&A bridge pipeline and capability gaps.
Farmer income and commodity prices
Soft commodity cycles compress farmer purchasing power; after 2022 peaks the FAO Food Price Index eased to roughly 120 in 2024, reducing immediate cash for inputs.
High crop prices historically lift uptake of premium seeds and traits, while droughts or bumper harvests shift timing of purchases and inventory buildup.
Higher borrowing costs (US fed funds ~5.25–5.5% in 2024–25) tighten dealer and farmer financing, constraining demand.
- commodity-index: FAO ~120 (2024)
- interest-rate: US fed ~5.25–5.5% (2024–25)
- demand-timing: weather-driven
- premium-adoption: linked to crop-price spikes
Capital markets and leverage
Rising interest rates (ECB policy rate around 4% in mid‑2025) increase Bayer’s refinancing costs and limit new investment, while litigation reserves and ongoing restructuring programs continue to tie up cash and reduce strategic flexibility; equity market sentiment affects valuation and M&A optionality, making disciplined cash generation critical for deleveraging given net financial debt roughly €30bn in 2024.
- Interest rate pressure: ECB ≈4% (mid‑2025)
- Net debt: ≈€30bn (2024)
- Cash focus: essential for deleveraging and deal optionality
US IRA, EU HTA and Farm to Fork drive pharma margin squeeze and supply regionalization
Bayer’s earnings remain FX‑sensitive (EUR/USD ~1.08 in 2024) and exposed to commodity and energy swings that pressure COGS and margins. Emerging‑market slowdowns (China growth ~5.2% 2024; Brazil ~3.0% 2024) and softer soft‑commodity prices (FAO ~120 2024) weigh on volumes. Higher rates (US fed 5.25–5.5% 2024–25; ECB ≈4% mid‑2025) and net debt ≈€30bn (2024) constrain investment and M&A.
| Metric | Value |
|---|---|
| EUR/USD | ~1.08 (2024) |
| FAO Food Price Index | ~120 (2024) |
| US fed funds | 5.25–5.5% (2024–25) |
| ECB policy | ≈4% (mid‑2025) |
| Net debt | ≈€30bn (2024) |
| R&D spend | ≈€4.9bn (2024) |
Same Document Delivered
Bayer PESTLE Analysis
The Bayer PESTLE Analysis shown here is the exact document you’ll receive after purchase—fully formatted and ready to use. It covers political, economic, social, technological, legal and environmental factors specific to Bayer. No placeholders or teasers—this is the final, professionally structured file you’ll download immediately after payment.
Original: $10.00
-65%$10.00
$3.50Description
Plan Smarter. Present Sharper. Compete Stronger.
Unlock how political shifts, regulatory pressure, economic cycles and technological change are shaping Bayer’s strategic path in our concise PESTLE snapshot—perfect for investors and strategists seeking an edge. This expert analysis highlights risks and opportunities you can act on today; buy the full PESTLE to get the complete, editable report instantly.
Political factors
Drug pricing reforms
US cost-containment from the Inflation Reduction Act (Medicare price negotiation beginning 2026) and EU HTA regulation effective January 2025 compress pharma margins; the CBO estimated IRA savings at about 98 billion USD over 2022–2031. HTA bodies like NICE maintain value thresholds around 20,000–30,000 GBP per QALY, tightening market access. Bayer must manage reference pricing and cyclic negotiations across emerging markets, where policy shifts can delay launches and shorten lifecycle revenues.
Agri-policy and GMO stance
EU Green Deal Farm to Fork targets a 50% reduction in chemical pesticide use by 2030, pressuring Bayer to accelerate low-input solutions. GMO and gene-edited crop approvals differ sharply—EU remains restrictive while the US, Brazil and Argentina are permissive, affecting market access across over 60 countries. Bayer’s seed and trait launches face staggered regulatory timelines and commercial delays. Aligning with regenerative farming incentives is critical to protect revenue and margins.
Trade and supply-chain geopolitics
Tariffs, export controls and sanctions have increasingly disrupted APIs and crop inputs, with China supplying an estimated 40% of global APIs and WTO average applied tariffs near 3.3% adding cost volatility; export restrictions since 2022 have tightened flows. A strong localization push—about 60% of manufacturers citing regionalization plans in 2024 surveys—encourages regional manufacturing footprints. Political instability in key raw-material regions (Russia/Belarus still supply ~30% of global potash) raises logistics and price risk, making diversification and dual-sourcing policy-sensitive and cost-impactful decisions.
Public procurement and HTA influence
National formularies and tendering increasingly determine volume and price, while from 2025 the EU HTA Regulation introduces mandatory joint clinical assessments that reshape evidence strategies. HTA agencies' standards now drive clinical development planning and endpoint selection, and regulators and payers are demanding more real-world data to demonstrate effectiveness. Aligning outcomes-based contracts with payers can secure market access.
- EU HTA Regulation (joint assessments) effective 2025
- HTA-driven endpoints shape trials
- RWD requirements rising
- Outcomes contracts improve access
Subsidies and farmer support programs
- CAP 2023–27: €387bn
- Favours biologicals & precision tools
- Subsidy design can boost Bayer digital uptake
- Risk: reallocation from conventional chemistries
US IRA, EU HTA and Farm to Fork drive pharma margin squeeze and supply regionalization
US IRA Medicare price negotiation starts 2026 (CBO estimated savings USD 98bn 2022–31) compressing pharma margins; EU HTA Regulation mandatory joint assessments from Jan 2025 reshape market access. Farm to Fork aims 50% pesticide reduction by 2030 and CAP 2023–27 budgets €387bn, favoring biologicals and digital farming. Supply risks: China ~40% of APIs, Russia/Belarus ~30% potash; 2024 survey ~60% firms pursuing regionalization.
| Factor | Key datapoint | Impact |
|---|---|---|
| US IRA | USD 98bn savings (2022–31) | Price pressure |
| EU HTA | Joint assessments from 2025 | Evidence-driven access |
| Farm to Fork / CAP | 50% reduction by 2030; €387bn | Shifts to biologicals |
| Supply concentration | China APIs ~40%; potash ~30% | Regionalize sourcing |
What is included in the product
Detailed Word Document
Explores how Political, Economic, Social, Technological, Environmental and Legal forces uniquely affect Bayer, with data-backed trends and industry-specific examples; designed to help executives, investors and strategists identify risks, opportunities and forward-looking scenarios for decision-making.
Customizable Excel Spreadsheet
A concise, visually segmented Bayer PESTLE summary that can be dropped into presentations, shared for quick team alignment, and annotated with region- or business-line notes to streamline risk discussions and strategic planning.
Economic factors
Currency and macro volatility
Bayer’s global revenue mix exposes results to EUR, USD, BRL and CNY swings, with EUR/USD averaging about 1.08 in 2024 which amplified translation effects.
FX volatility has compressed reported top-line growth and raised input costs despite hedging programs that reduce but do not eliminate short-term swings.
Emerging-market slowdowns — IMF 2024 growth ~5.2% for China and ~3.0% for Brazil — risk denting Consumer Health and Crop Science volumes.
Inflation and input costs
Energy, solvents and intermediates are major COGS drivers for Bayer’s pharma and crop‑protection businesses, and volatility since 2022 has forced raw‑material sensitivity into margins; Bayer reported R&D spend of about €4.9bn in 2024 while SG&A remained near €7bn, exposing wage inflation pressures. Pricing power varies by segment and geography, so efficiency and targeted procurement programs are required to protect margins.
R&D productivity and patent cycles
Bayer's long-term growth hinges on pipeline success; R&D investment rose to about €4.5bn in 2024 to boost productivity and late-stage assets.
Patent expiries through 2024–26 expose key products to generic and biosimilar erosion, risking several hundred million euros of annual sales.
Capital allocation across Pharma, Consumer Health and Crop Science must balance risk and return, while partnering and M&A bridge pipeline and capability gaps.
Farmer income and commodity prices
Soft commodity cycles compress farmer purchasing power; after 2022 peaks the FAO Food Price Index eased to roughly 120 in 2024, reducing immediate cash for inputs.
High crop prices historically lift uptake of premium seeds and traits, while droughts or bumper harvests shift timing of purchases and inventory buildup.
Higher borrowing costs (US fed funds ~5.25–5.5% in 2024–25) tighten dealer and farmer financing, constraining demand.
- commodity-index: FAO ~120 (2024)
- interest-rate: US fed ~5.25–5.5% (2024–25)
- demand-timing: weather-driven
- premium-adoption: linked to crop-price spikes
Capital markets and leverage
Rising interest rates (ECB policy rate around 4% in mid‑2025) increase Bayer’s refinancing costs and limit new investment, while litigation reserves and ongoing restructuring programs continue to tie up cash and reduce strategic flexibility; equity market sentiment affects valuation and M&A optionality, making disciplined cash generation critical for deleveraging given net financial debt roughly €30bn in 2024.
- Interest rate pressure: ECB ≈4% (mid‑2025)
- Net debt: ≈€30bn (2024)
- Cash focus: essential for deleveraging and deal optionality
US IRA, EU HTA and Farm to Fork drive pharma margin squeeze and supply regionalization
Bayer’s earnings remain FX‑sensitive (EUR/USD ~1.08 in 2024) and exposed to commodity and energy swings that pressure COGS and margins. Emerging‑market slowdowns (China growth ~5.2% 2024; Brazil ~3.0% 2024) and softer soft‑commodity prices (FAO ~120 2024) weigh on volumes. Higher rates (US fed 5.25–5.5% 2024–25; ECB ≈4% mid‑2025) and net debt ≈€30bn (2024) constrain investment and M&A.
| Metric | Value |
|---|---|
| EUR/USD | ~1.08 (2024) |
| FAO Food Price Index | ~120 (2024) |
| US fed funds | 5.25–5.5% (2024–25) |
| ECB policy | ≈4% (mid‑2025) |
| Net debt | ≈€30bn (2024) |
| R&D spend | ≈€4.9bn (2024) |
Same Document Delivered
Bayer PESTLE Analysis
The Bayer PESTLE Analysis shown here is the exact document you’ll receive after purchase—fully formatted and ready to use. It covers political, economic, social, technological, legal and environmental factors specific to Bayer. No placeholders or teasers—this is the final, professionally structured file you’ll download immediately after payment.











