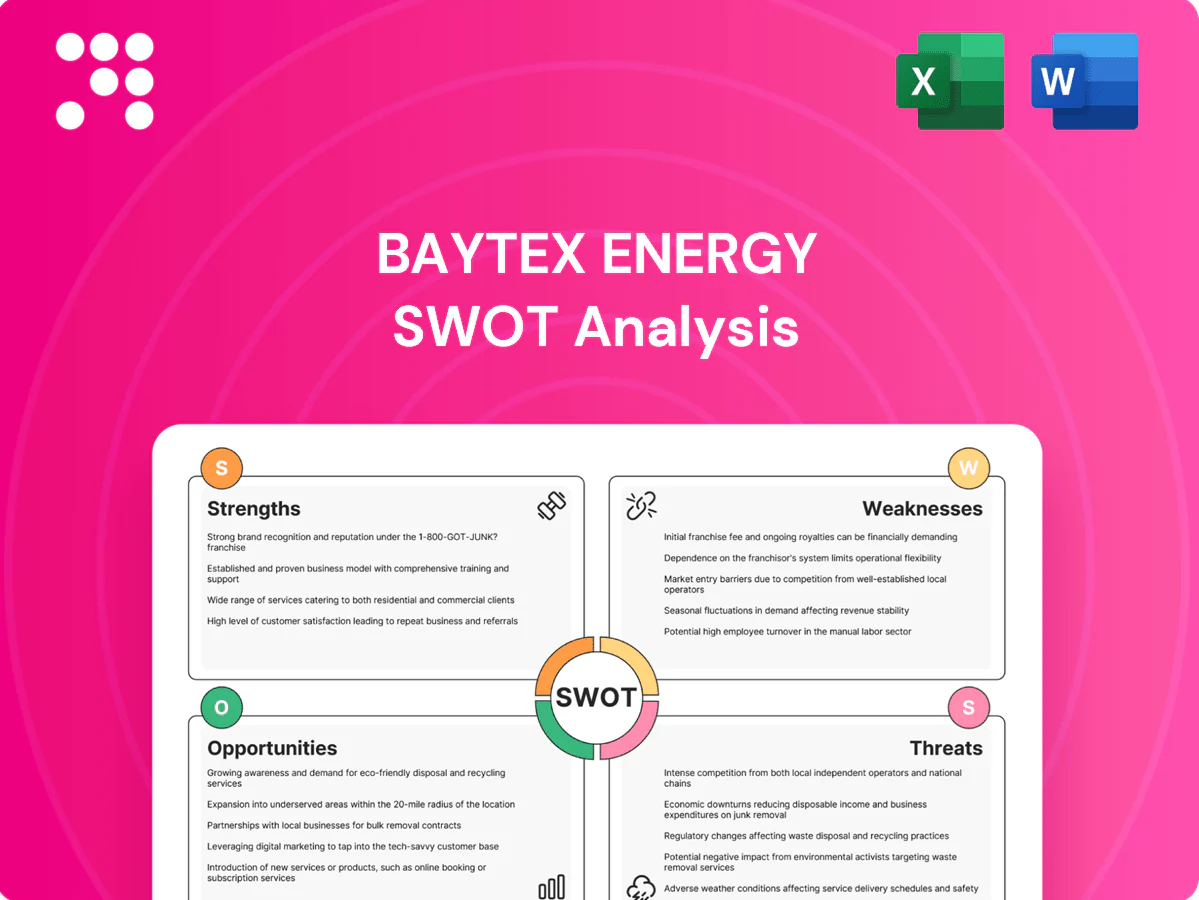
Baytex Energy SWOT Analysis

Your Strategic Toolkit Starts Here
Baytex Energy shows resilient oil-weighted cash flow and low debt but faces commodity volatility, regulatory headwinds, and production decline risks; opportunistic assets and operational efficiency could drive recovery. Purchase the full SWOT analysis for a detailed, editable report and Excel tools to guide investment or strategic decisions.
Strengths

Diversified light and heavy oil portfolio
Baytexs diversified mix of U.S. light (Eagle Ford) and Western Canada heavy oil smooths cash flow across cycles, with 2024 guidance targeting about 95,000 boe/d and roughly a 40/60 light/heavy split to balance margins and volume. Light oil assets drive higher margins and quicker paybacks, while heavy oil provides multi-decade resource depth and stable base production. This portfolio enables flexible capital allocation as prices shift and reduces single-basin concentration risk.
Free cash flow and returns focus
Baytex prioritizes projects with strong economics to drive free cash flow, aligning capital deployment with shareholder returns through debt reduction, buybacks and a sustainable dividend policy; management reported continued net-debt reductions and resumed buybacks in recent years to enhance per-share value. This discipline strengthens resilience across commodity cycles and ties capital programs directly to shareholder returns.

Scale and operating know-how in core basins
Concentrated positions in Western Canada and the U.S. underpin Baytex’s operational efficiency, supporting an average 2024 production of about 82,000 boe/d and focused capital allocation. A repeatable drilling inventory allows standardized pad designs and tight cost control across plays. Strong local supply-chain relationships reduce execution risk, while operating scale boosts bargaining power with service providers, compressing per‑well costs.

Active risk management and hedging practices
Baytex’s active hedging program protects cash flows against commodity swings by establishing price floors and collars that support budget stability and debt service coverage.
Targeted basis and differential hedges reduce exposure to WCS and transport volatility, preserving realized crude pricing.
This risk framework underpins consistent capital deployment and smoothing of free cash flow across cycles.
- Hedging protects cash flow
- Price floors stabilize budgets
- Basis/differential management limits WCS risk
- Enables steady capital deployment
Responsible development and ESG progress
Baytex emphasizes responsible energy production and emissions management, with programs for methane reduction, water stewardship and well integrity that materially lower environmental risk and support operational continuity. Transparent sustainability reporting has improved access to capital and strengthened stakeholder trust and regulatory standing.
- Methane reduction programs
- Water stewardship and well integrity
- Transparent ESG reporting aiding capital access
- Improved regulatory and stakeholder trust
Scale, hedging stabilize cash flow amid ~95,000 boe/d 2024 guidance (40/60 light/heavy)
Diversified U.S. light (Eagle Ford) and WCS heavy footprint provided 2024 guidance ~95,000 boe/d with ~40/60 light/heavy, balancing margins and volume. Repeatable drilling inventory and regional scale supported ~82,000 boe/d average 2024 production and drove unit cost compression. Active hedging and targeted basis protection stabilized realized pricing and free cash flow across cycles.
| Metric | Value |
|---|---|
| 2024 guidance | ~95,000 boe/d |
| 2024 average production | ~82,000 boe/d |
| Light/Heavy split | ~40/60 |
What is included in the product
 Detailed Word Document
Provides a concise SWOT overview of Baytex Energy, highlighting strengths such as its heavy crude asset base and operational scale, weaknesses like leverage and commodity sensitivity, opportunities from portfolio optimization, cost cuts and oil-price recovery, and threats including oil-price volatility, regulatory and environmental pressures.

 Customizable Excel Spreadsheet
Provides a concise SWOT matrix for Baytex Energy to quickly surface upstream strengths, oil‑price exposure and regulatory risks, enabling fast strategy alignment and stakeholder‑ready summaries.
Weaknesses

High commodity price sensitivity
Revenue and cash flow remain tightly linked to oil and gas prices, with Baytex producing roughly 80,000 boe/d (2024 average) so a price drop quickly compresses margins and curtails capital spending. Downturns have historically cut free cash flow sharply; hedging programs only partially offset shocks. Ongoing budget flexibility and liquidity management are required to navigate volatile oil price swings.
Heavy oil differential exposure
Canadian heavy oil typically trades at a discount to global benchmarks, with WCS averaging roughly US$25/bbl below WTI in 2024.
Wide WCS differentials blunt Baytexs realized pricing and cash flow, reducing revenue per barrel by similar magnitudes versus benchmark-linked peers.
Pipeline outages or apportionment have pushed spreads above US$40/bbl at times, and added marketing and logistics complexity increases transportation and blending costs.

Capital intensity and decline management
Baytex faces high capital intensity as shale wells can show first-year declines of roughly 60–70% and thermal/SAGD projects require continuous infill and steam investment, keeping sustaining capital elevated. In weak oil prices sustaining capex can consume a large share of free cash flow, sometimes exceeding 40–50%, while execution delays push project breakevens materially higher. Maintaining high-quality inventory is essential to preserve returns and mitigate decline-driven spend.

Environmental liabilities and decommissioning
Legacy wells and facilities leave Baytex with sizable abandonment and reclamation obligations—reported decommissioning liabilities of about CAD 1.2 billion as at Dec 31, 2024—while regulatory tightening (higher standards and timelines) can sharply raise remediation costs. These obligations compete with capital for growth and shareholder returns and elevate balance-sheet risk over time.
- Decommissioning liability: CAD 1.2B (Dec 31, 2024)
- Regulatory cost pressure: rising remediation standards
- Capital allocation trade-off: growth vs. reclamation
- Balance-sheet exposure: higher long-term liabilities
FX and interest rate exposure
Operations and revenues span CAD and USD, creating a currency mismatch that magnified results when USD/CAD moved ~+8% in 2024; reported revenue and earnings swing materially with FX. Rising global rates lifted Baytex borrowing costs, with net debt ~CAD 1.3bn at YE 2024 increasing debt service sensitivity. Hedging reduces volatility but adds cost and operational complexity.
- FX mismatch: USD/CAD exposure
- Interest risk: higher debt service
- Reported volatility: earnings + leverage swings
- Hedging: cost and complexity
Oil-price sensitive (~80k boe/d), steep declines, capex strain, CAD 1.3B
Baytex remains highly oil-price sensitive (~80,000 boe/d 2024), with wide WCS discounts (~US$25/bbl avg 2024) and volatile pipeline differentials that compress realized prices. High sustaining capex and steep declines (first-year ~60–70%) keep capex needs and breakevens elevated. Decommissioning liabilities CAD 1.2B and net debt CAD 1.3B (YE2024) raise balance-sheet and FX risk after ~+8% USD/CAD move in 2024.
| Metric | Value |
|---|---|
| Production | ~80,000 boe/d (2024) |
| WCS discount | ~US$25/bbl (2024) |
| Decommissioning | CAD 1.2B (Dec 31, 2024) |
| Net debt | CAD 1.3B (YE2024) |
Preview Before You Purchase
Baytex Energy SWOT Analysis
This is the actual Baytex Energy SWOT analysis document you’ll receive upon purchase—no surprises, just professional quality. The preview below is taken directly from the full report; buying unlocks the complete, editable version with in-depth strengths, weaknesses, opportunities, and threats. You’re viewing a live preview of the exact file included in your download.

Your Strategic Toolkit Starts Here
Baytex Energy shows resilient oil-weighted cash flow and low debt but faces commodity volatility, regulatory headwinds, and production decline risks; opportunistic assets and operational efficiency could drive recovery. Purchase the full SWOT analysis for a detailed, editable report and Excel tools to guide investment or strategic decisions.
Strengths
Diversified light and heavy oil portfolio
Baytexs diversified mix of U.S. light (Eagle Ford) and Western Canada heavy oil smooths cash flow across cycles, with 2024 guidance targeting about 95,000 boe/d and roughly a 40/60 light/heavy split to balance margins and volume. Light oil assets drive higher margins and quicker paybacks, while heavy oil provides multi-decade resource depth and stable base production. This portfolio enables flexible capital allocation as prices shift and reduces single-basin concentration risk.
Free cash flow and returns focus
Baytex prioritizes projects with strong economics to drive free cash flow, aligning capital deployment with shareholder returns through debt reduction, buybacks and a sustainable dividend policy; management reported continued net-debt reductions and resumed buybacks in recent years to enhance per-share value. This discipline strengthens resilience across commodity cycles and ties capital programs directly to shareholder returns.
Scale and operating know-how in core basins
Concentrated positions in Western Canada and the U.S. underpin Baytex’s operational efficiency, supporting an average 2024 production of about 82,000 boe/d and focused capital allocation. A repeatable drilling inventory allows standardized pad designs and tight cost control across plays. Strong local supply-chain relationships reduce execution risk, while operating scale boosts bargaining power with service providers, compressing per‑well costs.
Active risk management and hedging practices
Baytex’s active hedging program protects cash flows against commodity swings by establishing price floors and collars that support budget stability and debt service coverage.
Targeted basis and differential hedges reduce exposure to WCS and transport volatility, preserving realized crude pricing.
This risk framework underpins consistent capital deployment and smoothing of free cash flow across cycles.
- Hedging protects cash flow
- Price floors stabilize budgets
- Basis/differential management limits WCS risk
- Enables steady capital deployment
Responsible development and ESG progress
Baytex emphasizes responsible energy production and emissions management, with programs for methane reduction, water stewardship and well integrity that materially lower environmental risk and support operational continuity. Transparent sustainability reporting has improved access to capital and strengthened stakeholder trust and regulatory standing.
- Methane reduction programs
- Water stewardship and well integrity
- Transparent ESG reporting aiding capital access
- Improved regulatory and stakeholder trust
Scale, hedging stabilize cash flow amid ~95,000 boe/d 2024 guidance (40/60 light/heavy)
Diversified U.S. light (Eagle Ford) and WCS heavy footprint provided 2024 guidance ~95,000 boe/d with ~40/60 light/heavy, balancing margins and volume. Repeatable drilling inventory and regional scale supported ~82,000 boe/d average 2024 production and drove unit cost compression. Active hedging and targeted basis protection stabilized realized pricing and free cash flow across cycles.
| Metric | Value |
|---|---|
| 2024 guidance | ~95,000 boe/d |
| 2024 average production | ~82,000 boe/d |
| Light/Heavy split | ~40/60 |
What is included in the product
Detailed Word Document
Provides a concise SWOT overview of Baytex Energy, highlighting strengths such as its heavy crude asset base and operational scale, weaknesses like leverage and commodity sensitivity, opportunities from portfolio optimization, cost cuts and oil-price recovery, and threats including oil-price volatility, regulatory and environmental pressures.
Customizable Excel Spreadsheet
Provides a concise SWOT matrix for Baytex Energy to quickly surface upstream strengths, oil‑price exposure and regulatory risks, enabling fast strategy alignment and stakeholder‑ready summaries.
Weaknesses
High commodity price sensitivity
Revenue and cash flow remain tightly linked to oil and gas prices, with Baytex producing roughly 80,000 boe/d (2024 average) so a price drop quickly compresses margins and curtails capital spending. Downturns have historically cut free cash flow sharply; hedging programs only partially offset shocks. Ongoing budget flexibility and liquidity management are required to navigate volatile oil price swings.
Heavy oil differential exposure
Canadian heavy oil typically trades at a discount to global benchmarks, with WCS averaging roughly US$25/bbl below WTI in 2024.
Wide WCS differentials blunt Baytexs realized pricing and cash flow, reducing revenue per barrel by similar magnitudes versus benchmark-linked peers.
Pipeline outages or apportionment have pushed spreads above US$40/bbl at times, and added marketing and logistics complexity increases transportation and blending costs.
Capital intensity and decline management
Baytex faces high capital intensity as shale wells can show first-year declines of roughly 60–70% and thermal/SAGD projects require continuous infill and steam investment, keeping sustaining capital elevated. In weak oil prices sustaining capex can consume a large share of free cash flow, sometimes exceeding 40–50%, while execution delays push project breakevens materially higher. Maintaining high-quality inventory is essential to preserve returns and mitigate decline-driven spend.
Environmental liabilities and decommissioning
Legacy wells and facilities leave Baytex with sizable abandonment and reclamation obligations—reported decommissioning liabilities of about CAD 1.2 billion as at Dec 31, 2024—while regulatory tightening (higher standards and timelines) can sharply raise remediation costs. These obligations compete with capital for growth and shareholder returns and elevate balance-sheet risk over time.
- Decommissioning liability: CAD 1.2B (Dec 31, 2024)
- Regulatory cost pressure: rising remediation standards
- Capital allocation trade-off: growth vs. reclamation
- Balance-sheet exposure: higher long-term liabilities
FX and interest rate exposure
Operations and revenues span CAD and USD, creating a currency mismatch that magnified results when USD/CAD moved ~+8% in 2024; reported revenue and earnings swing materially with FX. Rising global rates lifted Baytex borrowing costs, with net debt ~CAD 1.3bn at YE 2024 increasing debt service sensitivity. Hedging reduces volatility but adds cost and operational complexity.
- FX mismatch: USD/CAD exposure
- Interest risk: higher debt service
- Reported volatility: earnings + leverage swings
- Hedging: cost and complexity
Oil-price sensitive (~80k boe/d), steep declines, capex strain, CAD 1.3B
Baytex remains highly oil-price sensitive (~80,000 boe/d 2024), with wide WCS discounts (~US$25/bbl avg 2024) and volatile pipeline differentials that compress realized prices. High sustaining capex and steep declines (first-year ~60–70%) keep capex needs and breakevens elevated. Decommissioning liabilities CAD 1.2B and net debt CAD 1.3B (YE2024) raise balance-sheet and FX risk after ~+8% USD/CAD move in 2024.
| Metric | Value |
|---|---|
| Production | ~80,000 boe/d (2024) |
| WCS discount | ~US$25/bbl (2024) |
| Decommissioning | CAD 1.2B (Dec 31, 2024) |
| Net debt | CAD 1.3B (YE2024) |
Preview Before You Purchase
Baytex Energy SWOT Analysis
This is the actual Baytex Energy SWOT analysis document you’ll receive upon purchase—no surprises, just professional quality. The preview below is taken directly from the full report; buying unlocks the complete, editable version with in-depth strengths, weaknesses, opportunities, and threats. You’re viewing a live preview of the exact file included in your download.
Description
Your Strategic Toolkit Starts Here
Baytex Energy shows resilient oil-weighted cash flow and low debt but faces commodity volatility, regulatory headwinds, and production decline risks; opportunistic assets and operational efficiency could drive recovery. Purchase the full SWOT analysis for a detailed, editable report and Excel tools to guide investment or strategic decisions.
Strengths
Diversified light and heavy oil portfolio
Baytexs diversified mix of U.S. light (Eagle Ford) and Western Canada heavy oil smooths cash flow across cycles, with 2024 guidance targeting about 95,000 boe/d and roughly a 40/60 light/heavy split to balance margins and volume. Light oil assets drive higher margins and quicker paybacks, while heavy oil provides multi-decade resource depth and stable base production. This portfolio enables flexible capital allocation as prices shift and reduces single-basin concentration risk.
Free cash flow and returns focus
Baytex prioritizes projects with strong economics to drive free cash flow, aligning capital deployment with shareholder returns through debt reduction, buybacks and a sustainable dividend policy; management reported continued net-debt reductions and resumed buybacks in recent years to enhance per-share value. This discipline strengthens resilience across commodity cycles and ties capital programs directly to shareholder returns.
Scale and operating know-how in core basins
Concentrated positions in Western Canada and the U.S. underpin Baytex’s operational efficiency, supporting an average 2024 production of about 82,000 boe/d and focused capital allocation. A repeatable drilling inventory allows standardized pad designs and tight cost control across plays. Strong local supply-chain relationships reduce execution risk, while operating scale boosts bargaining power with service providers, compressing per‑well costs.
Active risk management and hedging practices
Baytex’s active hedging program protects cash flows against commodity swings by establishing price floors and collars that support budget stability and debt service coverage.
Targeted basis and differential hedges reduce exposure to WCS and transport volatility, preserving realized crude pricing.
This risk framework underpins consistent capital deployment and smoothing of free cash flow across cycles.
- Hedging protects cash flow
- Price floors stabilize budgets
- Basis/differential management limits WCS risk
- Enables steady capital deployment
Responsible development and ESG progress
Baytex emphasizes responsible energy production and emissions management, with programs for methane reduction, water stewardship and well integrity that materially lower environmental risk and support operational continuity. Transparent sustainability reporting has improved access to capital and strengthened stakeholder trust and regulatory standing.
- Methane reduction programs
- Water stewardship and well integrity
- Transparent ESG reporting aiding capital access
- Improved regulatory and stakeholder trust
Scale, hedging stabilize cash flow amid ~95,000 boe/d 2024 guidance (40/60 light/heavy)
Diversified U.S. light (Eagle Ford) and WCS heavy footprint provided 2024 guidance ~95,000 boe/d with ~40/60 light/heavy, balancing margins and volume. Repeatable drilling inventory and regional scale supported ~82,000 boe/d average 2024 production and drove unit cost compression. Active hedging and targeted basis protection stabilized realized pricing and free cash flow across cycles.
| Metric | Value |
|---|---|
| 2024 guidance | ~95,000 boe/d |
| 2024 average production | ~82,000 boe/d |
| Light/Heavy split | ~40/60 |
What is included in the product
Detailed Word Document
Provides a concise SWOT overview of Baytex Energy, highlighting strengths such as its heavy crude asset base and operational scale, weaknesses like leverage and commodity sensitivity, opportunities from portfolio optimization, cost cuts and oil-price recovery, and threats including oil-price volatility, regulatory and environmental pressures.
Customizable Excel Spreadsheet
Provides a concise SWOT matrix for Baytex Energy to quickly surface upstream strengths, oil‑price exposure and regulatory risks, enabling fast strategy alignment and stakeholder‑ready summaries.
Weaknesses
High commodity price sensitivity
Revenue and cash flow remain tightly linked to oil and gas prices, with Baytex producing roughly 80,000 boe/d (2024 average) so a price drop quickly compresses margins and curtails capital spending. Downturns have historically cut free cash flow sharply; hedging programs only partially offset shocks. Ongoing budget flexibility and liquidity management are required to navigate volatile oil price swings.
Heavy oil differential exposure
Canadian heavy oil typically trades at a discount to global benchmarks, with WCS averaging roughly US$25/bbl below WTI in 2024.
Wide WCS differentials blunt Baytexs realized pricing and cash flow, reducing revenue per barrel by similar magnitudes versus benchmark-linked peers.
Pipeline outages or apportionment have pushed spreads above US$40/bbl at times, and added marketing and logistics complexity increases transportation and blending costs.
Capital intensity and decline management
Baytex faces high capital intensity as shale wells can show first-year declines of roughly 60–70% and thermal/SAGD projects require continuous infill and steam investment, keeping sustaining capital elevated. In weak oil prices sustaining capex can consume a large share of free cash flow, sometimes exceeding 40–50%, while execution delays push project breakevens materially higher. Maintaining high-quality inventory is essential to preserve returns and mitigate decline-driven spend.
Environmental liabilities and decommissioning
Legacy wells and facilities leave Baytex with sizable abandonment and reclamation obligations—reported decommissioning liabilities of about CAD 1.2 billion as at Dec 31, 2024—while regulatory tightening (higher standards and timelines) can sharply raise remediation costs. These obligations compete with capital for growth and shareholder returns and elevate balance-sheet risk over time.
- Decommissioning liability: CAD 1.2B (Dec 31, 2024)
- Regulatory cost pressure: rising remediation standards
- Capital allocation trade-off: growth vs. reclamation
- Balance-sheet exposure: higher long-term liabilities
FX and interest rate exposure
Operations and revenues span CAD and USD, creating a currency mismatch that magnified results when USD/CAD moved ~+8% in 2024; reported revenue and earnings swing materially with FX. Rising global rates lifted Baytex borrowing costs, with net debt ~CAD 1.3bn at YE 2024 increasing debt service sensitivity. Hedging reduces volatility but adds cost and operational complexity.
- FX mismatch: USD/CAD exposure
- Interest risk: higher debt service
- Reported volatility: earnings + leverage swings
- Hedging: cost and complexity
Oil-price sensitive (~80k boe/d), steep declines, capex strain, CAD 1.3B
Baytex remains highly oil-price sensitive (~80,000 boe/d 2024), with wide WCS discounts (~US$25/bbl avg 2024) and volatile pipeline differentials that compress realized prices. High sustaining capex and steep declines (first-year ~60–70%) keep capex needs and breakevens elevated. Decommissioning liabilities CAD 1.2B and net debt CAD 1.3B (YE2024) raise balance-sheet and FX risk after ~+8% USD/CAD move in 2024.
| Metric | Value |
|---|---|
| Production | ~80,000 boe/d (2024) |
| WCS discount | ~US$25/bbl (2024) |
| Decommissioning | CAD 1.2B (Dec 31, 2024) |
| Net debt | CAD 1.3B (YE2024) |
Preview Before You Purchase
Baytex Energy SWOT Analysis
This is the actual Baytex Energy SWOT analysis document you’ll receive upon purchase—no surprises, just professional quality. The preview below is taken directly from the full report; buying unlocks the complete, editable version with in-depth strengths, weaknesses, opportunities, and threats. You’re viewing a live preview of the exact file included in your download.











