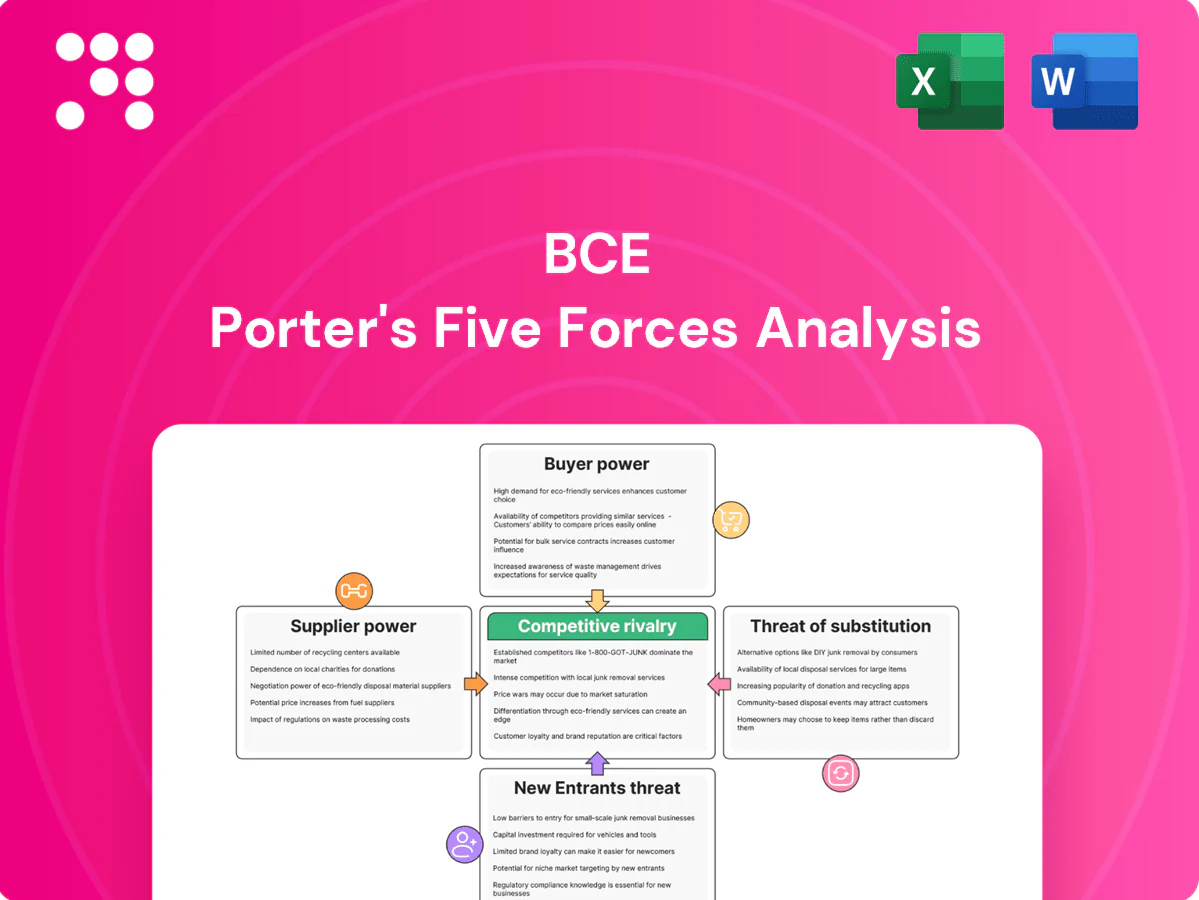
BCE Porter's Five Forces Analysis

Go Beyond the Preview—Access the Full Strategic Report
BCE faces moderate supplier power, intense buyer expectations, and steady competitive rivalry from cable, wireless and streaming players; regulatory and technology shifts shape entry and substitution threats. This snapshot highlights key pressures and strategic levers. Unlock the full Porter’s Five Forces Analysis for force-by-force ratings, visuals, and actionable recommendations tailored to BCE.
Suppliers Bargaining Power

Concentrated network vendors
Radio, core and transport gear is sourced from a few global OEMs—Ericsson, Nokia and Huawei—which together hold roughly 70% of the global RAN market in 2024, concentrating supplier leverage. Multi‑year upgrade paths from 4G to 5G/5G‑Advanced and high switching costs deepen BCE dependency. BCE uses dual‑sourcing and scale to negotiate, but vendor roadmaps and pricing still pressure margins. Supply‑chain shocks can delay rollouts by months and pushed 2024 capex toward ~CAD 3.9B.
Handset and device ecosystems
Flagship handsets are concentrated: Apple and Samsung held over 40% of global smartphone shipments in 2024 (IDC), giving OEMs marketing and margin leverage. BCE depends on timely device availability for subscriber acquisition and retention, while carrier financing and promotions blunt OEM pricing but compress ARPU and subsidy economics. Periodic supply constraints in 2024 shifted sales toward costlier SKUs, raising device subsidy outlays.

Content and sports rights holders
Premium TV and streaming rights holders wield strong negotiating power because scarce, must-have sports content commands outsized fees; landmark examples include the 2013 NHL Canadian rights deal worth CAD 5.2 billion over 12 years. BCE’s Bell Media ownership of CTV and TSN offsets some licensing cost but rising carriage and streaming bids compress margins. Blackout risks and churn sensitivity boost supplier leverage during renewals. Vertical integration enables BCE to bundle content, defending yield.

Construction, fiber, and tower partners
Specialized construction, fiber and tower partners materially influence BCE deployment timelines and pricing, with skilled contractors affecting cost and schedule risk. Tight labor markets, permitting delays and rising materials costs have elevated project risk. Long-term supplier contracts secure capacity but reduce procurement flexibility. BCE’s significant owned footprint lowers exposure relative to pure lessees.
Spectrum availability and equipment standards
Compliance with evolving 3GPP standards (Release 18 activity in 2024) ties BCE to vendor roadmaps and release cycles, constraining vendor choice; spectrum scarcity (BCE holds low- and mid-band assets including 600/700 and 3500 MHz) raises prices for compatible gear and integration services; interoperability gaps inflate integration costs and vendor reliance; standard transitions drive forced refresh capex.
- Tied to 3GPP timelines
- Spectrum raises equipment value
- Interoperability ups integration costs
- Transitions force refresh spend
Supply squeeze: RAN top3 ~70%, capex CAD 3.9B, phones >40%
Supplier power is high: three RAN OEMs (Ericsson, Nokia, Huawei) held ~70% of global market in 2024, raising price and roadmap leverage; BCE’s 2024 capex (~CAD 3.9B) and upgrade paths increase dependency. Handset concentration (Apple+Samsung >40% shipments in 2024) and premium content fees (NHL rights CAD 5.2B) further pressure margins.
| Metric | 2024 |
|---|---|
| RAN market share (top3) | ~70% |
| Capex | ~CAD 3.9B |
| Apple+Samsung shipments | >40% |
| NHL rights (deal) | CAD 5.2B |
What is included in the product
 Detailed Word Document
Uncovers key drivers of competition, customer influence, and market entry risks tailored exclusively for BCE, identifying disruptive forces and substitutes, evaluating supplier and buyer power, and highlighting barriers that protect incumbents and threaten market share.

 Customizable Excel Spreadsheet
One-sheet BCE Porter's Five Forces that instantly visualizes competitive pressure with an editable spider chart—perfect for quick boardroom decisions and pitch decks; no macros, easy to customize with your own data and scenarios.
Customers Bargaining Power

Price‑sensitive consumer base
Canadian consumers compare aggressively across bundles, promos and device financing, and the Big Three (BCE, Rogers, Telus) held roughly 90% of wireless market share as of 2024, intensifying price scrutiny. Number portability and competitive handset financing lower switching friction, raising buyer leverage. Elevated churn risk forces rich retention offers that squeeze margins. Loyalty programs and converged bundles blunt but do not eliminate customer bargaining power.
Enterprise and government accounts
Enterprise and government accounts push strong bargaining power with volume discounts, strict SLAs and custom solutions; BCE reported roughly CAD 24.0 billion in 2024 revenue, making large-account pricing consequential. Multi-year contracts (typically 3–5 years) give revenue visibility but lock in sharper pricing. RFP-driven procurement pits carriers head-to-head, intensifying buyer leverage. Cross-sell of cloud, security and IoT raises switching costs and boosts ARPU.

Cord‑cutting and streaming adopters
Cord‑cutting lets customers replace pay‑TV with OTT apps, eroding BCE’s pricing power in legacy video as subscribers migrate to lower‑cost streaming. Month‑to‑month streaming norms reset expectations on contracts and early‑termination fees, increasing churn risk. To retain value BCE must bundle high‑margin connectivity with exclusive content and aggregators. Simple packaging and clear perceived savings amplify buyer clout.

Wholesale and MVNO customers
Wholesale and MVNO customers demand competitive rates to win retail share, squeezing BCE margins; regulatory moves in 2024 continued to bolster MVNO access, increasing buyer leverage while volume commitments trade lower prices for revenue predictability; superior network quality still cushions pure price competition.
- Regulation: 2024 strengthened MVNO access
- Margins: wholesale pricing pressure
- Volume: commitments lower unit price
- Network: quality offsets price-only decisions
Digital transparency and comparison tools
Online comparators and social reviews make pricing and service quality highly visible: 68% of consumers used price comparison tools in 2024, compressing margins and making promotional cycles table stakes. Buyers time upgrades to peak incentives—US average auto incentive ≈ $4,100 in 2024—raising negotiation power. Superior customer experience reduces, but cannot erase, transparency effects.
- 68% used price comparators in 2024
- US avg auto incentive ≈ $4,100 (2024)
- Promotions erode differentiation
- CX lowers but does not remove transparency
Consumers squeeze telecom margins as Big Three dominance meets MVNO reform
Canadian consumers wield high leverage: Big Three held ~90% wireless share (2024), driving aggressive price comparison and churn. BCE reported CAD 24.0B revenue (2024), so enterprise bargaining matters via multi-year RFPs. MVNO/wholesale access reforms in 2024 increased buyer options; 68% used price comparators (2024), compressing margins.
| Metric | 2024 |
|---|---|
| Big Three wireless share | ~90% |
| BCE revenue | CAD 24.0B |
| Price comparators use | 68% |
Preview the Actual Deliverable
BCE Porter's Five Forces Analysis
This preview is the exact BCE Porter’s Five Forces Analysis you’ll receive upon purchase—no samples, no placeholders. It provides the full competitive assessment, concise conclusions and actionable implications for investors and strategists. Download access to this fully formatted file is immediate after payment.

Go Beyond the Preview—Access the Full Strategic Report
BCE faces moderate supplier power, intense buyer expectations, and steady competitive rivalry from cable, wireless and streaming players; regulatory and technology shifts shape entry and substitution threats. This snapshot highlights key pressures and strategic levers. Unlock the full Porter’s Five Forces Analysis for force-by-force ratings, visuals, and actionable recommendations tailored to BCE.
Suppliers Bargaining Power
Concentrated network vendors
Radio, core and transport gear is sourced from a few global OEMs—Ericsson, Nokia and Huawei—which together hold roughly 70% of the global RAN market in 2024, concentrating supplier leverage. Multi‑year upgrade paths from 4G to 5G/5G‑Advanced and high switching costs deepen BCE dependency. BCE uses dual‑sourcing and scale to negotiate, but vendor roadmaps and pricing still pressure margins. Supply‑chain shocks can delay rollouts by months and pushed 2024 capex toward ~CAD 3.9B.
Handset and device ecosystems
Flagship handsets are concentrated: Apple and Samsung held over 40% of global smartphone shipments in 2024 (IDC), giving OEMs marketing and margin leverage. BCE depends on timely device availability for subscriber acquisition and retention, while carrier financing and promotions blunt OEM pricing but compress ARPU and subsidy economics. Periodic supply constraints in 2024 shifted sales toward costlier SKUs, raising device subsidy outlays.
Content and sports rights holders
Premium TV and streaming rights holders wield strong negotiating power because scarce, must-have sports content commands outsized fees; landmark examples include the 2013 NHL Canadian rights deal worth CAD 5.2 billion over 12 years. BCE’s Bell Media ownership of CTV and TSN offsets some licensing cost but rising carriage and streaming bids compress margins. Blackout risks and churn sensitivity boost supplier leverage during renewals. Vertical integration enables BCE to bundle content, defending yield.
Construction, fiber, and tower partners
Specialized construction, fiber and tower partners materially influence BCE deployment timelines and pricing, with skilled contractors affecting cost and schedule risk. Tight labor markets, permitting delays and rising materials costs have elevated project risk. Long-term supplier contracts secure capacity but reduce procurement flexibility. BCE’s significant owned footprint lowers exposure relative to pure lessees.
Spectrum availability and equipment standards
Compliance with evolving 3GPP standards (Release 18 activity in 2024) ties BCE to vendor roadmaps and release cycles, constraining vendor choice; spectrum scarcity (BCE holds low- and mid-band assets including 600/700 and 3500 MHz) raises prices for compatible gear and integration services; interoperability gaps inflate integration costs and vendor reliance; standard transitions drive forced refresh capex.
- Tied to 3GPP timelines
- Spectrum raises equipment value
- Interoperability ups integration costs
- Transitions force refresh spend
Supply squeeze: RAN top3 ~70%, capex CAD 3.9B, phones >40%
Supplier power is high: three RAN OEMs (Ericsson, Nokia, Huawei) held ~70% of global market in 2024, raising price and roadmap leverage; BCE’s 2024 capex (~CAD 3.9B) and upgrade paths increase dependency. Handset concentration (Apple+Samsung >40% shipments in 2024) and premium content fees (NHL rights CAD 5.2B) further pressure margins.
| Metric | 2024 |
|---|---|
| RAN market share (top3) | ~70% |
| Capex | ~CAD 3.9B |
| Apple+Samsung shipments | >40% |
| NHL rights (deal) | CAD 5.2B |
What is included in the product
Detailed Word Document
Uncovers key drivers of competition, customer influence, and market entry risks tailored exclusively for BCE, identifying disruptive forces and substitutes, evaluating supplier and buyer power, and highlighting barriers that protect incumbents and threaten market share.
Customizable Excel Spreadsheet
One-sheet BCE Porter's Five Forces that instantly visualizes competitive pressure with an editable spider chart—perfect for quick boardroom decisions and pitch decks; no macros, easy to customize with your own data and scenarios.
Customers Bargaining Power
Price‑sensitive consumer base
Canadian consumers compare aggressively across bundles, promos and device financing, and the Big Three (BCE, Rogers, Telus) held roughly 90% of wireless market share as of 2024, intensifying price scrutiny. Number portability and competitive handset financing lower switching friction, raising buyer leverage. Elevated churn risk forces rich retention offers that squeeze margins. Loyalty programs and converged bundles blunt but do not eliminate customer bargaining power.
Enterprise and government accounts
Enterprise and government accounts push strong bargaining power with volume discounts, strict SLAs and custom solutions; BCE reported roughly CAD 24.0 billion in 2024 revenue, making large-account pricing consequential. Multi-year contracts (typically 3–5 years) give revenue visibility but lock in sharper pricing. RFP-driven procurement pits carriers head-to-head, intensifying buyer leverage. Cross-sell of cloud, security and IoT raises switching costs and boosts ARPU.
Cord‑cutting and streaming adopters
Cord‑cutting lets customers replace pay‑TV with OTT apps, eroding BCE’s pricing power in legacy video as subscribers migrate to lower‑cost streaming. Month‑to‑month streaming norms reset expectations on contracts and early‑termination fees, increasing churn risk. To retain value BCE must bundle high‑margin connectivity with exclusive content and aggregators. Simple packaging and clear perceived savings amplify buyer clout.
Wholesale and MVNO customers
Wholesale and MVNO customers demand competitive rates to win retail share, squeezing BCE margins; regulatory moves in 2024 continued to bolster MVNO access, increasing buyer leverage while volume commitments trade lower prices for revenue predictability; superior network quality still cushions pure price competition.
- Regulation: 2024 strengthened MVNO access
- Margins: wholesale pricing pressure
- Volume: commitments lower unit price
- Network: quality offsets price-only decisions
Digital transparency and comparison tools
Online comparators and social reviews make pricing and service quality highly visible: 68% of consumers used price comparison tools in 2024, compressing margins and making promotional cycles table stakes. Buyers time upgrades to peak incentives—US average auto incentive ≈ $4,100 in 2024—raising negotiation power. Superior customer experience reduces, but cannot erase, transparency effects.
- 68% used price comparators in 2024
- US avg auto incentive ≈ $4,100 (2024)
- Promotions erode differentiation
- CX lowers but does not remove transparency
Consumers squeeze telecom margins as Big Three dominance meets MVNO reform
Canadian consumers wield high leverage: Big Three held ~90% wireless share (2024), driving aggressive price comparison and churn. BCE reported CAD 24.0B revenue (2024), so enterprise bargaining matters via multi-year RFPs. MVNO/wholesale access reforms in 2024 increased buyer options; 68% used price comparators (2024), compressing margins.
| Metric | 2024 |
|---|---|
| Big Three wireless share | ~90% |
| BCE revenue | CAD 24.0B |
| Price comparators use | 68% |
Preview the Actual Deliverable
BCE Porter's Five Forces Analysis
This preview is the exact BCE Porter’s Five Forces Analysis you’ll receive upon purchase—no samples, no placeholders. It provides the full competitive assessment, concise conclusions and actionable implications for investors and strategists. Download access to this fully formatted file is immediate after payment.
Original: $10.00
-65%$10.00
$3.50Description
Go Beyond the Preview—Access the Full Strategic Report
BCE faces moderate supplier power, intense buyer expectations, and steady competitive rivalry from cable, wireless and streaming players; regulatory and technology shifts shape entry and substitution threats. This snapshot highlights key pressures and strategic levers. Unlock the full Porter’s Five Forces Analysis for force-by-force ratings, visuals, and actionable recommendations tailored to BCE.
Suppliers Bargaining Power
Concentrated network vendors
Radio, core and transport gear is sourced from a few global OEMs—Ericsson, Nokia and Huawei—which together hold roughly 70% of the global RAN market in 2024, concentrating supplier leverage. Multi‑year upgrade paths from 4G to 5G/5G‑Advanced and high switching costs deepen BCE dependency. BCE uses dual‑sourcing and scale to negotiate, but vendor roadmaps and pricing still pressure margins. Supply‑chain shocks can delay rollouts by months and pushed 2024 capex toward ~CAD 3.9B.
Handset and device ecosystems
Flagship handsets are concentrated: Apple and Samsung held over 40% of global smartphone shipments in 2024 (IDC), giving OEMs marketing and margin leverage. BCE depends on timely device availability for subscriber acquisition and retention, while carrier financing and promotions blunt OEM pricing but compress ARPU and subsidy economics. Periodic supply constraints in 2024 shifted sales toward costlier SKUs, raising device subsidy outlays.
Content and sports rights holders
Premium TV and streaming rights holders wield strong negotiating power because scarce, must-have sports content commands outsized fees; landmark examples include the 2013 NHL Canadian rights deal worth CAD 5.2 billion over 12 years. BCE’s Bell Media ownership of CTV and TSN offsets some licensing cost but rising carriage and streaming bids compress margins. Blackout risks and churn sensitivity boost supplier leverage during renewals. Vertical integration enables BCE to bundle content, defending yield.
Construction, fiber, and tower partners
Specialized construction, fiber and tower partners materially influence BCE deployment timelines and pricing, with skilled contractors affecting cost and schedule risk. Tight labor markets, permitting delays and rising materials costs have elevated project risk. Long-term supplier contracts secure capacity but reduce procurement flexibility. BCE’s significant owned footprint lowers exposure relative to pure lessees.
Spectrum availability and equipment standards
Compliance with evolving 3GPP standards (Release 18 activity in 2024) ties BCE to vendor roadmaps and release cycles, constraining vendor choice; spectrum scarcity (BCE holds low- and mid-band assets including 600/700 and 3500 MHz) raises prices for compatible gear and integration services; interoperability gaps inflate integration costs and vendor reliance; standard transitions drive forced refresh capex.
- Tied to 3GPP timelines
- Spectrum raises equipment value
- Interoperability ups integration costs
- Transitions force refresh spend
Supply squeeze: RAN top3 ~70%, capex CAD 3.9B, phones >40%
Supplier power is high: three RAN OEMs (Ericsson, Nokia, Huawei) held ~70% of global market in 2024, raising price and roadmap leverage; BCE’s 2024 capex (~CAD 3.9B) and upgrade paths increase dependency. Handset concentration (Apple+Samsung >40% shipments in 2024) and premium content fees (NHL rights CAD 5.2B) further pressure margins.
| Metric | 2024 |
|---|---|
| RAN market share (top3) | ~70% |
| Capex | ~CAD 3.9B |
| Apple+Samsung shipments | >40% |
| NHL rights (deal) | CAD 5.2B |
What is included in the product
Detailed Word Document
Uncovers key drivers of competition, customer influence, and market entry risks tailored exclusively for BCE, identifying disruptive forces and substitutes, evaluating supplier and buyer power, and highlighting barriers that protect incumbents and threaten market share.
Customizable Excel Spreadsheet
One-sheet BCE Porter's Five Forces that instantly visualizes competitive pressure with an editable spider chart—perfect for quick boardroom decisions and pitch decks; no macros, easy to customize with your own data and scenarios.
Customers Bargaining Power
Price‑sensitive consumer base
Canadian consumers compare aggressively across bundles, promos and device financing, and the Big Three (BCE, Rogers, Telus) held roughly 90% of wireless market share as of 2024, intensifying price scrutiny. Number portability and competitive handset financing lower switching friction, raising buyer leverage. Elevated churn risk forces rich retention offers that squeeze margins. Loyalty programs and converged bundles blunt but do not eliminate customer bargaining power.
Enterprise and government accounts
Enterprise and government accounts push strong bargaining power with volume discounts, strict SLAs and custom solutions; BCE reported roughly CAD 24.0 billion in 2024 revenue, making large-account pricing consequential. Multi-year contracts (typically 3–5 years) give revenue visibility but lock in sharper pricing. RFP-driven procurement pits carriers head-to-head, intensifying buyer leverage. Cross-sell of cloud, security and IoT raises switching costs and boosts ARPU.
Cord‑cutting and streaming adopters
Cord‑cutting lets customers replace pay‑TV with OTT apps, eroding BCE’s pricing power in legacy video as subscribers migrate to lower‑cost streaming. Month‑to‑month streaming norms reset expectations on contracts and early‑termination fees, increasing churn risk. To retain value BCE must bundle high‑margin connectivity with exclusive content and aggregators. Simple packaging and clear perceived savings amplify buyer clout.
Wholesale and MVNO customers
Wholesale and MVNO customers demand competitive rates to win retail share, squeezing BCE margins; regulatory moves in 2024 continued to bolster MVNO access, increasing buyer leverage while volume commitments trade lower prices for revenue predictability; superior network quality still cushions pure price competition.
- Regulation: 2024 strengthened MVNO access
- Margins: wholesale pricing pressure
- Volume: commitments lower unit price
- Network: quality offsets price-only decisions
Digital transparency and comparison tools
Online comparators and social reviews make pricing and service quality highly visible: 68% of consumers used price comparison tools in 2024, compressing margins and making promotional cycles table stakes. Buyers time upgrades to peak incentives—US average auto incentive ≈ $4,100 in 2024—raising negotiation power. Superior customer experience reduces, but cannot erase, transparency effects.
- 68% used price comparators in 2024
- US avg auto incentive ≈ $4,100 (2024)
- Promotions erode differentiation
- CX lowers but does not remove transparency
Consumers squeeze telecom margins as Big Three dominance meets MVNO reform
Canadian consumers wield high leverage: Big Three held ~90% wireless share (2024), driving aggressive price comparison and churn. BCE reported CAD 24.0B revenue (2024), so enterprise bargaining matters via multi-year RFPs. MVNO/wholesale access reforms in 2024 increased buyer options; 68% used price comparators (2024), compressing margins.
| Metric | 2024 |
|---|---|
| Big Three wireless share | ~90% |
| BCE revenue | CAD 24.0B |
| Price comparators use | 68% |
Preview the Actual Deliverable
BCE Porter's Five Forces Analysis
This preview is the exact BCE Porter’s Five Forces Analysis you’ll receive upon purchase—no samples, no placeholders. It provides the full competitive assessment, concise conclusions and actionable implications for investors and strategists. Download access to this fully formatted file is immediate after payment.











