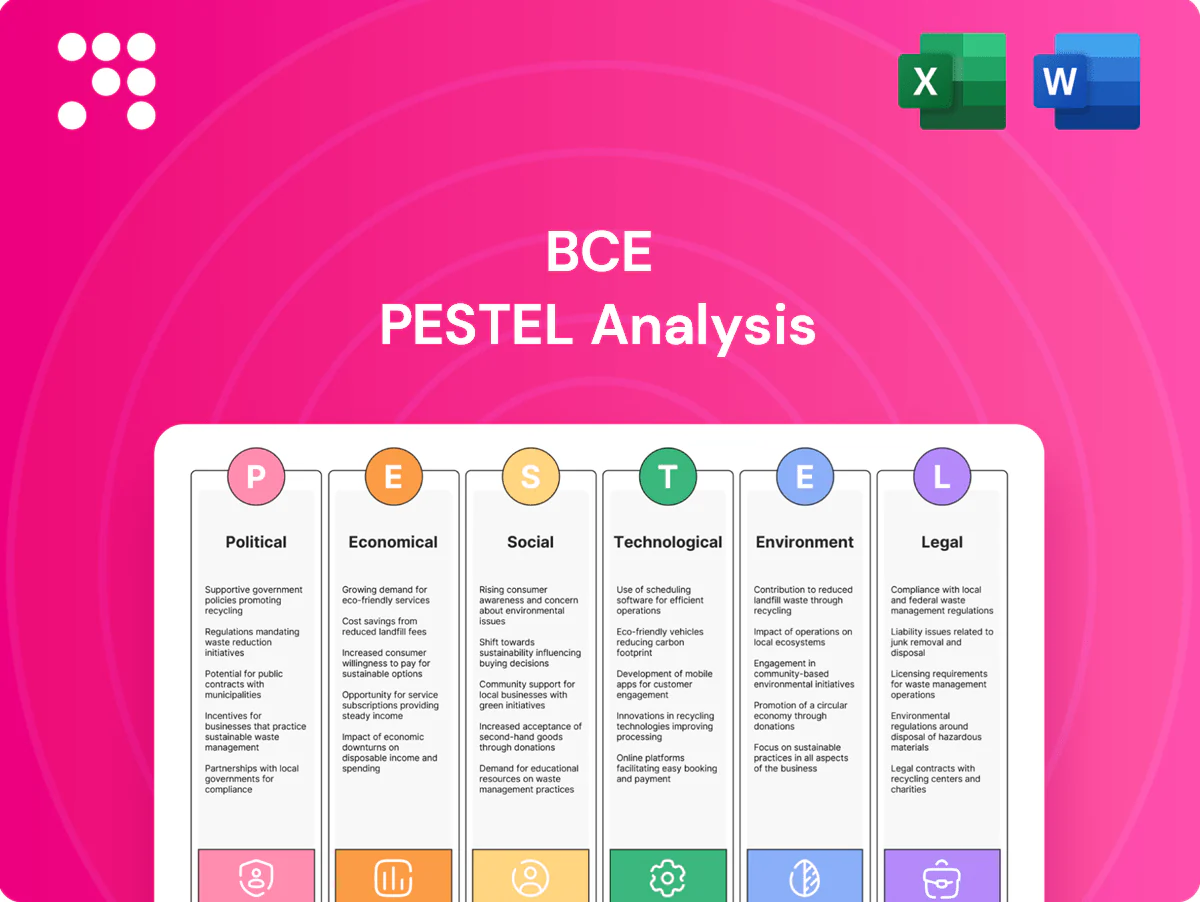
BCE PESTLE Analysis

Your Competitive Advantage Starts with This Report
Gain a strategic advantage with our PESTLE analysis of BCE — concise, evidence-based insights into political, economic, social, technological, legal and environmental forces shaping the company. Ideal for investors and strategists, it translates external trends into actionable risks and opportunities. Purchase the full report for the complete, editable breakdown and immediate download.
Political factors

CRTC and policy oversight
CRTC and federal telecom rules directly shape BCE pricing, wholesale access, media carriage and investment choices through decisions on MVNO access, wholesale rates and net neutrality enforcement; Canada’s Big Three (Bell, Rogers, Telus) hold roughly 90% of wireless market share, magnifying regulatory impact. CRTC rulings on MVNO access and wholesale fiber pricing alter margin and capital allocation, forcing trade-offs between consumer protections and incentives for BCE’s CAD-denominated infrastructure capex and bundled telecom-media strategies.
Spectrum allocation and auctions
Federal spectrum policy and ISED auction timing for mid-band 3.5 GHz licences shape BCE’s 5G capacity, coverage and capital allocation by forcing trade-offs between licence fees, deployment obligations and rural build conditions; set-asides and high reserve prices can raise CAPEX and delay densification. License fees and rural deployment clauses drive timing of site rollout while spectrum sharing and refarming of 700/2600 MHz boost capacity cost‑efficiently. Competitive positioning versus Rogers, Telus and regional carriers depends on auction outcomes and existing holdings, where earlier mid-band wins accelerate urban coverage and wholesale edge advantages.

Canadian content and media policy
Bill C-11 (Online Streaming Act) received royal assent April 2023 and CRTC rulemaking continued through 2024–25 to set Canadian content funding, discoverability and carriage obligations for online undertakings; impacts Bell Media/Crave include potential higher Canadian content spend and mandated placement that could raise programming costs and shift ad revenue mix versus digital platforms; regulators are also probing cross-ownership limits and mandatory financial contributions from non‑Canadian streamers.

Public funding and rural connectivity
Federal Universal Broadband Fund totals 2.75 billion CAD, and the CRTC universal service objective of 50/10 Mbps by 2030 makes digital inclusion a stated political priority; these subsidies lower rural build economics and boost BCE’s coverage and reputational capital while imposing compliance milestones and reporting costs.
- Public funding: 2.75B CAD UBF
- Policy target: CRTC 50/10 Mbps by 2030
- Benefit: improved coverage, PR, customer retention
- Cost: compliance, milestone risk
- Opportunity: municipal co-funding, PPPs
Foreign ownership and national security
Foreign ownership is constrained by Investment Canada Act reviews and national security assessments; Ottawa reiterated in 2024 its exclusion of high-risk vendors following the 2022 Huawei/ZTE decisions, increasing vendor scrutiny and contractual risk for BCE. This raises 5G vendor-selection complexity and can elevate procurement and integration costs, while US–China geopolitical shifts influence supplier pools and roaming agreements.
- Regulatory: Investment Canada Act reviews
- Vendors: Huawei/ZTE flagged high-risk (post-2022)
- Cost: higher procurement/ integration risk
- Geopolitics: US–China tensions affect roaming/procurement
CRTC rules, ~90% Big Three share, Bill C-11 and UBF reshape Canadian telecom economics
CRTC rules, MVNO/wholesale decisions and net neutrality shape BCE pricing, margins and capex; Canada’s Big Three hold ~90% wireless share amplifying regulatory effects. Bill C-11 (royal assent Apr 2023) raises Canadian content spend for Bell Media/Crave. Federal UBF is 2.75B CAD and CRTC target 50/10 Mbps by 2030 aids rural rollout. Investment Canada Act reviews and post‑2022 Huawei/ZTE vendor exclusions raise 5G vendor risk.
| Item | Value |
|---|---|
| Wireless market share (Big 3) | ~90% |
| UBF | 2.75B CAD |
| CRTC target | 50/10 Mbps by 2030 |
| Bill C-11 | Assent Apr 2023 |
What is included in the product
 Detailed Word Document
Explores how Political, Economic, Social, Technological, Environmental, and Legal factors uniquely affect BCE, with each section grounded in current data and market/regulatory trends. Designed for executives and investors, it highlights threats and opportunities, offers forward-looking insights for scenario planning, and is formatted for direct use in plans, decks, or reports.

 Customizable Excel Spreadsheet
Concise, visually segmented BCE PESTLE summary that can be dropped into presentations, annotated with regional or business-line notes, and easily shared to accelerate team alignment on regulatory, technological, and market risks.
Economic factors

Macroeconomy and consumer spend
Canada's GDP growth slowed to about 1.4% in 2024 while unemployment hovered near 5.2% and CPI eased to roughly 3.0%, constraining disposable income and moderating subscriber growth and ARPU pressure for BCE. Wireless and broadband show lower sensitivity to cycles—connectivity is essential—whereas media ad revenues and discretionary TV subscriptions track cyclical demand and decline faster in downturns. Inflationary periods have supported modest pricing power for core connectivity services, helping limit churn.
Inflation, rates, and capex
Rising inflation and Bank of Canada hikes raise BCE’s cost of capital, pushing borrowing spreads and increasing spectrum financing costs after recent auctions (~C$4–5bn licenses) and raising network build CPI-driven input costs for fiber/5G. Higher rates amplify debt servicing on BCE’s ~C$26bn net debt and heighten refinancing risk for large maturities through 2026–28. Management faces trade-offs between sustaining a ~5.5% dividend yield and pacing capex (C$3.5–4.0bn annual guidance) for fiber/5G rollout.

Exchange rates and equipment costs
With USD/CAD around 1.36 (July 2025), a stronger USD raises CAD costs for imported network gear, handsets and many content rights, squeezing BCE input costs. BCE routinely uses FX hedges for large capex and programming contracts and attempts pricing pass-through via rate plans and wholesale; pass-through lag varies. Longer vendor lead times (~6–9 months) and reliance on Ericsson/Nokia raise supply risk and capex timing. Wireline margins face higher capital intensity vs wireless, which yields quicker ARPU passthrough.

Advertising and media cycles
Ad market swings drive TV, radio and digital revenue volatility: global ad spend ~US$900B in 2024, with programmatic purchasing exceeding 70% of display and CTV rising fast, shifting budgets to performance and addressable buys and shortening campaign cycles; seasonality (sports/news) creates Q3–Q4 ad peaks and macro shocks (recession/CPIs) quickly cut spot buys; BCE offsets risk via subscriptions (Crave) and affiliate/carriage fees to stabilize cash flow.
- programmatic: >70% display
- CTV: large double-digit growth
- seasonality: sports/news Q3–Q4 spikes
- diversification: subscriptions + affiliate fees
Competition and market structure
BCE faces intense rivalry from Rogers and Telus (each ~31–33% wireless share) and growing pressure from cablecos (Shaw/Videotron) via aggressive bundling and promotions; MVNO entries increase price sensitivity and churn. Fixed-wireless substitution (FWA) is compressing urban broadband pricing while improving rural coverage economics, creating divergent urban vs rural profitability dynamics.
- National peers ~31–33% share
- Cablecos driving quad-play bundles
- MVNOs raising price sensitivity
- FWA compresses urban prices, aids rural reach
CRTC rules, ~90% Big Three share, Bill C-11 and UBF reshape Canadian telecom economics
Slow GDP (≈1.4% in 2024), 5.2% unemployment and CPI ≈3.0% have constrained ARPU growth but kept connectivity resilient; inflation and BoC hikes raised BCE’s cost of capital, stressing ~C$26bn net debt and refinancing into 2026–28. Capex guidance C$3.5–4.0bn and recent spectrum ~C$4–5bn increase funding needs; USD/CAD ≈1.36 lifts imported gear costs.
| Metric | Value |
|---|---|
| GDP 2024 | ≈1.4% |
| Unemployment | ≈5.2% |
| CPI | ≈3.0% |
| Net debt | ≈C$26bn |
| Capex guide | C$3.5–4.0bn |
| USD/CAD (Jul 2025) | ≈1.36 |
Preview the Actual Deliverable
BCE PESTLE Analysis
The BCE PESTLE Analysis preview shown here is the exact document you’ll receive after purchase—fully formatted and ready to use. It contains the complete political, economic, social, technological, legal, and environmental assessment with no placeholders or teasers. The structure, charts, and findings are identical to the downloadable file you’ll get immediately after checkout.

Your Competitive Advantage Starts with This Report
Gain a strategic advantage with our PESTLE analysis of BCE — concise, evidence-based insights into political, economic, social, technological, legal and environmental forces shaping the company. Ideal for investors and strategists, it translates external trends into actionable risks and opportunities. Purchase the full report for the complete, editable breakdown and immediate download.
Political factors
CRTC and policy oversight
CRTC and federal telecom rules directly shape BCE pricing, wholesale access, media carriage and investment choices through decisions on MVNO access, wholesale rates and net neutrality enforcement; Canada’s Big Three (Bell, Rogers, Telus) hold roughly 90% of wireless market share, magnifying regulatory impact. CRTC rulings on MVNO access and wholesale fiber pricing alter margin and capital allocation, forcing trade-offs between consumer protections and incentives for BCE’s CAD-denominated infrastructure capex and bundled telecom-media strategies.
Spectrum allocation and auctions
Federal spectrum policy and ISED auction timing for mid-band 3.5 GHz licences shape BCE’s 5G capacity, coverage and capital allocation by forcing trade-offs between licence fees, deployment obligations and rural build conditions; set-asides and high reserve prices can raise CAPEX and delay densification. License fees and rural deployment clauses drive timing of site rollout while spectrum sharing and refarming of 700/2600 MHz boost capacity cost‑efficiently. Competitive positioning versus Rogers, Telus and regional carriers depends on auction outcomes and existing holdings, where earlier mid-band wins accelerate urban coverage and wholesale edge advantages.
Canadian content and media policy
Bill C-11 (Online Streaming Act) received royal assent April 2023 and CRTC rulemaking continued through 2024–25 to set Canadian content funding, discoverability and carriage obligations for online undertakings; impacts Bell Media/Crave include potential higher Canadian content spend and mandated placement that could raise programming costs and shift ad revenue mix versus digital platforms; regulators are also probing cross-ownership limits and mandatory financial contributions from non‑Canadian streamers.
Public funding and rural connectivity
Federal Universal Broadband Fund totals 2.75 billion CAD, and the CRTC universal service objective of 50/10 Mbps by 2030 makes digital inclusion a stated political priority; these subsidies lower rural build economics and boost BCE’s coverage and reputational capital while imposing compliance milestones and reporting costs.
- Public funding: 2.75B CAD UBF
- Policy target: CRTC 50/10 Mbps by 2030
- Benefit: improved coverage, PR, customer retention
- Cost: compliance, milestone risk
- Opportunity: municipal co-funding, PPPs
Foreign ownership and national security
Foreign ownership is constrained by Investment Canada Act reviews and national security assessments; Ottawa reiterated in 2024 its exclusion of high-risk vendors following the 2022 Huawei/ZTE decisions, increasing vendor scrutiny and contractual risk for BCE. This raises 5G vendor-selection complexity and can elevate procurement and integration costs, while US–China geopolitical shifts influence supplier pools and roaming agreements.
- Regulatory: Investment Canada Act reviews
- Vendors: Huawei/ZTE flagged high-risk (post-2022)
- Cost: higher procurement/ integration risk
- Geopolitics: US–China tensions affect roaming/procurement
CRTC rules, ~90% Big Three share, Bill C-11 and UBF reshape Canadian telecom economics
CRTC rules, MVNO/wholesale decisions and net neutrality shape BCE pricing, margins and capex; Canada’s Big Three hold ~90% wireless share amplifying regulatory effects. Bill C-11 (royal assent Apr 2023) raises Canadian content spend for Bell Media/Crave. Federal UBF is 2.75B CAD and CRTC target 50/10 Mbps by 2030 aids rural rollout. Investment Canada Act reviews and post‑2022 Huawei/ZTE vendor exclusions raise 5G vendor risk.
| Item | Value |
|---|---|
| Wireless market share (Big 3) | ~90% |
| UBF | 2.75B CAD |
| CRTC target | 50/10 Mbps by 2030 |
| Bill C-11 | Assent Apr 2023 |
What is included in the product
Detailed Word Document
Explores how Political, Economic, Social, Technological, Environmental, and Legal factors uniquely affect BCE, with each section grounded in current data and market/regulatory trends. Designed for executives and investors, it highlights threats and opportunities, offers forward-looking insights for scenario planning, and is formatted for direct use in plans, decks, or reports.
Customizable Excel Spreadsheet
Concise, visually segmented BCE PESTLE summary that can be dropped into presentations, annotated with regional or business-line notes, and easily shared to accelerate team alignment on regulatory, technological, and market risks.
Economic factors
Macroeconomy and consumer spend
Canada's GDP growth slowed to about 1.4% in 2024 while unemployment hovered near 5.2% and CPI eased to roughly 3.0%, constraining disposable income and moderating subscriber growth and ARPU pressure for BCE. Wireless and broadband show lower sensitivity to cycles—connectivity is essential—whereas media ad revenues and discretionary TV subscriptions track cyclical demand and decline faster in downturns. Inflationary periods have supported modest pricing power for core connectivity services, helping limit churn.
Inflation, rates, and capex
Rising inflation and Bank of Canada hikes raise BCE’s cost of capital, pushing borrowing spreads and increasing spectrum financing costs after recent auctions (~C$4–5bn licenses) and raising network build CPI-driven input costs for fiber/5G. Higher rates amplify debt servicing on BCE’s ~C$26bn net debt and heighten refinancing risk for large maturities through 2026–28. Management faces trade-offs between sustaining a ~5.5% dividend yield and pacing capex (C$3.5–4.0bn annual guidance) for fiber/5G rollout.
Exchange rates and equipment costs
With USD/CAD around 1.36 (July 2025), a stronger USD raises CAD costs for imported network gear, handsets and many content rights, squeezing BCE input costs. BCE routinely uses FX hedges for large capex and programming contracts and attempts pricing pass-through via rate plans and wholesale; pass-through lag varies. Longer vendor lead times (~6–9 months) and reliance on Ericsson/Nokia raise supply risk and capex timing. Wireline margins face higher capital intensity vs wireless, which yields quicker ARPU passthrough.
Advertising and media cycles
Ad market swings drive TV, radio and digital revenue volatility: global ad spend ~US$900B in 2024, with programmatic purchasing exceeding 70% of display and CTV rising fast, shifting budgets to performance and addressable buys and shortening campaign cycles; seasonality (sports/news) creates Q3–Q4 ad peaks and macro shocks (recession/CPIs) quickly cut spot buys; BCE offsets risk via subscriptions (Crave) and affiliate/carriage fees to stabilize cash flow.
- programmatic: >70% display
- CTV: large double-digit growth
- seasonality: sports/news Q3–Q4 spikes
- diversification: subscriptions + affiliate fees
Competition and market structure
BCE faces intense rivalry from Rogers and Telus (each ~31–33% wireless share) and growing pressure from cablecos (Shaw/Videotron) via aggressive bundling and promotions; MVNO entries increase price sensitivity and churn. Fixed-wireless substitution (FWA) is compressing urban broadband pricing while improving rural coverage economics, creating divergent urban vs rural profitability dynamics.
- National peers ~31–33% share
- Cablecos driving quad-play bundles
- MVNOs raising price sensitivity
- FWA compresses urban prices, aids rural reach
CRTC rules, ~90% Big Three share, Bill C-11 and UBF reshape Canadian telecom economics
Slow GDP (≈1.4% in 2024), 5.2% unemployment and CPI ≈3.0% have constrained ARPU growth but kept connectivity resilient; inflation and BoC hikes raised BCE’s cost of capital, stressing ~C$26bn net debt and refinancing into 2026–28. Capex guidance C$3.5–4.0bn and recent spectrum ~C$4–5bn increase funding needs; USD/CAD ≈1.36 lifts imported gear costs.
| Metric | Value |
|---|---|
| GDP 2024 | ≈1.4% |
| Unemployment | ≈5.2% |
| CPI | ≈3.0% |
| Net debt | ≈C$26bn |
| Capex guide | C$3.5–4.0bn |
| USD/CAD (Jul 2025) | ≈1.36 |
Preview the Actual Deliverable
BCE PESTLE Analysis
The BCE PESTLE Analysis preview shown here is the exact document you’ll receive after purchase—fully formatted and ready to use. It contains the complete political, economic, social, technological, legal, and environmental assessment with no placeholders or teasers. The structure, charts, and findings are identical to the downloadable file you’ll get immediately after checkout.
Original: $10.00
-65%$10.00
$3.50Description
Your Competitive Advantage Starts with This Report
Gain a strategic advantage with our PESTLE analysis of BCE — concise, evidence-based insights into political, economic, social, technological, legal and environmental forces shaping the company. Ideal for investors and strategists, it translates external trends into actionable risks and opportunities. Purchase the full report for the complete, editable breakdown and immediate download.
Political factors
CRTC and policy oversight
CRTC and federal telecom rules directly shape BCE pricing, wholesale access, media carriage and investment choices through decisions on MVNO access, wholesale rates and net neutrality enforcement; Canada’s Big Three (Bell, Rogers, Telus) hold roughly 90% of wireless market share, magnifying regulatory impact. CRTC rulings on MVNO access and wholesale fiber pricing alter margin and capital allocation, forcing trade-offs between consumer protections and incentives for BCE’s CAD-denominated infrastructure capex and bundled telecom-media strategies.
Spectrum allocation and auctions
Federal spectrum policy and ISED auction timing for mid-band 3.5 GHz licences shape BCE’s 5G capacity, coverage and capital allocation by forcing trade-offs between licence fees, deployment obligations and rural build conditions; set-asides and high reserve prices can raise CAPEX and delay densification. License fees and rural deployment clauses drive timing of site rollout while spectrum sharing and refarming of 700/2600 MHz boost capacity cost‑efficiently. Competitive positioning versus Rogers, Telus and regional carriers depends on auction outcomes and existing holdings, where earlier mid-band wins accelerate urban coverage and wholesale edge advantages.
Canadian content and media policy
Bill C-11 (Online Streaming Act) received royal assent April 2023 and CRTC rulemaking continued through 2024–25 to set Canadian content funding, discoverability and carriage obligations for online undertakings; impacts Bell Media/Crave include potential higher Canadian content spend and mandated placement that could raise programming costs and shift ad revenue mix versus digital platforms; regulators are also probing cross-ownership limits and mandatory financial contributions from non‑Canadian streamers.
Public funding and rural connectivity
Federal Universal Broadband Fund totals 2.75 billion CAD, and the CRTC universal service objective of 50/10 Mbps by 2030 makes digital inclusion a stated political priority; these subsidies lower rural build economics and boost BCE’s coverage and reputational capital while imposing compliance milestones and reporting costs.
- Public funding: 2.75B CAD UBF
- Policy target: CRTC 50/10 Mbps by 2030
- Benefit: improved coverage, PR, customer retention
- Cost: compliance, milestone risk
- Opportunity: municipal co-funding, PPPs
Foreign ownership and national security
Foreign ownership is constrained by Investment Canada Act reviews and national security assessments; Ottawa reiterated in 2024 its exclusion of high-risk vendors following the 2022 Huawei/ZTE decisions, increasing vendor scrutiny and contractual risk for BCE. This raises 5G vendor-selection complexity and can elevate procurement and integration costs, while US–China geopolitical shifts influence supplier pools and roaming agreements.
- Regulatory: Investment Canada Act reviews
- Vendors: Huawei/ZTE flagged high-risk (post-2022)
- Cost: higher procurement/ integration risk
- Geopolitics: US–China tensions affect roaming/procurement
CRTC rules, ~90% Big Three share, Bill C-11 and UBF reshape Canadian telecom economics
CRTC rules, MVNO/wholesale decisions and net neutrality shape BCE pricing, margins and capex; Canada’s Big Three hold ~90% wireless share amplifying regulatory effects. Bill C-11 (royal assent Apr 2023) raises Canadian content spend for Bell Media/Crave. Federal UBF is 2.75B CAD and CRTC target 50/10 Mbps by 2030 aids rural rollout. Investment Canada Act reviews and post‑2022 Huawei/ZTE vendor exclusions raise 5G vendor risk.
| Item | Value |
|---|---|
| Wireless market share (Big 3) | ~90% |
| UBF | 2.75B CAD |
| CRTC target | 50/10 Mbps by 2030 |
| Bill C-11 | Assent Apr 2023 |
What is included in the product
Detailed Word Document
Explores how Political, Economic, Social, Technological, Environmental, and Legal factors uniquely affect BCE, with each section grounded in current data and market/regulatory trends. Designed for executives and investors, it highlights threats and opportunities, offers forward-looking insights for scenario planning, and is formatted for direct use in plans, decks, or reports.
Customizable Excel Spreadsheet
Concise, visually segmented BCE PESTLE summary that can be dropped into presentations, annotated with regional or business-line notes, and easily shared to accelerate team alignment on regulatory, technological, and market risks.
Economic factors
Macroeconomy and consumer spend
Canada's GDP growth slowed to about 1.4% in 2024 while unemployment hovered near 5.2% and CPI eased to roughly 3.0%, constraining disposable income and moderating subscriber growth and ARPU pressure for BCE. Wireless and broadband show lower sensitivity to cycles—connectivity is essential—whereas media ad revenues and discretionary TV subscriptions track cyclical demand and decline faster in downturns. Inflationary periods have supported modest pricing power for core connectivity services, helping limit churn.
Inflation, rates, and capex
Rising inflation and Bank of Canada hikes raise BCE’s cost of capital, pushing borrowing spreads and increasing spectrum financing costs after recent auctions (~C$4–5bn licenses) and raising network build CPI-driven input costs for fiber/5G. Higher rates amplify debt servicing on BCE’s ~C$26bn net debt and heighten refinancing risk for large maturities through 2026–28. Management faces trade-offs between sustaining a ~5.5% dividend yield and pacing capex (C$3.5–4.0bn annual guidance) for fiber/5G rollout.
Exchange rates and equipment costs
With USD/CAD around 1.36 (July 2025), a stronger USD raises CAD costs for imported network gear, handsets and many content rights, squeezing BCE input costs. BCE routinely uses FX hedges for large capex and programming contracts and attempts pricing pass-through via rate plans and wholesale; pass-through lag varies. Longer vendor lead times (~6–9 months) and reliance on Ericsson/Nokia raise supply risk and capex timing. Wireline margins face higher capital intensity vs wireless, which yields quicker ARPU passthrough.
Advertising and media cycles
Ad market swings drive TV, radio and digital revenue volatility: global ad spend ~US$900B in 2024, with programmatic purchasing exceeding 70% of display and CTV rising fast, shifting budgets to performance and addressable buys and shortening campaign cycles; seasonality (sports/news) creates Q3–Q4 ad peaks and macro shocks (recession/CPIs) quickly cut spot buys; BCE offsets risk via subscriptions (Crave) and affiliate/carriage fees to stabilize cash flow.
- programmatic: >70% display
- CTV: large double-digit growth
- seasonality: sports/news Q3–Q4 spikes
- diversification: subscriptions + affiliate fees
Competition and market structure
BCE faces intense rivalry from Rogers and Telus (each ~31–33% wireless share) and growing pressure from cablecos (Shaw/Videotron) via aggressive bundling and promotions; MVNO entries increase price sensitivity and churn. Fixed-wireless substitution (FWA) is compressing urban broadband pricing while improving rural coverage economics, creating divergent urban vs rural profitability dynamics.
- National peers ~31–33% share
- Cablecos driving quad-play bundles
- MVNOs raising price sensitivity
- FWA compresses urban prices, aids rural reach
CRTC rules, ~90% Big Three share, Bill C-11 and UBF reshape Canadian telecom economics
Slow GDP (≈1.4% in 2024), 5.2% unemployment and CPI ≈3.0% have constrained ARPU growth but kept connectivity resilient; inflation and BoC hikes raised BCE’s cost of capital, stressing ~C$26bn net debt and refinancing into 2026–28. Capex guidance C$3.5–4.0bn and recent spectrum ~C$4–5bn increase funding needs; USD/CAD ≈1.36 lifts imported gear costs.
| Metric | Value |
|---|---|
| GDP 2024 | ≈1.4% |
| Unemployment | ≈5.2% |
| CPI | ≈3.0% |
| Net debt | ≈C$26bn |
| Capex guide | C$3.5–4.0bn |
| USD/CAD (Jul 2025) | ≈1.36 |
Preview the Actual Deliverable
BCE PESTLE Analysis
The BCE PESTLE Analysis preview shown here is the exact document you’ll receive after purchase—fully formatted and ready to use. It contains the complete political, economic, social, technological, legal, and environmental assessment with no placeholders or teasers. The structure, charts, and findings are identical to the downloadable file you’ll get immediately after checkout.











