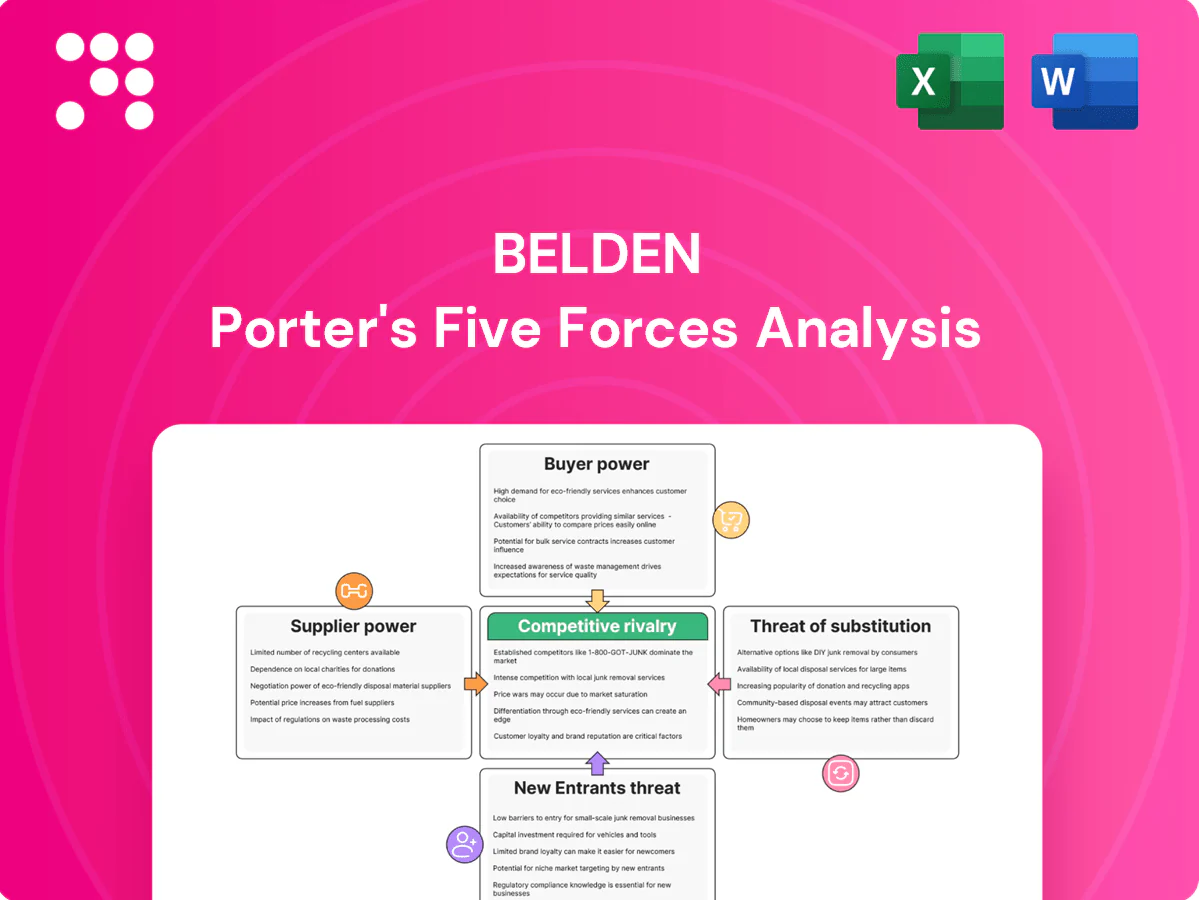
Belden Porter's Five Forces Analysis

Go Beyond the Preview—Access the Full Strategic Report
Belden’s Porter's Five Forces snapshot highlights supplier concentration, moderate buyer power, substitution risks from wireless solutions, and competitive rivalry shaping margins. Strategic positioning hinges on network performance and customer lock-in. Unlock the full Porter's Five Forces Analysis to explore Belden’s competitive dynamics and actionable insights in detail.
Suppliers Bargaining Power

Specialized materials dependency
Belden depends on high-spec copper, advanced polymers, fiber and semiconductors where qualified suppliers are limited, concentrating supply risk. Fewer approved vendors for mission-critical specs increases supplier leverage and pricing power. Lengthy qualification cycles materially raise switching costs and constrain response time. Long-term agreements mitigate but do not eliminate sourcing and input volatility.
Commodity price volatility
Copper and petrochemical input cost swings — copper spot volatility near 20% in 2024 and petrochemical feedstock fluctuations of similar magnitude — allow suppliers to pass costs through, squeezing Belden when hedges or surcharges lag market moves. Timing mismatches between procurement hedges and customer surcharges compress gross margins in the short term. In tight supply markets suppliers gain negotiating leverage, though Belden’s scale buying and long-term contracts partially offset volatility.

Quality and certification gatekeeping
Suppliers meeting UL/IEC and industrial-grade standards wield bargaining power because compliance hurdles create high entry barriers; certification lead times commonly run 6–18 months. Requalification for OEMs typically costs tens of thousands of dollars and consumes engineering hours, discouraging rapid switching. For harsh-environment components only a small set of vendors meet required reliability thresholds, concentrating power upstream.

Logistics and lead-time constraints
Global supply-chain constraints—chip lead times averaging ~14 weeks in 2024 and long-delivery fiber components—limit availability; when capacity is tight, suppliers often prioritize strategic accounts (top ~20% of revenue), forcing buyers into expensive expedited logistics that can cost 4–6× sea freight and raise dependency; dual sourcing lowers but does not eliminate exposure.
- Chip lead times ~14 weeks (2024)
- Strategic customers prioritized (~top 20%)
- Expedited freight 4–6× sea cost
- Dual sourcing reduces but not removes risk
Counterweights: scale and design authority
Belden’s scale—2024 net sales about $2.0 billion—plus detailed engineering specs and forecasts let it standardize inputs and dilute supplier leverage; vendor-managed inventory and collaborative planning cut continuity risks and reduce lead-time variability. Designing for multi-source parts and using supplier scorecards enforce performance discipline and lower long-term dependence.
Supplier concentration, 14-week chip lead times and ~20% copper swings
Belden faces concentrated supplier power for copper, polymers, fiber and chips, raising price and availability risk; 2024 net sales ≈ $2.0B give partial offset. Long qualification (6–18 months) and requalification costs raise switching barriers; chip lead times (~14 weeks in 2024) and input volatility (copper ~20% 2024) enable supplier pass-throughs despite long-term contracts.
| Metric | 2024 |
|---|---|
| Net sales | $2.0B |
| Copper volatility | ~20% |
| Chip lead time | ~14 weeks |
| Top customer priority | Top ~20% |
| Expedited freight cost | 4–6× sea |
What is included in the product
 Detailed Word Document
Tailored Porter’s Five Forces analysis for Belden that uncovers competitive drivers, supplier and buyer power, threat of substitutes and entrants, and pinpoints disruptive forces and strategic levers to protect margins and guide tactical decisions.

 Customizable Excel Spreadsheet
A concise one-sheet Belden Porter's Five Forces summary that visualizes strategic pressure with a customizable radar chart—no macros, easy to edit, and copy-ready for decks, dashboards, or boardroom decisions.
Customers Bargaining Power

Large OEMs and integrators
Industrial OEMs, system integrators and enterprises issue formal RFPs and buy at scale—often exceeding $1m per project—securing price concessions and demanding stringent SLAs. Framework agreements and blanket POs compress margins on commoditized SKUs, while bundling solutions and services can command 10–30% premiums versus standalone hardware. This shifts value capture from unit sales to integrated offerings.
Installed-base switching costs
Installed-base switching costs are high for Belden: once cabling and certified tooling are deployed they create stickiness—Belden reported about $2.4 billion net sales in 2024, reflecting large installed footprints. Downtime and requalification risk (IBM’s average breach/downtime impact ~$4.45 million) deter switches, moderating buyer power, though major upgrades reopen competition; lifecycle support and compatibility defend share.

Spec-driven procurement
Buyer specs for industrial Ethernet, PoE and broadcast narrowly define acceptable vendors, so being designed-in creates multi-year stickiness and materially reduces churn and price sensitivity; in 2024 reference designs and approvals remained pivotal to procurement decisions. Conversely, open standards increase supplier comparability and price pressure, accelerating switch-outs when total cost advantages exceed switching costs.

Channel and distributor influence
Distribution partners aggregate demand, shaping pricing and availability and often controlling over 50% of B2B industrial cabling order flow in 2024; if delivery or pricing slips they can substitute brands, directly pressuring margins. Programs, rebates and stock breadth drive end-buyer choices, while strong channel relationships and exclusive stocking agreements blunt buyer bargaining power.
- Demand aggregation: >50% channel control (2024)
- Substitution risk: rapid brand switching on fulfillment
- Incentives: rebates/programs steer end buyers
- Mitigation: exclusive stocking/strong partner ties
Total cost and reliability focus
Mission-critical users prioritize uptime (often targeting 99.999% five-nines), high MTBF (measured in 10^4–10^5+ hours) and ruggedization over lowest unit price; proven reliability reduces negotiation leverage and supports premium pricing. Comprehensive service, warranties and onsite support increase switching costs and documented TCO often decides procurement.
- Uptime target: 99.999%
- MTBF: 10,000–100,000+ hours
- Service/warranty lock-in
- Documented TCO wins bids
Buyers press price; bundles add 10-30%; 99.999% uptime locks customers
Buyers (industrial OEMs, integrators, enterprises) buy at scale, use RFPs and framework deals to extract concessions, but bundling and services can add 10–30% premiums. High installed-base switching costs (Belden ~$2.4B sales in 2024) and mission-critical uptime (99.999%) limit buyer leverage, though open standards and distributors (>50% channel control in 2024) sustain price pressure.
| Metric | 2024 |
|---|---|
| Belden net sales | $2.4B |
| Channel control | >50% |
| Premiums for bundles | 10–30% |
| Uptime target | 99.999% |
Preview Before You Purchase
Belden Porter's Five Forces Analysis
This preview shows the exact Belden Porter's Five Forces Analysis you'll receive immediately after purchase—no surprises, no placeholders. The document displayed here is the full, professionally formatted analysis ready for download and use the moment you buy. You're looking at the actual file; once you complete payment you’ll get instant access to this same deliverable. No mockups, no samples—what you see is what you get.

Go Beyond the Preview—Access the Full Strategic Report
Belden’s Porter's Five Forces snapshot highlights supplier concentration, moderate buyer power, substitution risks from wireless solutions, and competitive rivalry shaping margins. Strategic positioning hinges on network performance and customer lock-in. Unlock the full Porter's Five Forces Analysis to explore Belden’s competitive dynamics and actionable insights in detail.
Suppliers Bargaining Power
Specialized materials dependency
Belden depends on high-spec copper, advanced polymers, fiber and semiconductors where qualified suppliers are limited, concentrating supply risk. Fewer approved vendors for mission-critical specs increases supplier leverage and pricing power. Lengthy qualification cycles materially raise switching costs and constrain response time. Long-term agreements mitigate but do not eliminate sourcing and input volatility.
Commodity price volatility
Copper and petrochemical input cost swings — copper spot volatility near 20% in 2024 and petrochemical feedstock fluctuations of similar magnitude — allow suppliers to pass costs through, squeezing Belden when hedges or surcharges lag market moves. Timing mismatches between procurement hedges and customer surcharges compress gross margins in the short term. In tight supply markets suppliers gain negotiating leverage, though Belden’s scale buying and long-term contracts partially offset volatility.
Quality and certification gatekeeping
Suppliers meeting UL/IEC and industrial-grade standards wield bargaining power because compliance hurdles create high entry barriers; certification lead times commonly run 6–18 months. Requalification for OEMs typically costs tens of thousands of dollars and consumes engineering hours, discouraging rapid switching. For harsh-environment components only a small set of vendors meet required reliability thresholds, concentrating power upstream.
Logistics and lead-time constraints
Global supply-chain constraints—chip lead times averaging ~14 weeks in 2024 and long-delivery fiber components—limit availability; when capacity is tight, suppliers often prioritize strategic accounts (top ~20% of revenue), forcing buyers into expensive expedited logistics that can cost 4–6× sea freight and raise dependency; dual sourcing lowers but does not eliminate exposure.
- Chip lead times ~14 weeks (2024)
- Strategic customers prioritized (~top 20%)
- Expedited freight 4–6× sea cost
- Dual sourcing reduces but not removes risk
Counterweights: scale and design authority
Belden’s scale—2024 net sales about $2.0 billion—plus detailed engineering specs and forecasts let it standardize inputs and dilute supplier leverage; vendor-managed inventory and collaborative planning cut continuity risks and reduce lead-time variability. Designing for multi-source parts and using supplier scorecards enforce performance discipline and lower long-term dependence.
Supplier concentration, 14-week chip lead times and ~20% copper swings
Belden faces concentrated supplier power for copper, polymers, fiber and chips, raising price and availability risk; 2024 net sales ≈ $2.0B give partial offset. Long qualification (6–18 months) and requalification costs raise switching barriers; chip lead times (~14 weeks in 2024) and input volatility (copper ~20% 2024) enable supplier pass-throughs despite long-term contracts.
| Metric | 2024 |
|---|---|
| Net sales | $2.0B |
| Copper volatility | ~20% |
| Chip lead time | ~14 weeks |
| Top customer priority | Top ~20% |
| Expedited freight cost | 4–6× sea |
What is included in the product
Detailed Word Document
Tailored Porter’s Five Forces analysis for Belden that uncovers competitive drivers, supplier and buyer power, threat of substitutes and entrants, and pinpoints disruptive forces and strategic levers to protect margins and guide tactical decisions.
Customizable Excel Spreadsheet
A concise one-sheet Belden Porter's Five Forces summary that visualizes strategic pressure with a customizable radar chart—no macros, easy to edit, and copy-ready for decks, dashboards, or boardroom decisions.
Customers Bargaining Power
Large OEMs and integrators
Industrial OEMs, system integrators and enterprises issue formal RFPs and buy at scale—often exceeding $1m per project—securing price concessions and demanding stringent SLAs. Framework agreements and blanket POs compress margins on commoditized SKUs, while bundling solutions and services can command 10–30% premiums versus standalone hardware. This shifts value capture from unit sales to integrated offerings.
Installed-base switching costs
Installed-base switching costs are high for Belden: once cabling and certified tooling are deployed they create stickiness—Belden reported about $2.4 billion net sales in 2024, reflecting large installed footprints. Downtime and requalification risk (IBM’s average breach/downtime impact ~$4.45 million) deter switches, moderating buyer power, though major upgrades reopen competition; lifecycle support and compatibility defend share.
Spec-driven procurement
Buyer specs for industrial Ethernet, PoE and broadcast narrowly define acceptable vendors, so being designed-in creates multi-year stickiness and materially reduces churn and price sensitivity; in 2024 reference designs and approvals remained pivotal to procurement decisions. Conversely, open standards increase supplier comparability and price pressure, accelerating switch-outs when total cost advantages exceed switching costs.
Channel and distributor influence
Distribution partners aggregate demand, shaping pricing and availability and often controlling over 50% of B2B industrial cabling order flow in 2024; if delivery or pricing slips they can substitute brands, directly pressuring margins. Programs, rebates and stock breadth drive end-buyer choices, while strong channel relationships and exclusive stocking agreements blunt buyer bargaining power.
- Demand aggregation: >50% channel control (2024)
- Substitution risk: rapid brand switching on fulfillment
- Incentives: rebates/programs steer end buyers
- Mitigation: exclusive stocking/strong partner ties
Total cost and reliability focus
Mission-critical users prioritize uptime (often targeting 99.999% five-nines), high MTBF (measured in 10^4–10^5+ hours) and ruggedization over lowest unit price; proven reliability reduces negotiation leverage and supports premium pricing. Comprehensive service, warranties and onsite support increase switching costs and documented TCO often decides procurement.
- Uptime target: 99.999%
- MTBF: 10,000–100,000+ hours
- Service/warranty lock-in
- Documented TCO wins bids
Buyers press price; bundles add 10-30%; 99.999% uptime locks customers
Buyers (industrial OEMs, integrators, enterprises) buy at scale, use RFPs and framework deals to extract concessions, but bundling and services can add 10–30% premiums. High installed-base switching costs (Belden ~$2.4B sales in 2024) and mission-critical uptime (99.999%) limit buyer leverage, though open standards and distributors (>50% channel control in 2024) sustain price pressure.
| Metric | 2024 |
|---|---|
| Belden net sales | $2.4B |
| Channel control | >50% |
| Premiums for bundles | 10–30% |
| Uptime target | 99.999% |
Preview Before You Purchase
Belden Porter's Five Forces Analysis
This preview shows the exact Belden Porter's Five Forces Analysis you'll receive immediately after purchase—no surprises, no placeholders. The document displayed here is the full, professionally formatted analysis ready for download and use the moment you buy. You're looking at the actual file; once you complete payment you’ll get instant access to this same deliverable. No mockups, no samples—what you see is what you get.
Original: $10.00
-65%$10.00
$3.50Description
Go Beyond the Preview—Access the Full Strategic Report
Belden’s Porter's Five Forces snapshot highlights supplier concentration, moderate buyer power, substitution risks from wireless solutions, and competitive rivalry shaping margins. Strategic positioning hinges on network performance and customer lock-in. Unlock the full Porter's Five Forces Analysis to explore Belden’s competitive dynamics and actionable insights in detail.
Suppliers Bargaining Power
Specialized materials dependency
Belden depends on high-spec copper, advanced polymers, fiber and semiconductors where qualified suppliers are limited, concentrating supply risk. Fewer approved vendors for mission-critical specs increases supplier leverage and pricing power. Lengthy qualification cycles materially raise switching costs and constrain response time. Long-term agreements mitigate but do not eliminate sourcing and input volatility.
Commodity price volatility
Copper and petrochemical input cost swings — copper spot volatility near 20% in 2024 and petrochemical feedstock fluctuations of similar magnitude — allow suppliers to pass costs through, squeezing Belden when hedges or surcharges lag market moves. Timing mismatches between procurement hedges and customer surcharges compress gross margins in the short term. In tight supply markets suppliers gain negotiating leverage, though Belden’s scale buying and long-term contracts partially offset volatility.
Quality and certification gatekeeping
Suppliers meeting UL/IEC and industrial-grade standards wield bargaining power because compliance hurdles create high entry barriers; certification lead times commonly run 6–18 months. Requalification for OEMs typically costs tens of thousands of dollars and consumes engineering hours, discouraging rapid switching. For harsh-environment components only a small set of vendors meet required reliability thresholds, concentrating power upstream.
Logistics and lead-time constraints
Global supply-chain constraints—chip lead times averaging ~14 weeks in 2024 and long-delivery fiber components—limit availability; when capacity is tight, suppliers often prioritize strategic accounts (top ~20% of revenue), forcing buyers into expensive expedited logistics that can cost 4–6× sea freight and raise dependency; dual sourcing lowers but does not eliminate exposure.
- Chip lead times ~14 weeks (2024)
- Strategic customers prioritized (~top 20%)
- Expedited freight 4–6× sea cost
- Dual sourcing reduces but not removes risk
Counterweights: scale and design authority
Belden’s scale—2024 net sales about $2.0 billion—plus detailed engineering specs and forecasts let it standardize inputs and dilute supplier leverage; vendor-managed inventory and collaborative planning cut continuity risks and reduce lead-time variability. Designing for multi-source parts and using supplier scorecards enforce performance discipline and lower long-term dependence.
Supplier concentration, 14-week chip lead times and ~20% copper swings
Belden faces concentrated supplier power for copper, polymers, fiber and chips, raising price and availability risk; 2024 net sales ≈ $2.0B give partial offset. Long qualification (6–18 months) and requalification costs raise switching barriers; chip lead times (~14 weeks in 2024) and input volatility (copper ~20% 2024) enable supplier pass-throughs despite long-term contracts.
| Metric | 2024 |
|---|---|
| Net sales | $2.0B |
| Copper volatility | ~20% |
| Chip lead time | ~14 weeks |
| Top customer priority | Top ~20% |
| Expedited freight cost | 4–6× sea |
What is included in the product
Detailed Word Document
Tailored Porter’s Five Forces analysis for Belden that uncovers competitive drivers, supplier and buyer power, threat of substitutes and entrants, and pinpoints disruptive forces and strategic levers to protect margins and guide tactical decisions.
Customizable Excel Spreadsheet
A concise one-sheet Belden Porter's Five Forces summary that visualizes strategic pressure with a customizable radar chart—no macros, easy to edit, and copy-ready for decks, dashboards, or boardroom decisions.
Customers Bargaining Power
Large OEMs and integrators
Industrial OEMs, system integrators and enterprises issue formal RFPs and buy at scale—often exceeding $1m per project—securing price concessions and demanding stringent SLAs. Framework agreements and blanket POs compress margins on commoditized SKUs, while bundling solutions and services can command 10–30% premiums versus standalone hardware. This shifts value capture from unit sales to integrated offerings.
Installed-base switching costs
Installed-base switching costs are high for Belden: once cabling and certified tooling are deployed they create stickiness—Belden reported about $2.4 billion net sales in 2024, reflecting large installed footprints. Downtime and requalification risk (IBM’s average breach/downtime impact ~$4.45 million) deter switches, moderating buyer power, though major upgrades reopen competition; lifecycle support and compatibility defend share.
Spec-driven procurement
Buyer specs for industrial Ethernet, PoE and broadcast narrowly define acceptable vendors, so being designed-in creates multi-year stickiness and materially reduces churn and price sensitivity; in 2024 reference designs and approvals remained pivotal to procurement decisions. Conversely, open standards increase supplier comparability and price pressure, accelerating switch-outs when total cost advantages exceed switching costs.
Channel and distributor influence
Distribution partners aggregate demand, shaping pricing and availability and often controlling over 50% of B2B industrial cabling order flow in 2024; if delivery or pricing slips they can substitute brands, directly pressuring margins. Programs, rebates and stock breadth drive end-buyer choices, while strong channel relationships and exclusive stocking agreements blunt buyer bargaining power.
- Demand aggregation: >50% channel control (2024)
- Substitution risk: rapid brand switching on fulfillment
- Incentives: rebates/programs steer end buyers
- Mitigation: exclusive stocking/strong partner ties
Total cost and reliability focus
Mission-critical users prioritize uptime (often targeting 99.999% five-nines), high MTBF (measured in 10^4–10^5+ hours) and ruggedization over lowest unit price; proven reliability reduces negotiation leverage and supports premium pricing. Comprehensive service, warranties and onsite support increase switching costs and documented TCO often decides procurement.
- Uptime target: 99.999%
- MTBF: 10,000–100,000+ hours
- Service/warranty lock-in
- Documented TCO wins bids
Buyers press price; bundles add 10-30%; 99.999% uptime locks customers
Buyers (industrial OEMs, integrators, enterprises) buy at scale, use RFPs and framework deals to extract concessions, but bundling and services can add 10–30% premiums. High installed-base switching costs (Belden ~$2.4B sales in 2024) and mission-critical uptime (99.999%) limit buyer leverage, though open standards and distributors (>50% channel control in 2024) sustain price pressure.
| Metric | 2024 |
|---|---|
| Belden net sales | $2.4B |
| Channel control | >50% |
| Premiums for bundles | 10–30% |
| Uptime target | 99.999% |
Preview Before You Purchase
Belden Porter's Five Forces Analysis
This preview shows the exact Belden Porter's Five Forces Analysis you'll receive immediately after purchase—no surprises, no placeholders. The document displayed here is the full, professionally formatted analysis ready for download and use the moment you buy. You're looking at the actual file; once you complete payment you’ll get instant access to this same deliverable. No mockups, no samples—what you see is what you get.











