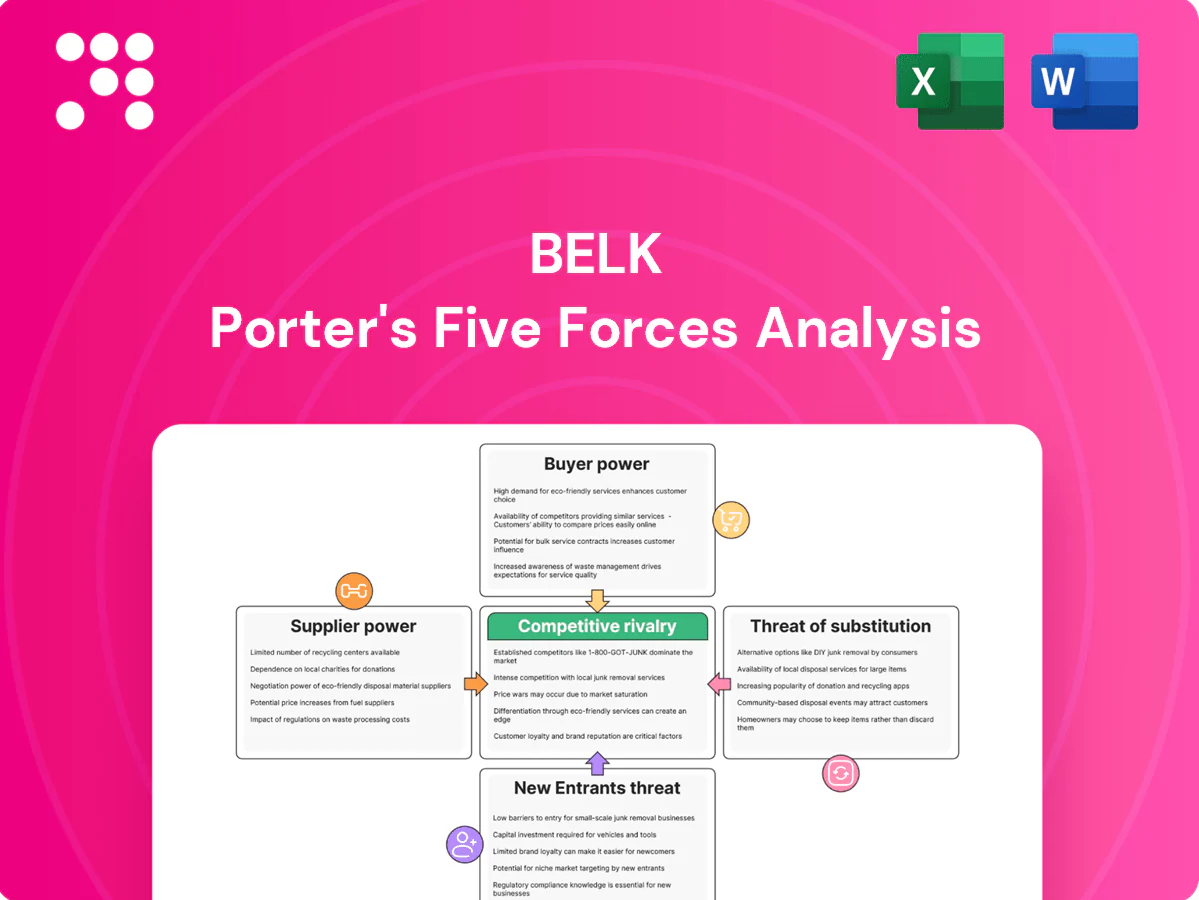
Belk Porter's Five Forces Analysis

From Overview to Strategy Blueprint
Belk faces moderate buyer power, limited supplier leverage, low threat of nationwide new entrants but strong pressure from omnichannel and discount rivals, and intense rivalry within department stores. Substitutes from specialty and online retailers raise strategic risk. This preview is just the beginning. The full analysis provides a complete strategic snapshot with force-by-force ratings, visuals, and business implications tailored to Belk.
Suppliers Bargaining Power

National brands wield leverage
Iconic apparel and beauty labels command shelf space, margins, and co-op marketing, and brands like Nike (FY24 revenue $51.6 billion) bring outsized retail leverage. Their consumer pull narrows Belk’s negotiating latitude on price and terms, especially in cosmetics and athletic wear. Losing a top brand risks measurable traffic declines and margin pressure for Belk.
Private label offsets dependence
Belk’s proprietary brands reduce reliance on external vendors and can boost gross margins, with private-label apparel capturing about 20% share of US apparel sales in 2024 per NielsenIQ, giving retailers more pricing control and differentiation. Successful private-label rollout hinges on design, sourcing and inventory risk management, and execution gaps can limit its ability to offset leverage held by national brands.

Supplier base fragmentation varies
Supplier base fragmentation varies: apparel vendors number in the thousands, enabling Belk to multi‑source and secure volume discounts, while beauty and premium footwear are more concentrated; in 2024 the US prestige beauty market was roughly $90B and leading footwear brands captured dominant shares, which raises supplier leverage where alternatives are limited. Category mix determines the net effect on procurement power.

Switching costs and lead times
Changing vendors requires testing quality, retooling assortments and resetting promotions, and fashion calendars with typical lead times of 12–16 weeks (2024 industry norm) prevent rapid shifts. These frictions create implicit switching costs that increase supplier leverage. Suppliers exploit timing around seasonal buys to negotiate higher prices or stricter terms.
- Testing & retooling delays
- 12–16 weeks lead time (2024)
- Implicit switching costs raise supplier bargaining power
- Suppliers time negotiations around seasonal peaks
Omnichannel and fulfillment terms
Omnichannel fulfillment arrangements—drop-ship and marketplace models—shift logistics costs and data sharing to vendors, who in 2024 increasingly demanded visibility, platform fees, and service-level protections as marketplaces drove roughly 60% of US online GMV; Belk gains assortment breadth but concedes margin and control. The balance of power hinges on vendor digital capabilities and integration speed, which determine carrier routing, return costs, and data monetization.
- Vendor visibility requirements
- Platform/fulfillment fees
- Margin compression for Belk
- Vendor digital maturity = leverage
National brands squeeze regional retailers: pricing, margins and digital cost pressures rise
Powerful national brands (eg Nike FY24 revenue 51.6B) and concentrated beauty/footwear suppliers tighten Belk’s pricing and terms, risking traffic and margin loss. Private-labels (~20% US apparel sales, NielsenIQ 2024) moderate dependence but need strong design, sourcing and inventory control. Lead times (12–16 weeks) and seasonal buying create switching frictions; vendor digital demands (marketplaces ~60% online GMV 2024) shift costs to Belk.
| Metric | Value (2024) |
|---|---|
| Nike revenue | 51.6B |
| Private-label apparel share | ~20% |
| US prestige beauty market | ~90B |
| Lead time | 12–16 weeks |
| Marketplace online GMV | ~60% |
What is included in the product
 Detailed Word Document
Tailored Porter's Five Forces analysis for Belk that uncovers competitive intensity, buyer and supplier power, substitution threats, and entry barriers, highlighting disruptive trends and strategic levers to protect market share and margin.

 Customizable Excel Spreadsheet
One-sheet Belk Porter’s Five Forces that pinpoints competitive pain points and opportunities—customizable pressure levels and a clean, slide-ready layout to speed strategic decisions and executive buy-in.
Customers Bargaining Power

Low switching costs for shoppers
Low switching costs let Belk shoppers compare and buy across rival department stores, specialty retailers and online channels as e-commerce now represents about 15% of US retail sales (Census trend into 2023–24), amplifying buyer leverage. Minimal friction and competitive returns—apparel online return rates run roughly 20–30%—make convenience and return policy pivotal for retaining baskets, and any service lapse accelerates churn.
High price sensitivity
Frequent promotions have trained Belk shoppers to wait for deals, with promo-driven transactions representing over 50% of apparel sales in recent retail studies (2024), compressing gross margins and boosting buyer power. Price-matching and couponing further ratchet discount expectations, forcing margin erosion and shifting purchase triggers toward perceived value rather than brand loyalty.

Abundant alternatives
Amazon held roughly 40% of US e-commerce sales in 2024, while omnichannel players like Walmart and Target plus off-price chains and brand DTC sites crowd consumers’ consideration sets. Category specialists provide depth and curated experiences, increasing comparison shopping. This abundance of choice strengthens buyers’ negotiating stance. Belk must differentiate on value, curation, and service.

Digital transparency
Real-time reviews and price checks raise consumer knowledge, with over 70% of shoppers using comparison tools in 2024; visibility into quality and availability reduces information asymmetry and lets buyers pivot quickly to better offers, reportedly causing ~65% to switch after finding a better price. Belk must maintain competitive pricing and credible ratings to protect share.
- Real-time reviews: >70% usage (2024)
- Switching rate: ~65% on better offers
- Implication: sustain competitive pricing + verified ratings
Loyalty moderates power selectively
Loyalty moderates buyer power: rewards, private-label credit and regional familiarity reduce price sensitivity and help Belk retain higher-margin sales, while personalized offers and targeted promotions can lift basket size and repeat visits; 2024 McKinsey data shows personalization can boost revenues 10–15%. Yet heavy external discounting quickly erodes loyalty—program richness and relevance are decisive for retention.
- Rewards: increase repeat rate 10–20% (2024 studies)
- Private-label credit: raises average ticket, improves stickiness
- Vulnerability: high promotional intensity causes rapid churn
Promo-led apparel, high returns and price-savvy shoppers squeeze retailer margins
Low switching costs and 15% e-commerce share (2023–24) plus 20–30% apparel return rates amplify buyer leverage; promo-driven apparel sales >50% (2024) compress margins. Amazon ~40% of US e-commerce (2024) and >70% shoppers use comparison tools, with ~65% switching for better offers, forcing Belk to compete on price, service and loyalty.
| Metric | 2024 |
|---|---|
| E‑com share | 15% |
| Amazon share | ~40% |
| Promo-driven apparel | >50% |
| Return rate | 20–30% |
| Comparison tool use | >70% |
| Switch on better price | ~65% |
Full Version Awaits
Belk Porter's Five Forces Analysis
This preview shows the exact Belk Porter’s Five Forces Analysis you’ll receive immediately after purchase—no surprises, no placeholders. The document displayed is fully formatted, professionally written, and ready to download and use the moment you buy. You’re viewing the final deliverable, identical to the file delivered upon payment.

From Overview to Strategy Blueprint
Belk faces moderate buyer power, limited supplier leverage, low threat of nationwide new entrants but strong pressure from omnichannel and discount rivals, and intense rivalry within department stores. Substitutes from specialty and online retailers raise strategic risk. This preview is just the beginning. The full analysis provides a complete strategic snapshot with force-by-force ratings, visuals, and business implications tailored to Belk.
Suppliers Bargaining Power
National brands wield leverage
Iconic apparel and beauty labels command shelf space, margins, and co-op marketing, and brands like Nike (FY24 revenue $51.6 billion) bring outsized retail leverage. Their consumer pull narrows Belk’s negotiating latitude on price and terms, especially in cosmetics and athletic wear. Losing a top brand risks measurable traffic declines and margin pressure for Belk.
Private label offsets dependence
Belk’s proprietary brands reduce reliance on external vendors and can boost gross margins, with private-label apparel capturing about 20% share of US apparel sales in 2024 per NielsenIQ, giving retailers more pricing control and differentiation. Successful private-label rollout hinges on design, sourcing and inventory risk management, and execution gaps can limit its ability to offset leverage held by national brands.
Supplier base fragmentation varies
Supplier base fragmentation varies: apparel vendors number in the thousands, enabling Belk to multi‑source and secure volume discounts, while beauty and premium footwear are more concentrated; in 2024 the US prestige beauty market was roughly $90B and leading footwear brands captured dominant shares, which raises supplier leverage where alternatives are limited. Category mix determines the net effect on procurement power.
Switching costs and lead times
Changing vendors requires testing quality, retooling assortments and resetting promotions, and fashion calendars with typical lead times of 12–16 weeks (2024 industry norm) prevent rapid shifts. These frictions create implicit switching costs that increase supplier leverage. Suppliers exploit timing around seasonal buys to negotiate higher prices or stricter terms.
- Testing & retooling delays
- 12–16 weeks lead time (2024)
- Implicit switching costs raise supplier bargaining power
- Suppliers time negotiations around seasonal peaks
Omnichannel and fulfillment terms
Omnichannel fulfillment arrangements—drop-ship and marketplace models—shift logistics costs and data sharing to vendors, who in 2024 increasingly demanded visibility, platform fees, and service-level protections as marketplaces drove roughly 60% of US online GMV; Belk gains assortment breadth but concedes margin and control. The balance of power hinges on vendor digital capabilities and integration speed, which determine carrier routing, return costs, and data monetization.
- Vendor visibility requirements
- Platform/fulfillment fees
- Margin compression for Belk
- Vendor digital maturity = leverage
National brands squeeze regional retailers: pricing, margins and digital cost pressures rise
Powerful national brands (eg Nike FY24 revenue 51.6B) and concentrated beauty/footwear suppliers tighten Belk’s pricing and terms, risking traffic and margin loss. Private-labels (~20% US apparel sales, NielsenIQ 2024) moderate dependence but need strong design, sourcing and inventory control. Lead times (12–16 weeks) and seasonal buying create switching frictions; vendor digital demands (marketplaces ~60% online GMV 2024) shift costs to Belk.
| Metric | Value (2024) |
|---|---|
| Nike revenue | 51.6B |
| Private-label apparel share | ~20% |
| US prestige beauty market | ~90B |
| Lead time | 12–16 weeks |
| Marketplace online GMV | ~60% |
What is included in the product
Detailed Word Document
Tailored Porter's Five Forces analysis for Belk that uncovers competitive intensity, buyer and supplier power, substitution threats, and entry barriers, highlighting disruptive trends and strategic levers to protect market share and margin.
Customizable Excel Spreadsheet
One-sheet Belk Porter’s Five Forces that pinpoints competitive pain points and opportunities—customizable pressure levels and a clean, slide-ready layout to speed strategic decisions and executive buy-in.
Customers Bargaining Power
Low switching costs for shoppers
Low switching costs let Belk shoppers compare and buy across rival department stores, specialty retailers and online channels as e-commerce now represents about 15% of US retail sales (Census trend into 2023–24), amplifying buyer leverage. Minimal friction and competitive returns—apparel online return rates run roughly 20–30%—make convenience and return policy pivotal for retaining baskets, and any service lapse accelerates churn.
High price sensitivity
Frequent promotions have trained Belk shoppers to wait for deals, with promo-driven transactions representing over 50% of apparel sales in recent retail studies (2024), compressing gross margins and boosting buyer power. Price-matching and couponing further ratchet discount expectations, forcing margin erosion and shifting purchase triggers toward perceived value rather than brand loyalty.
Abundant alternatives
Amazon held roughly 40% of US e-commerce sales in 2024, while omnichannel players like Walmart and Target plus off-price chains and brand DTC sites crowd consumers’ consideration sets. Category specialists provide depth and curated experiences, increasing comparison shopping. This abundance of choice strengthens buyers’ negotiating stance. Belk must differentiate on value, curation, and service.
Digital transparency
Real-time reviews and price checks raise consumer knowledge, with over 70% of shoppers using comparison tools in 2024; visibility into quality and availability reduces information asymmetry and lets buyers pivot quickly to better offers, reportedly causing ~65% to switch after finding a better price. Belk must maintain competitive pricing and credible ratings to protect share.
- Real-time reviews: >70% usage (2024)
- Switching rate: ~65% on better offers
- Implication: sustain competitive pricing + verified ratings
Loyalty moderates power selectively
Loyalty moderates buyer power: rewards, private-label credit and regional familiarity reduce price sensitivity and help Belk retain higher-margin sales, while personalized offers and targeted promotions can lift basket size and repeat visits; 2024 McKinsey data shows personalization can boost revenues 10–15%. Yet heavy external discounting quickly erodes loyalty—program richness and relevance are decisive for retention.
- Rewards: increase repeat rate 10–20% (2024 studies)
- Private-label credit: raises average ticket, improves stickiness
- Vulnerability: high promotional intensity causes rapid churn
Promo-led apparel, high returns and price-savvy shoppers squeeze retailer margins
Low switching costs and 15% e-commerce share (2023–24) plus 20–30% apparel return rates amplify buyer leverage; promo-driven apparel sales >50% (2024) compress margins. Amazon ~40% of US e-commerce (2024) and >70% shoppers use comparison tools, with ~65% switching for better offers, forcing Belk to compete on price, service and loyalty.
| Metric | 2024 |
|---|---|
| E‑com share | 15% |
| Amazon share | ~40% |
| Promo-driven apparel | >50% |
| Return rate | 20–30% |
| Comparison tool use | >70% |
| Switch on better price | ~65% |
Full Version Awaits
Belk Porter's Five Forces Analysis
This preview shows the exact Belk Porter’s Five Forces Analysis you’ll receive immediately after purchase—no surprises, no placeholders. The document displayed is fully formatted, professionally written, and ready to download and use the moment you buy. You’re viewing the final deliverable, identical to the file delivered upon payment.
Description
From Overview to Strategy Blueprint
Belk faces moderate buyer power, limited supplier leverage, low threat of nationwide new entrants but strong pressure from omnichannel and discount rivals, and intense rivalry within department stores. Substitutes from specialty and online retailers raise strategic risk. This preview is just the beginning. The full analysis provides a complete strategic snapshot with force-by-force ratings, visuals, and business implications tailored to Belk.
Suppliers Bargaining Power
National brands wield leverage
Iconic apparel and beauty labels command shelf space, margins, and co-op marketing, and brands like Nike (FY24 revenue $51.6 billion) bring outsized retail leverage. Their consumer pull narrows Belk’s negotiating latitude on price and terms, especially in cosmetics and athletic wear. Losing a top brand risks measurable traffic declines and margin pressure for Belk.
Private label offsets dependence
Belk’s proprietary brands reduce reliance on external vendors and can boost gross margins, with private-label apparel capturing about 20% share of US apparel sales in 2024 per NielsenIQ, giving retailers more pricing control and differentiation. Successful private-label rollout hinges on design, sourcing and inventory risk management, and execution gaps can limit its ability to offset leverage held by national brands.
Supplier base fragmentation varies
Supplier base fragmentation varies: apparel vendors number in the thousands, enabling Belk to multi‑source and secure volume discounts, while beauty and premium footwear are more concentrated; in 2024 the US prestige beauty market was roughly $90B and leading footwear brands captured dominant shares, which raises supplier leverage where alternatives are limited. Category mix determines the net effect on procurement power.
Switching costs and lead times
Changing vendors requires testing quality, retooling assortments and resetting promotions, and fashion calendars with typical lead times of 12–16 weeks (2024 industry norm) prevent rapid shifts. These frictions create implicit switching costs that increase supplier leverage. Suppliers exploit timing around seasonal buys to negotiate higher prices or stricter terms.
- Testing & retooling delays
- 12–16 weeks lead time (2024)
- Implicit switching costs raise supplier bargaining power
- Suppliers time negotiations around seasonal peaks
Omnichannel and fulfillment terms
Omnichannel fulfillment arrangements—drop-ship and marketplace models—shift logistics costs and data sharing to vendors, who in 2024 increasingly demanded visibility, platform fees, and service-level protections as marketplaces drove roughly 60% of US online GMV; Belk gains assortment breadth but concedes margin and control. The balance of power hinges on vendor digital capabilities and integration speed, which determine carrier routing, return costs, and data monetization.
- Vendor visibility requirements
- Platform/fulfillment fees
- Margin compression for Belk
- Vendor digital maturity = leverage
National brands squeeze regional retailers: pricing, margins and digital cost pressures rise
Powerful national brands (eg Nike FY24 revenue 51.6B) and concentrated beauty/footwear suppliers tighten Belk’s pricing and terms, risking traffic and margin loss. Private-labels (~20% US apparel sales, NielsenIQ 2024) moderate dependence but need strong design, sourcing and inventory control. Lead times (12–16 weeks) and seasonal buying create switching frictions; vendor digital demands (marketplaces ~60% online GMV 2024) shift costs to Belk.
| Metric | Value (2024) |
|---|---|
| Nike revenue | 51.6B |
| Private-label apparel share | ~20% |
| US prestige beauty market | ~90B |
| Lead time | 12–16 weeks |
| Marketplace online GMV | ~60% |
What is included in the product
Detailed Word Document
Tailored Porter's Five Forces analysis for Belk that uncovers competitive intensity, buyer and supplier power, substitution threats, and entry barriers, highlighting disruptive trends and strategic levers to protect market share and margin.
Customizable Excel Spreadsheet
One-sheet Belk Porter’s Five Forces that pinpoints competitive pain points and opportunities—customizable pressure levels and a clean, slide-ready layout to speed strategic decisions and executive buy-in.
Customers Bargaining Power
Low switching costs for shoppers
Low switching costs let Belk shoppers compare and buy across rival department stores, specialty retailers and online channels as e-commerce now represents about 15% of US retail sales (Census trend into 2023–24), amplifying buyer leverage. Minimal friction and competitive returns—apparel online return rates run roughly 20–30%—make convenience and return policy pivotal for retaining baskets, and any service lapse accelerates churn.
High price sensitivity
Frequent promotions have trained Belk shoppers to wait for deals, with promo-driven transactions representing over 50% of apparel sales in recent retail studies (2024), compressing gross margins and boosting buyer power. Price-matching and couponing further ratchet discount expectations, forcing margin erosion and shifting purchase triggers toward perceived value rather than brand loyalty.
Abundant alternatives
Amazon held roughly 40% of US e-commerce sales in 2024, while omnichannel players like Walmart and Target plus off-price chains and brand DTC sites crowd consumers’ consideration sets. Category specialists provide depth and curated experiences, increasing comparison shopping. This abundance of choice strengthens buyers’ negotiating stance. Belk must differentiate on value, curation, and service.
Digital transparency
Real-time reviews and price checks raise consumer knowledge, with over 70% of shoppers using comparison tools in 2024; visibility into quality and availability reduces information asymmetry and lets buyers pivot quickly to better offers, reportedly causing ~65% to switch after finding a better price. Belk must maintain competitive pricing and credible ratings to protect share.
- Real-time reviews: >70% usage (2024)
- Switching rate: ~65% on better offers
- Implication: sustain competitive pricing + verified ratings
Loyalty moderates power selectively
Loyalty moderates buyer power: rewards, private-label credit and regional familiarity reduce price sensitivity and help Belk retain higher-margin sales, while personalized offers and targeted promotions can lift basket size and repeat visits; 2024 McKinsey data shows personalization can boost revenues 10–15%. Yet heavy external discounting quickly erodes loyalty—program richness and relevance are decisive for retention.
- Rewards: increase repeat rate 10–20% (2024 studies)
- Private-label credit: raises average ticket, improves stickiness
- Vulnerability: high promotional intensity causes rapid churn
Promo-led apparel, high returns and price-savvy shoppers squeeze retailer margins
Low switching costs and 15% e-commerce share (2023–24) plus 20–30% apparel return rates amplify buyer leverage; promo-driven apparel sales >50% (2024) compress margins. Amazon ~40% of US e-commerce (2024) and >70% shoppers use comparison tools, with ~65% switching for better offers, forcing Belk to compete on price, service and loyalty.
| Metric | 2024 |
|---|---|
| E‑com share | 15% |
| Amazon share | ~40% |
| Promo-driven apparel | >50% |
| Return rate | 20–30% |
| Comparison tool use | >70% |
| Switch on better price | ~65% |
Full Version Awaits
Belk Porter's Five Forces Analysis
This preview shows the exact Belk Porter’s Five Forces Analysis you’ll receive immediately after purchase—no surprises, no placeholders. The document displayed is fully formatted, professionally written, and ready to download and use the moment you buy. You’re viewing the final deliverable, identical to the file delivered upon payment.











