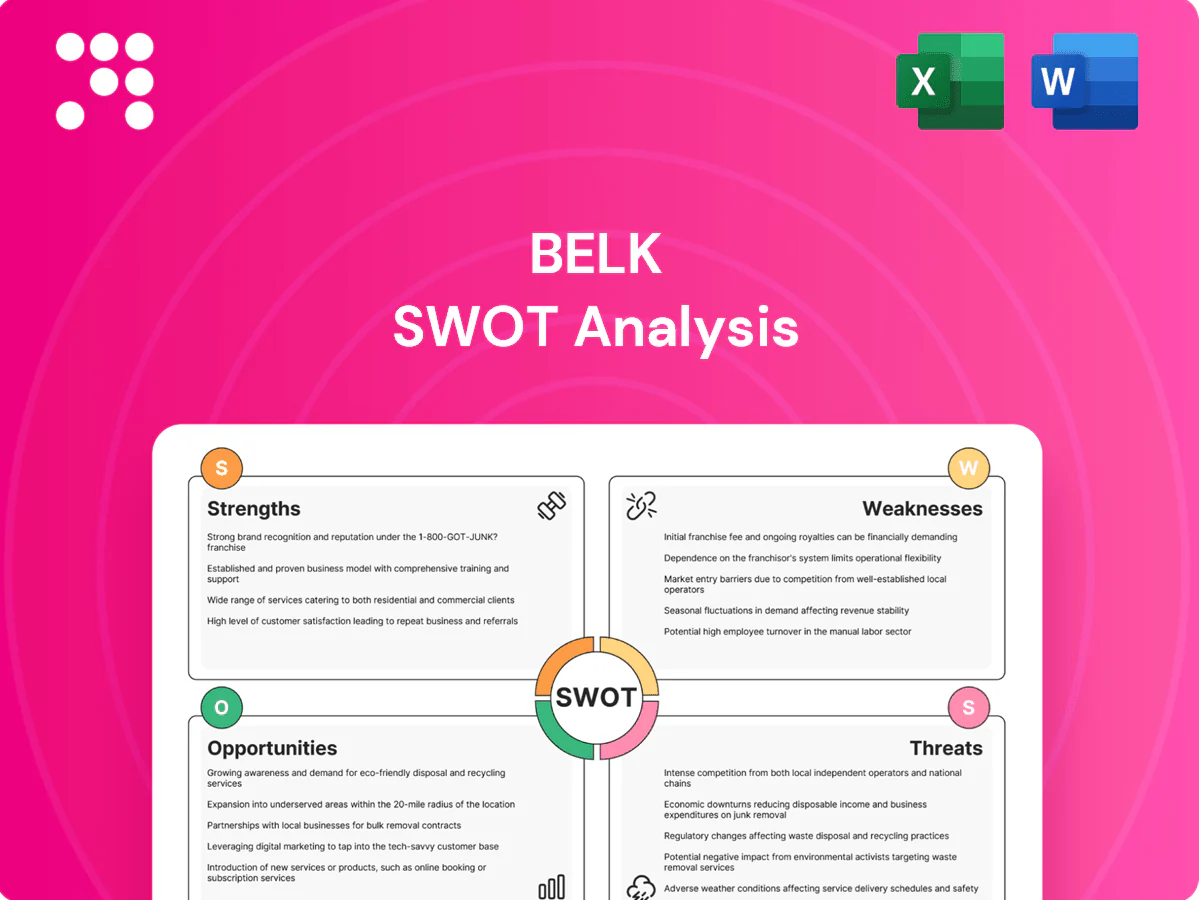
Belk SWOT Analysis

Your Strategic Toolkit Starts Here
Belk's SWOT highlights resilient regional brand strength, omnichannel gaps, supply-chain pressures, and opportunities in private-label expansion and market repositioning. Our full SWOT adds financial context, strategic scenarios, and competitor benchmarking. Purchase the complete analysis to get a professionally written, editable report for planning and investment. Unlock Word and Excel files to present and act with confidence.
Strengths

Strong Southern brand recognition
Belk, founded in 1888, has over 130 years of Southern presence across 16 Southeastern states, driving strong local familiarity and multi-generational loyalty; customers routinely return for seasonal events and promotions, supporting repeat traffic and word-of-mouth. This regional scale enables locally tailored assortments and community partnerships that reinforce store-level sales and customer retention.
Broad, family-focused merchandise mix
Belk’s broad, family-focused merchandise mix—apparel, shoes, accessories, beauty and home—lets customers complete gifting and event-driven shopping in one trip, boosting basket size and cross-sell while smoothing seasonality and fashion risk through balanced categories.

Omnichannel with store-enabled fulfillment
Belk’s store-enabled fulfillment—BOPIS, curbside, ship-from-store and in-store returns—cuts last-mile costs and preserves sales when foot traffic fluctuates; BOPIS surged ~60% during the pandemic and remains a core omnichannel driver per industry reports through 2023. Inventory pooling from stores boosts availability and markdown efficiency, strengthening cross-channel retention and lifetime value.

Private brands and exclusive assortments
Owned labels give Belk tighter margin control and brand differentiation, supporting higher gross-margin mix and exclusive positioning. With roughly 290 stores across 16 Southern states, private brands can be localized for regional tastes and climate. Exclusive capsules reduce direct price comparison and enable clear good-better-best pricing ladders that drive discovery and higher basket rings.
- margin-control
- regional-localization
- exclusive-discovery
- good-better-best
Beauty and home as traffic drivers
Beauty counters and home goods drive frequent-need replenishment traffic for Belk, reducing susceptibility to pure online substitution when tactile testing or feel matters; both categories enable in-store services and events that boost engagement and dwell time. Attachment effects from apparel cross-sell lift average transaction value and basket size.
- Frequent-replenishment categories
- Resistant to online-only substitution
- Supports events/services
- Apparel attachment raises ATV
Legacy 1888 retailer: ~290 stores in 16 states; omnichannel & BOPIS +60%
Belk, founded in 1888, leverages ~290 stores across 16 Southeastern states for strong regional loyalty and localized assortments. A broad family-focused merchandise mix (apparel, beauty, home) drives higher basket rings and frequent traffic. Omnichannel fulfillment (BOPIS, curbside, ship-from-store) — BOPIS surged ~60% during the pandemic — preserves sales and reduces last-mile costs.
| Metric | Value |
|---|---|
| Founding year | 1888 |
| Store count | ~290 |
| States | 16 |
| BOPIS surge | ~60% (pandemic) |
What is included in the product
 Detailed Word Document
Delivers a strategic overview of Belk’s internal and external business factors, outlining strengths, weaknesses, opportunities, and threats to analyze the company’s competitive position and growth prospects.

 Customizable Excel Spreadsheet
Provides a concise, visually organized SWOT of Belk to quickly align strategy, streamline stakeholder communication, and enable rapid updates as market priorities shift.
Weaknesses

Heavy mall-based footprint
Belk's heavy mall-based footprint—about 280 stores concentrated in Class B/C regional malls—exposes it to secular mall traffic declines (Placer.ai and Coresight noted mall visits down roughly 25–35% versus 2019 through 2023–24), reducing conversion and sales per sq ft.
High fixed rent and co-tenant risk magnify margin pressure when anchor or specialty tenants cut hours or close; rent leverage can compress EBITDA in weaker malls.
Many store layouts lag off-mall competitors and omnichannel formats; necessary remodels demand capital expenditure and months of execution, slowing ROI recovery.
Geographic concentration risk
Belk, headquartered in Charlotte, NC, remains heavily concentrated in the Southeastern US—operating across roughly 16 states—tying sales to regional macro trends and weather; the South accounts for about 38.3% of the US population (2020 Census). Limited national reach reduces marketing and logistics scale efficiencies and constrains brand awareness outside core markets. Broader expansion requires higher per-store capital and carries greater execution risk.

Mid-market positioning squeeze
Belk faces a mid-market squeeze as value shoppers shift to off-price operators like TJX (FY2024 net sales about $56.7B) while premium buyers migrate to specialty brands, eroding mid-tier volume. Online price transparency—about 72% of shoppers comparing prices digitally—weakens mid-tier pricing power. Heavy promotional reliance compresses retail margins, and brand perception risks feeling undifferentiated in a crowded apparel market.

Digital capabilities lag top peers
Belk's digital capabilities lag top peers; market leaders set expectations for speed, search, and personalization. Any friction in site/app UX lowers conversion and repeat rates—Baymard Institute reports a 69.8% average cart abandonment (2024), highlighting sensitivity to friction. Marketing ROI suffers without robust data activation, and tech debt slows experimentation and feature rollout.
- UX friction → higher abandonment (69.8% avg cart abandonment, Baymard 2024)
- Poor personalization → lower conversion & repeat
- Weak data activation → reduced marketing ROI
- Tech debt → slower feature delivery
Balance sheet and investment constraints
Belk's prior restructurings underscore balance-sheet sensitivity to revenue shocks, leaving limited buffers for unexpected downturns. High fixed costs from stores and labor reduce ability to cut quickly when demand falls, pressuring margins. Ongoing capital intensity for store remodels and digital investment competes with near-term profitability, while strained vendor perceptions can tighten procurement terms.
- Restructuring shows financial vulnerability
- High fixed costs limit flexibility
- Capex for stores/tech strains margins
- Vendor terms may tighten under risk
Mall-focused retailer (~280 stores) faces 25–35% footfall loss, poor conversion
Belk's ~280 mall-heavy stores face secular mall traffic declines (visits down ~25–35% vs 2019), compressing sales/sq ft and margins. High fixed rents, prior restructurings and capex needs limit flexibility; TJX (FY2024 sales $56.7B) outcompetes the mid-market. Digital UX/personalization lag (cart abandonment ~69.8%) reduces conversion and marketing ROI. Southeast concentration (~38.3% US pop) limits national scale.
| Metric | Value |
|---|---|
| Stores | ~280 |
| Mall visits decline | 25–35% |
| Cart abandonment | 69.8% |
| TJX FY2024 | $56.7B |
Preview Before You Purchase
Belk SWOT Analysis
This Belk SWOT Analysis preview is the actual document you’ll receive upon purchase—no placeholders, just the full professional report. The excerpt below is taken directly from the complete, editable file included in your download. Buy now to unlock the entire in-depth analysis with strengths, weaknesses, opportunities, and threats fully detailed.

Your Strategic Toolkit Starts Here
Belk's SWOT highlights resilient regional brand strength, omnichannel gaps, supply-chain pressures, and opportunities in private-label expansion and market repositioning. Our full SWOT adds financial context, strategic scenarios, and competitor benchmarking. Purchase the complete analysis to get a professionally written, editable report for planning and investment. Unlock Word and Excel files to present and act with confidence.
Strengths
Strong Southern brand recognition
Belk, founded in 1888, has over 130 years of Southern presence across 16 Southeastern states, driving strong local familiarity and multi-generational loyalty; customers routinely return for seasonal events and promotions, supporting repeat traffic and word-of-mouth. This regional scale enables locally tailored assortments and community partnerships that reinforce store-level sales and customer retention.
Broad, family-focused merchandise mix
Belk’s broad, family-focused merchandise mix—apparel, shoes, accessories, beauty and home—lets customers complete gifting and event-driven shopping in one trip, boosting basket size and cross-sell while smoothing seasonality and fashion risk through balanced categories.
Omnichannel with store-enabled fulfillment
Belk’s store-enabled fulfillment—BOPIS, curbside, ship-from-store and in-store returns—cuts last-mile costs and preserves sales when foot traffic fluctuates; BOPIS surged ~60% during the pandemic and remains a core omnichannel driver per industry reports through 2023. Inventory pooling from stores boosts availability and markdown efficiency, strengthening cross-channel retention and lifetime value.
Private brands and exclusive assortments
Owned labels give Belk tighter margin control and brand differentiation, supporting higher gross-margin mix and exclusive positioning. With roughly 290 stores across 16 Southern states, private brands can be localized for regional tastes and climate. Exclusive capsules reduce direct price comparison and enable clear good-better-best pricing ladders that drive discovery and higher basket rings.
- margin-control
- regional-localization
- exclusive-discovery
- good-better-best
Beauty and home as traffic drivers
Beauty counters and home goods drive frequent-need replenishment traffic for Belk, reducing susceptibility to pure online substitution when tactile testing or feel matters; both categories enable in-store services and events that boost engagement and dwell time. Attachment effects from apparel cross-sell lift average transaction value and basket size.
- Frequent-replenishment categories
- Resistant to online-only substitution
- Supports events/services
- Apparel attachment raises ATV
Legacy 1888 retailer: ~290 stores in 16 states; omnichannel & BOPIS +60%
Belk, founded in 1888, leverages ~290 stores across 16 Southeastern states for strong regional loyalty and localized assortments. A broad family-focused merchandise mix (apparel, beauty, home) drives higher basket rings and frequent traffic. Omnichannel fulfillment (BOPIS, curbside, ship-from-store) — BOPIS surged ~60% during the pandemic — preserves sales and reduces last-mile costs.
| Metric | Value |
|---|---|
| Founding year | 1888 |
| Store count | ~290 |
| States | 16 |
| BOPIS surge | ~60% (pandemic) |
What is included in the product
Detailed Word Document
Delivers a strategic overview of Belk’s internal and external business factors, outlining strengths, weaknesses, opportunities, and threats to analyze the company’s competitive position and growth prospects.
Customizable Excel Spreadsheet
Provides a concise, visually organized SWOT of Belk to quickly align strategy, streamline stakeholder communication, and enable rapid updates as market priorities shift.
Weaknesses
Heavy mall-based footprint
Belk's heavy mall-based footprint—about 280 stores concentrated in Class B/C regional malls—exposes it to secular mall traffic declines (Placer.ai and Coresight noted mall visits down roughly 25–35% versus 2019 through 2023–24), reducing conversion and sales per sq ft.
High fixed rent and co-tenant risk magnify margin pressure when anchor or specialty tenants cut hours or close; rent leverage can compress EBITDA in weaker malls.
Many store layouts lag off-mall competitors and omnichannel formats; necessary remodels demand capital expenditure and months of execution, slowing ROI recovery.
Geographic concentration risk
Belk, headquartered in Charlotte, NC, remains heavily concentrated in the Southeastern US—operating across roughly 16 states—tying sales to regional macro trends and weather; the South accounts for about 38.3% of the US population (2020 Census). Limited national reach reduces marketing and logistics scale efficiencies and constrains brand awareness outside core markets. Broader expansion requires higher per-store capital and carries greater execution risk.
Mid-market positioning squeeze
Belk faces a mid-market squeeze as value shoppers shift to off-price operators like TJX (FY2024 net sales about $56.7B) while premium buyers migrate to specialty brands, eroding mid-tier volume. Online price transparency—about 72% of shoppers comparing prices digitally—weakens mid-tier pricing power. Heavy promotional reliance compresses retail margins, and brand perception risks feeling undifferentiated in a crowded apparel market.
Digital capabilities lag top peers
Belk's digital capabilities lag top peers; market leaders set expectations for speed, search, and personalization. Any friction in site/app UX lowers conversion and repeat rates—Baymard Institute reports a 69.8% average cart abandonment (2024), highlighting sensitivity to friction. Marketing ROI suffers without robust data activation, and tech debt slows experimentation and feature rollout.
- UX friction → higher abandonment (69.8% avg cart abandonment, Baymard 2024)
- Poor personalization → lower conversion & repeat
- Weak data activation → reduced marketing ROI
- Tech debt → slower feature delivery
Balance sheet and investment constraints
Belk's prior restructurings underscore balance-sheet sensitivity to revenue shocks, leaving limited buffers for unexpected downturns. High fixed costs from stores and labor reduce ability to cut quickly when demand falls, pressuring margins. Ongoing capital intensity for store remodels and digital investment competes with near-term profitability, while strained vendor perceptions can tighten procurement terms.
- Restructuring shows financial vulnerability
- High fixed costs limit flexibility
- Capex for stores/tech strains margins
- Vendor terms may tighten under risk
Mall-focused retailer (~280 stores) faces 25–35% footfall loss, poor conversion
Belk's ~280 mall-heavy stores face secular mall traffic declines (visits down ~25–35% vs 2019), compressing sales/sq ft and margins. High fixed rents, prior restructurings and capex needs limit flexibility; TJX (FY2024 sales $56.7B) outcompetes the mid-market. Digital UX/personalization lag (cart abandonment ~69.8%) reduces conversion and marketing ROI. Southeast concentration (~38.3% US pop) limits national scale.
| Metric | Value |
|---|---|
| Stores | ~280 |
| Mall visits decline | 25–35% |
| Cart abandonment | 69.8% |
| TJX FY2024 | $56.7B |
Preview Before You Purchase
Belk SWOT Analysis
This Belk SWOT Analysis preview is the actual document you’ll receive upon purchase—no placeholders, just the full professional report. The excerpt below is taken directly from the complete, editable file included in your download. Buy now to unlock the entire in-depth analysis with strengths, weaknesses, opportunities, and threats fully detailed.
Original: $10.00
-65%$10.00
$3.50Description
Your Strategic Toolkit Starts Here
Belk's SWOT highlights resilient regional brand strength, omnichannel gaps, supply-chain pressures, and opportunities in private-label expansion and market repositioning. Our full SWOT adds financial context, strategic scenarios, and competitor benchmarking. Purchase the complete analysis to get a professionally written, editable report for planning and investment. Unlock Word and Excel files to present and act with confidence.
Strengths
Strong Southern brand recognition
Belk, founded in 1888, has over 130 years of Southern presence across 16 Southeastern states, driving strong local familiarity and multi-generational loyalty; customers routinely return for seasonal events and promotions, supporting repeat traffic and word-of-mouth. This regional scale enables locally tailored assortments and community partnerships that reinforce store-level sales and customer retention.
Broad, family-focused merchandise mix
Belk’s broad, family-focused merchandise mix—apparel, shoes, accessories, beauty and home—lets customers complete gifting and event-driven shopping in one trip, boosting basket size and cross-sell while smoothing seasonality and fashion risk through balanced categories.
Omnichannel with store-enabled fulfillment
Belk’s store-enabled fulfillment—BOPIS, curbside, ship-from-store and in-store returns—cuts last-mile costs and preserves sales when foot traffic fluctuates; BOPIS surged ~60% during the pandemic and remains a core omnichannel driver per industry reports through 2023. Inventory pooling from stores boosts availability and markdown efficiency, strengthening cross-channel retention and lifetime value.
Private brands and exclusive assortments
Owned labels give Belk tighter margin control and brand differentiation, supporting higher gross-margin mix and exclusive positioning. With roughly 290 stores across 16 Southern states, private brands can be localized for regional tastes and climate. Exclusive capsules reduce direct price comparison and enable clear good-better-best pricing ladders that drive discovery and higher basket rings.
- margin-control
- regional-localization
- exclusive-discovery
- good-better-best
Beauty and home as traffic drivers
Beauty counters and home goods drive frequent-need replenishment traffic for Belk, reducing susceptibility to pure online substitution when tactile testing or feel matters; both categories enable in-store services and events that boost engagement and dwell time. Attachment effects from apparel cross-sell lift average transaction value and basket size.
- Frequent-replenishment categories
- Resistant to online-only substitution
- Supports events/services
- Apparel attachment raises ATV
Legacy 1888 retailer: ~290 stores in 16 states; omnichannel & BOPIS +60%
Belk, founded in 1888, leverages ~290 stores across 16 Southeastern states for strong regional loyalty and localized assortments. A broad family-focused merchandise mix (apparel, beauty, home) drives higher basket rings and frequent traffic. Omnichannel fulfillment (BOPIS, curbside, ship-from-store) — BOPIS surged ~60% during the pandemic — preserves sales and reduces last-mile costs.
| Metric | Value |
|---|---|
| Founding year | 1888 |
| Store count | ~290 |
| States | 16 |
| BOPIS surge | ~60% (pandemic) |
What is included in the product
Detailed Word Document
Delivers a strategic overview of Belk’s internal and external business factors, outlining strengths, weaknesses, opportunities, and threats to analyze the company’s competitive position and growth prospects.
Customizable Excel Spreadsheet
Provides a concise, visually organized SWOT of Belk to quickly align strategy, streamline stakeholder communication, and enable rapid updates as market priorities shift.
Weaknesses
Heavy mall-based footprint
Belk's heavy mall-based footprint—about 280 stores concentrated in Class B/C regional malls—exposes it to secular mall traffic declines (Placer.ai and Coresight noted mall visits down roughly 25–35% versus 2019 through 2023–24), reducing conversion and sales per sq ft.
High fixed rent and co-tenant risk magnify margin pressure when anchor or specialty tenants cut hours or close; rent leverage can compress EBITDA in weaker malls.
Many store layouts lag off-mall competitors and omnichannel formats; necessary remodels demand capital expenditure and months of execution, slowing ROI recovery.
Geographic concentration risk
Belk, headquartered in Charlotte, NC, remains heavily concentrated in the Southeastern US—operating across roughly 16 states—tying sales to regional macro trends and weather; the South accounts for about 38.3% of the US population (2020 Census). Limited national reach reduces marketing and logistics scale efficiencies and constrains brand awareness outside core markets. Broader expansion requires higher per-store capital and carries greater execution risk.
Mid-market positioning squeeze
Belk faces a mid-market squeeze as value shoppers shift to off-price operators like TJX (FY2024 net sales about $56.7B) while premium buyers migrate to specialty brands, eroding mid-tier volume. Online price transparency—about 72% of shoppers comparing prices digitally—weakens mid-tier pricing power. Heavy promotional reliance compresses retail margins, and brand perception risks feeling undifferentiated in a crowded apparel market.
Digital capabilities lag top peers
Belk's digital capabilities lag top peers; market leaders set expectations for speed, search, and personalization. Any friction in site/app UX lowers conversion and repeat rates—Baymard Institute reports a 69.8% average cart abandonment (2024), highlighting sensitivity to friction. Marketing ROI suffers without robust data activation, and tech debt slows experimentation and feature rollout.
- UX friction → higher abandonment (69.8% avg cart abandonment, Baymard 2024)
- Poor personalization → lower conversion & repeat
- Weak data activation → reduced marketing ROI
- Tech debt → slower feature delivery
Balance sheet and investment constraints
Belk's prior restructurings underscore balance-sheet sensitivity to revenue shocks, leaving limited buffers for unexpected downturns. High fixed costs from stores and labor reduce ability to cut quickly when demand falls, pressuring margins. Ongoing capital intensity for store remodels and digital investment competes with near-term profitability, while strained vendor perceptions can tighten procurement terms.
- Restructuring shows financial vulnerability
- High fixed costs limit flexibility
- Capex for stores/tech strains margins
- Vendor terms may tighten under risk
Mall-focused retailer (~280 stores) faces 25–35% footfall loss, poor conversion
Belk's ~280 mall-heavy stores face secular mall traffic declines (visits down ~25–35% vs 2019), compressing sales/sq ft and margins. High fixed rents, prior restructurings and capex needs limit flexibility; TJX (FY2024 sales $56.7B) outcompetes the mid-market. Digital UX/personalization lag (cart abandonment ~69.8%) reduces conversion and marketing ROI. Southeast concentration (~38.3% US pop) limits national scale.
| Metric | Value |
|---|---|
| Stores | ~280 |
| Mall visits decline | 25–35% |
| Cart abandonment | 69.8% |
| TJX FY2024 | $56.7B |
Preview Before You Purchase
Belk SWOT Analysis
This Belk SWOT Analysis preview is the actual document you’ll receive upon purchase—no placeholders, just the full professional report. The excerpt below is taken directly from the complete, editable file included in your download. Buy now to unlock the entire in-depth analysis with strengths, weaknesses, opportunities, and threats fully detailed.











