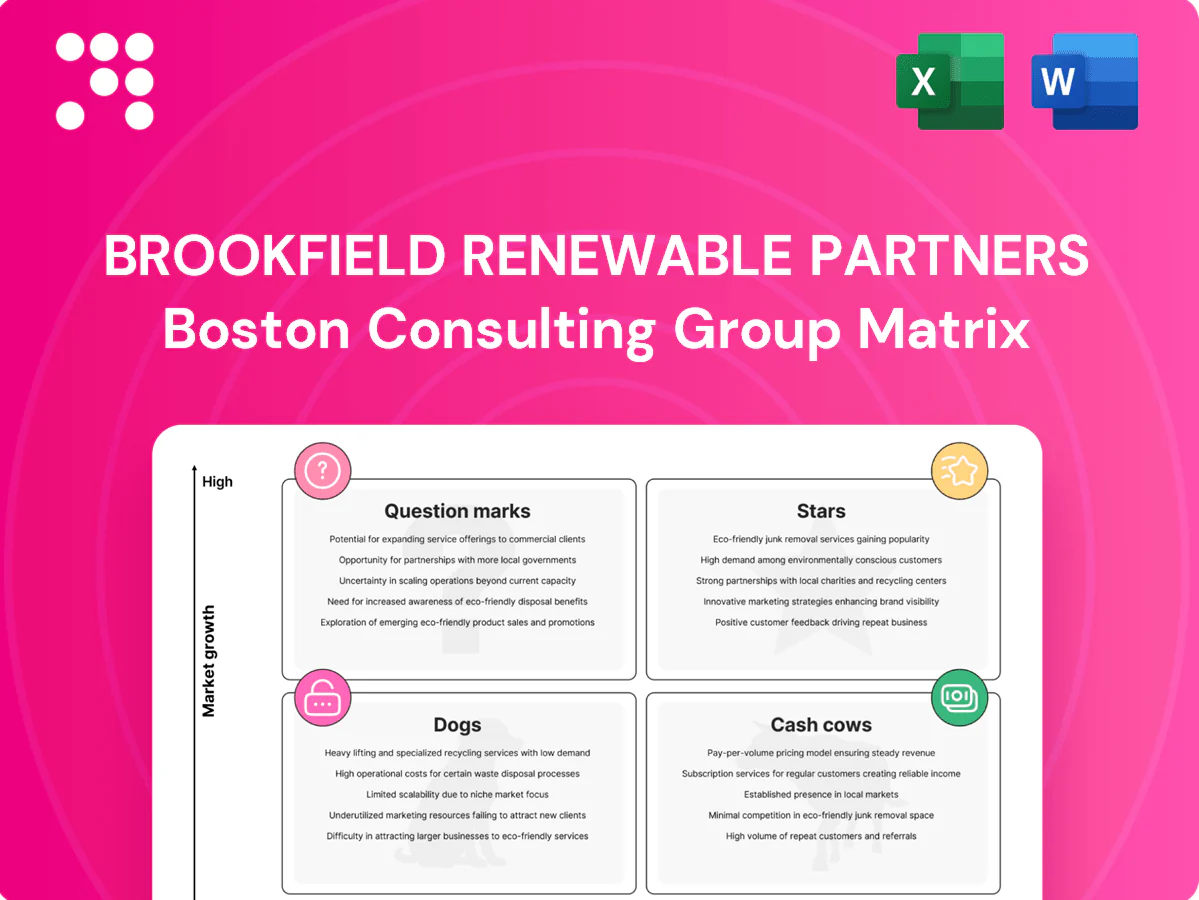
Brookfield Renewable Partners Boston Consulting Group Matrix

Download Your Competitive Advantage
Brookfield Renewable Partners sits at an interesting crossroads—several hydro and wind assets look like Cash Cows, while newer storage and emerging-market projects read as Question Marks that could flip to Stars with capital and scale. Our BCG Matrix preview maps where cash is coming from and where growth bets live, so you can spot allocation priorities fast. This sneak peek helps, but the full BCG Matrix delivers quadrant-by-quadrant insights, clear recommendations, and editable Word + Excel files. Purchase now for a ready-to-use strategic tool.
Stars

Utility-scale solar development pipeline
Fast-growing demand and steep cost declines—solar PV represented roughly 60% of global power capacity additions in 2023—favor large utility-scale builds in core markets. Brookfield Renewable’s scale, site ownership and offtake credibility give a strong and rising share in this segment. Exceptional near-term capex and origination muscle are required now, but existing momentum converts to leadership. Continued investment recommended to cement position before growth moderates.
Grid-scale battery storage platforms
Grid-scale battery storage is booming as grids integrate intermittent renewables, with global battery deployments reaching roughly 30 GW in 2024 and year‑over‑year growth exceeding 50%.
Brookfield’s co‑location and dispatch know‑how provide a commercial edge in stacking revenue streams, yet the market remains a land‑grab dominated by rapid site acquisitions.
Capital intensity is high and returns hinge on smart market participation, merchant price capture and ancillary services; policy tailwinds and near‑term growth justify doubling down while incentives and demand persist.

Onshore wind repowering programs
Onshore wind repowers lift capacity 20–40% and extend life 15–25 years where Brookfield already holds footprint and permits. In 2024 repowering pipelines accelerated in Europe and North America, and Brookfield’s scale and O&M expertise materially advantaged its share. Cash in equals cash out initially as turbines and cranes soak capital; push now to lock future cash‑cow status.

Hybrid renewable hubs (solar + wind + storage)
Hybrid renewable hubs (solar + wind + storage) sit in the BCG Matrix as a rising Star for Brookfield Renewable: integrated hubs squeeze more value from the same interconnect and Brookfield’s portfolio breadth lets it stack revenues and raise capacity factors in growth regions; Brookfield Renewable reported over 20 GW of operating capacity in 2024, but these platforms remain execution-heavy and capex-hungry today while offering ownership of key nodes.
Corporate PPAs with investment‑grade buyers
Corporate PPAs with investment‑grade buyers are a Star: enterprise demand surged with global corporate PPA signings ~25 GW in 2024 (BloombergNEF), and Brookfield’s brand plus balance sheet win large multi‑site deals, growing share in the high‑margin segment; however origination and customization keep support costs elevated so scaling the sales engine is critical.
- Demand: ~25 GW global corporate PPAs in 2024
- Strength: brand + balance sheet win multi‑site deals
- Cost: high origination/customization
- Priority: scale sales/origination engine
Solar PV ~60% 2023; 30 GW batteries, 25 GW PPAs
Solar PV drove ~60% of 2023 global power additions; Brookfield’s scale and site control position it as a Star. Grid batteries hit ~30 GW deployed in 2024, favoring co‑located dispatch stacks. Hybrid hubs leverage Brookfield’s >20 GW operating base in 2024 but remain capex‑heavy. Corporate PPAs ~25 GW in 2024 underpin high‑margin origination growth.
| Segment | 2023‑24 Metric | Brookfield Position |
|---|---|---|
| Solar PV | 60% of 2023 additions | Scale/site ownership |
| Battery Storage | ~30 GW deployed (2024) | Co‑location advantage |
| Hybrid Hubs | 20+ GW operating (2024) | Execution‑heavy Star |
| Corporate PPAs | ~25 GW signed (2024) | Origination growth |
What is included in the product
 Detailed Word Document
Brookfield Renewable BCG Matrix: maps assets to Stars, Cash Cows, Question Marks, Dogs with invest/hold/divest guidance and trends.

 Customizable Excel Spreadsheet
One-page BCG view of Brookfield Renewable units, clarifying priorities for investment and divestment.
Cash Cows

Legacy hydroelectric fleet with long-term contracts
Brookfield Renewable’s legacy hydro fleet, operating for decades and totaling roughly 21 GW of capacity in 2024, delivers very low marginal costs and largely contracted cash flows (contracts cover about 80% of generation, average remaining PPA life ~12 years). Growth is modest but margins are stout and predictable, driving stable distributable cash. Minimal promotion is needed—operations focus on uptime and incremental upgrades—milking steady cash to fund new builds.
Mature onshore wind in stabilized markets
Mature onshore wind in stabilized markets delivers dependable EBITDA under long-term PPAs, supported by Brookfield Renewable's approximately 21 GW of generating capacity (2024). Opex discipline and asset-life extensions raise free cash by reducing downtime and deferring major capex. Little need for big growth spend beyond routine maintenance; focus is optimize, refinance, and harvest.

Contracted utility‑scale solar in core geographies
Contracted utility‑scale solar in core geographies provides Brookfield Renewable predictable inflows under long‑term PPAs (typically 15–25 years) in 2024, with limited cash‑flow volatility. Market maturity means upside is efficiency, not scale; trackers and O&M tech can boost yield materially and financing tweaks can improve returns by tens to low hundreds of basis points. Proceeds finance higher‑growth Stars.

Hydro ancillary services and capacity revenues
Flexible hydro at Brookfield Renewable, within a 2024 operational fleet of about 22.7 GW, earns capacity and ancillary grid services with minimal incremental capex; market growth is broadly flat but those payments are sticky and backlog-like. Fine‑tuned dispatch and market bidding captured incremental revenue in 2024, delivering quiet, repeatable cash flow across cycles.
- Hydro emphasis: stable capacity/ancillary mix
- 2024 fleet: ~22.7 GW total
- Revenue: sticky, low-capex margin
- Ops focus: dispatch/bidding to capture extras
Operating storage with fixed or hedged revenues
Older or fully contracted batteries in Brookfield Renewable yield stable, predictable cashflows; growth in these pockets has cooled but contracted revenues keep cash coming. Managing degradation and optimizing contracts preserves margin and availability, making these assets a reliable internal funding source.
- 2024: Brookfield Renewable >20 GW global capacity
- Older/contracted storage delivers steady cashflow
- Focus: degradation management and contract optimization
Legacy hydro and mature wind/solar: low-cost, ~80% contracted cash fuels growth
Brookfield Renewable’s legacy hydro (~22.7 GW in 2024) and mature wind/solar (~21 GW contracted base) produce low‑cost, ~80% contracted cashflows (avg PPA ~12 years), yielding steady distributable cash used to fund higher‑growth projects. Operations focus on uptime, dispatch optimization and refinancings; contracted storage adds predictable cash while growth capex is modest.
| Asset | 2024 GW | Contracted% | Avg PPA yrs | Role |
|---|---|---|---|---|
| Hydro | 22.7 | ≈80 | 12 | Cash cow/ancillary |
| Wind | ~21 | ~80 | 12 | Stable EBITDA |
| Solar | — | High | 15–25 | Predictable cash |
| Storage | — | Contracted pockets | — | Reliable cash |
Delivered as Shown
Brookfield Renewable Partners BCG Matrix
The Brookfield Renewable Partners BCG Matrix you’re previewing is the exact file you’ll receive after purchase. No watermarks, no placeholders—just a fully formatted, analysis-ready matrix built for strategic decisions. Once purchased, the same document is yours to download, edit, print, or present. Professional, clear, and ready for immediate use.

Download Your Competitive Advantage
Brookfield Renewable Partners sits at an interesting crossroads—several hydro and wind assets look like Cash Cows, while newer storage and emerging-market projects read as Question Marks that could flip to Stars with capital and scale. Our BCG Matrix preview maps where cash is coming from and where growth bets live, so you can spot allocation priorities fast. This sneak peek helps, but the full BCG Matrix delivers quadrant-by-quadrant insights, clear recommendations, and editable Word + Excel files. Purchase now for a ready-to-use strategic tool.
Stars
Utility-scale solar development pipeline
Fast-growing demand and steep cost declines—solar PV represented roughly 60% of global power capacity additions in 2023—favor large utility-scale builds in core markets. Brookfield Renewable’s scale, site ownership and offtake credibility give a strong and rising share in this segment. Exceptional near-term capex and origination muscle are required now, but existing momentum converts to leadership. Continued investment recommended to cement position before growth moderates.
Grid-scale battery storage platforms
Grid-scale battery storage is booming as grids integrate intermittent renewables, with global battery deployments reaching roughly 30 GW in 2024 and year‑over‑year growth exceeding 50%.
Brookfield’s co‑location and dispatch know‑how provide a commercial edge in stacking revenue streams, yet the market remains a land‑grab dominated by rapid site acquisitions.
Capital intensity is high and returns hinge on smart market participation, merchant price capture and ancillary services; policy tailwinds and near‑term growth justify doubling down while incentives and demand persist.
Onshore wind repowering programs
Onshore wind repowers lift capacity 20–40% and extend life 15–25 years where Brookfield already holds footprint and permits. In 2024 repowering pipelines accelerated in Europe and North America, and Brookfield’s scale and O&M expertise materially advantaged its share. Cash in equals cash out initially as turbines and cranes soak capital; push now to lock future cash‑cow status.
Hybrid renewable hubs (solar + wind + storage)
Hybrid renewable hubs (solar + wind + storage) sit in the BCG Matrix as a rising Star for Brookfield Renewable: integrated hubs squeeze more value from the same interconnect and Brookfield’s portfolio breadth lets it stack revenues and raise capacity factors in growth regions; Brookfield Renewable reported over 20 GW of operating capacity in 2024, but these platforms remain execution-heavy and capex-hungry today while offering ownership of key nodes.
Corporate PPAs with investment‑grade buyers
Corporate PPAs with investment‑grade buyers are a Star: enterprise demand surged with global corporate PPA signings ~25 GW in 2024 (BloombergNEF), and Brookfield’s brand plus balance sheet win large multi‑site deals, growing share in the high‑margin segment; however origination and customization keep support costs elevated so scaling the sales engine is critical.
- Demand: ~25 GW global corporate PPAs in 2024
- Strength: brand + balance sheet win multi‑site deals
- Cost: high origination/customization
- Priority: scale sales/origination engine
Solar PV ~60% 2023; 30 GW batteries, 25 GW PPAs
Solar PV drove ~60% of 2023 global power additions; Brookfield’s scale and site control position it as a Star. Grid batteries hit ~30 GW deployed in 2024, favoring co‑located dispatch stacks. Hybrid hubs leverage Brookfield’s >20 GW operating base in 2024 but remain capex‑heavy. Corporate PPAs ~25 GW in 2024 underpin high‑margin origination growth.
| Segment | 2023‑24 Metric | Brookfield Position |
|---|---|---|
| Solar PV | 60% of 2023 additions | Scale/site ownership |
| Battery Storage | ~30 GW deployed (2024) | Co‑location advantage |
| Hybrid Hubs | 20+ GW operating (2024) | Execution‑heavy Star |
| Corporate PPAs | ~25 GW signed (2024) | Origination growth |
What is included in the product
Detailed Word Document
Brookfield Renewable BCG Matrix: maps assets to Stars, Cash Cows, Question Marks, Dogs with invest/hold/divest guidance and trends.
Customizable Excel Spreadsheet
One-page BCG view of Brookfield Renewable units, clarifying priorities for investment and divestment.
Cash Cows
Legacy hydroelectric fleet with long-term contracts
Brookfield Renewable’s legacy hydro fleet, operating for decades and totaling roughly 21 GW of capacity in 2024, delivers very low marginal costs and largely contracted cash flows (contracts cover about 80% of generation, average remaining PPA life ~12 years). Growth is modest but margins are stout and predictable, driving stable distributable cash. Minimal promotion is needed—operations focus on uptime and incremental upgrades—milking steady cash to fund new builds.
Mature onshore wind in stabilized markets
Mature onshore wind in stabilized markets delivers dependable EBITDA under long-term PPAs, supported by Brookfield Renewable's approximately 21 GW of generating capacity (2024). Opex discipline and asset-life extensions raise free cash by reducing downtime and deferring major capex. Little need for big growth spend beyond routine maintenance; focus is optimize, refinance, and harvest.
Contracted utility‑scale solar in core geographies
Contracted utility‑scale solar in core geographies provides Brookfield Renewable predictable inflows under long‑term PPAs (typically 15–25 years) in 2024, with limited cash‑flow volatility. Market maturity means upside is efficiency, not scale; trackers and O&M tech can boost yield materially and financing tweaks can improve returns by tens to low hundreds of basis points. Proceeds finance higher‑growth Stars.
Hydro ancillary services and capacity revenues
Flexible hydro at Brookfield Renewable, within a 2024 operational fleet of about 22.7 GW, earns capacity and ancillary grid services with minimal incremental capex; market growth is broadly flat but those payments are sticky and backlog-like. Fine‑tuned dispatch and market bidding captured incremental revenue in 2024, delivering quiet, repeatable cash flow across cycles.
- Hydro emphasis: stable capacity/ancillary mix
- 2024 fleet: ~22.7 GW total
- Revenue: sticky, low-capex margin
- Ops focus: dispatch/bidding to capture extras
Operating storage with fixed or hedged revenues
Older or fully contracted batteries in Brookfield Renewable yield stable, predictable cashflows; growth in these pockets has cooled but contracted revenues keep cash coming. Managing degradation and optimizing contracts preserves margin and availability, making these assets a reliable internal funding source.
- 2024: Brookfield Renewable >20 GW global capacity
- Older/contracted storage delivers steady cashflow
- Focus: degradation management and contract optimization
Legacy hydro and mature wind/solar: low-cost, ~80% contracted cash fuels growth
Brookfield Renewable’s legacy hydro (~22.7 GW in 2024) and mature wind/solar (~21 GW contracted base) produce low‑cost, ~80% contracted cashflows (avg PPA ~12 years), yielding steady distributable cash used to fund higher‑growth projects. Operations focus on uptime, dispatch optimization and refinancings; contracted storage adds predictable cash while growth capex is modest.
| Asset | 2024 GW | Contracted% | Avg PPA yrs | Role |
|---|---|---|---|---|
| Hydro | 22.7 | ≈80 | 12 | Cash cow/ancillary |
| Wind | ~21 | ~80 | 12 | Stable EBITDA |
| Solar | — | High | 15–25 | Predictable cash |
| Storage | — | Contracted pockets | — | Reliable cash |
Delivered as Shown
Brookfield Renewable Partners BCG Matrix
The Brookfield Renewable Partners BCG Matrix you’re previewing is the exact file you’ll receive after purchase. No watermarks, no placeholders—just a fully formatted, analysis-ready matrix built for strategic decisions. Once purchased, the same document is yours to download, edit, print, or present. Professional, clear, and ready for immediate use.
Original: $10.00
-65%$10.00
$3.50Description
Download Your Competitive Advantage
Brookfield Renewable Partners sits at an interesting crossroads—several hydro and wind assets look like Cash Cows, while newer storage and emerging-market projects read as Question Marks that could flip to Stars with capital and scale. Our BCG Matrix preview maps where cash is coming from and where growth bets live, so you can spot allocation priorities fast. This sneak peek helps, but the full BCG Matrix delivers quadrant-by-quadrant insights, clear recommendations, and editable Word + Excel files. Purchase now for a ready-to-use strategic tool.
Stars
Utility-scale solar development pipeline
Fast-growing demand and steep cost declines—solar PV represented roughly 60% of global power capacity additions in 2023—favor large utility-scale builds in core markets. Brookfield Renewable’s scale, site ownership and offtake credibility give a strong and rising share in this segment. Exceptional near-term capex and origination muscle are required now, but existing momentum converts to leadership. Continued investment recommended to cement position before growth moderates.
Grid-scale battery storage platforms
Grid-scale battery storage is booming as grids integrate intermittent renewables, with global battery deployments reaching roughly 30 GW in 2024 and year‑over‑year growth exceeding 50%.
Brookfield’s co‑location and dispatch know‑how provide a commercial edge in stacking revenue streams, yet the market remains a land‑grab dominated by rapid site acquisitions.
Capital intensity is high and returns hinge on smart market participation, merchant price capture and ancillary services; policy tailwinds and near‑term growth justify doubling down while incentives and demand persist.
Onshore wind repowering programs
Onshore wind repowers lift capacity 20–40% and extend life 15–25 years where Brookfield already holds footprint and permits. In 2024 repowering pipelines accelerated in Europe and North America, and Brookfield’s scale and O&M expertise materially advantaged its share. Cash in equals cash out initially as turbines and cranes soak capital; push now to lock future cash‑cow status.
Hybrid renewable hubs (solar + wind + storage)
Hybrid renewable hubs (solar + wind + storage) sit in the BCG Matrix as a rising Star for Brookfield Renewable: integrated hubs squeeze more value from the same interconnect and Brookfield’s portfolio breadth lets it stack revenues and raise capacity factors in growth regions; Brookfield Renewable reported over 20 GW of operating capacity in 2024, but these platforms remain execution-heavy and capex-hungry today while offering ownership of key nodes.
Corporate PPAs with investment‑grade buyers
Corporate PPAs with investment‑grade buyers are a Star: enterprise demand surged with global corporate PPA signings ~25 GW in 2024 (BloombergNEF), and Brookfield’s brand plus balance sheet win large multi‑site deals, growing share in the high‑margin segment; however origination and customization keep support costs elevated so scaling the sales engine is critical.
- Demand: ~25 GW global corporate PPAs in 2024
- Strength: brand + balance sheet win multi‑site deals
- Cost: high origination/customization
- Priority: scale sales/origination engine
Solar PV ~60% 2023; 30 GW batteries, 25 GW PPAs
Solar PV drove ~60% of 2023 global power additions; Brookfield’s scale and site control position it as a Star. Grid batteries hit ~30 GW deployed in 2024, favoring co‑located dispatch stacks. Hybrid hubs leverage Brookfield’s >20 GW operating base in 2024 but remain capex‑heavy. Corporate PPAs ~25 GW in 2024 underpin high‑margin origination growth.
| Segment | 2023‑24 Metric | Brookfield Position |
|---|---|---|
| Solar PV | 60% of 2023 additions | Scale/site ownership |
| Battery Storage | ~30 GW deployed (2024) | Co‑location advantage |
| Hybrid Hubs | 20+ GW operating (2024) | Execution‑heavy Star |
| Corporate PPAs | ~25 GW signed (2024) | Origination growth |
What is included in the product
Detailed Word Document
Brookfield Renewable BCG Matrix: maps assets to Stars, Cash Cows, Question Marks, Dogs with invest/hold/divest guidance and trends.
Customizable Excel Spreadsheet
One-page BCG view of Brookfield Renewable units, clarifying priorities for investment and divestment.
Cash Cows
Legacy hydroelectric fleet with long-term contracts
Brookfield Renewable’s legacy hydro fleet, operating for decades and totaling roughly 21 GW of capacity in 2024, delivers very low marginal costs and largely contracted cash flows (contracts cover about 80% of generation, average remaining PPA life ~12 years). Growth is modest but margins are stout and predictable, driving stable distributable cash. Minimal promotion is needed—operations focus on uptime and incremental upgrades—milking steady cash to fund new builds.
Mature onshore wind in stabilized markets
Mature onshore wind in stabilized markets delivers dependable EBITDA under long-term PPAs, supported by Brookfield Renewable's approximately 21 GW of generating capacity (2024). Opex discipline and asset-life extensions raise free cash by reducing downtime and deferring major capex. Little need for big growth spend beyond routine maintenance; focus is optimize, refinance, and harvest.
Contracted utility‑scale solar in core geographies
Contracted utility‑scale solar in core geographies provides Brookfield Renewable predictable inflows under long‑term PPAs (typically 15–25 years) in 2024, with limited cash‑flow volatility. Market maturity means upside is efficiency, not scale; trackers and O&M tech can boost yield materially and financing tweaks can improve returns by tens to low hundreds of basis points. Proceeds finance higher‑growth Stars.
Hydro ancillary services and capacity revenues
Flexible hydro at Brookfield Renewable, within a 2024 operational fleet of about 22.7 GW, earns capacity and ancillary grid services with minimal incremental capex; market growth is broadly flat but those payments are sticky and backlog-like. Fine‑tuned dispatch and market bidding captured incremental revenue in 2024, delivering quiet, repeatable cash flow across cycles.
- Hydro emphasis: stable capacity/ancillary mix
- 2024 fleet: ~22.7 GW total
- Revenue: sticky, low-capex margin
- Ops focus: dispatch/bidding to capture extras
Operating storage with fixed or hedged revenues
Older or fully contracted batteries in Brookfield Renewable yield stable, predictable cashflows; growth in these pockets has cooled but contracted revenues keep cash coming. Managing degradation and optimizing contracts preserves margin and availability, making these assets a reliable internal funding source.
- 2024: Brookfield Renewable >20 GW global capacity
- Older/contracted storage delivers steady cashflow
- Focus: degradation management and contract optimization
Legacy hydro and mature wind/solar: low-cost, ~80% contracted cash fuels growth
Brookfield Renewable’s legacy hydro (~22.7 GW in 2024) and mature wind/solar (~21 GW contracted base) produce low‑cost, ~80% contracted cashflows (avg PPA ~12 years), yielding steady distributable cash used to fund higher‑growth projects. Operations focus on uptime, dispatch optimization and refinancings; contracted storage adds predictable cash while growth capex is modest.
| Asset | 2024 GW | Contracted% | Avg PPA yrs | Role |
|---|---|---|---|---|
| Hydro | 22.7 | ≈80 | 12 | Cash cow/ancillary |
| Wind | ~21 | ~80 | 12 | Stable EBITDA |
| Solar | — | High | 15–25 | Predictable cash |
| Storage | — | Contracted pockets | — | Reliable cash |
Delivered as Shown
Brookfield Renewable Partners BCG Matrix
The Brookfield Renewable Partners BCG Matrix you’re previewing is the exact file you’ll receive after purchase. No watermarks, no placeholders—just a fully formatted, analysis-ready matrix built for strategic decisions. Once purchased, the same document is yours to download, edit, print, or present. Professional, clear, and ready for immediate use.











