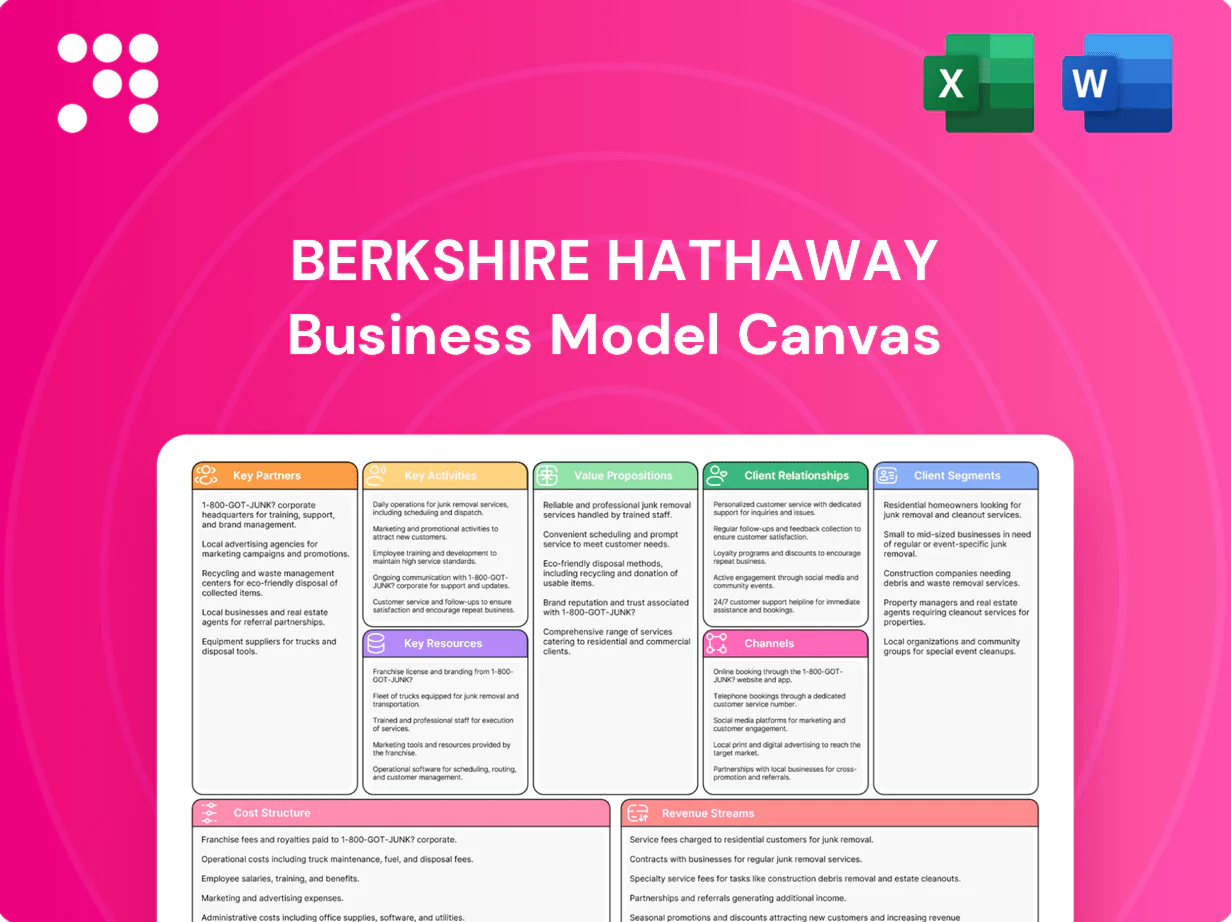
Berkshire Hathaway Business Model Canvas

Business Model Canvas: Strategic Blueprint for Long-Term Value and Revenue Streams
Unlock the full strategic blueprint behind Berkshire Hathaway’s business model with our concise Business Model Canvas. This downloadable file breaks down value propositions, key partners, revenue streams and financial implications for investors and strategists. Buy the full Canvas to apply proven insights to your analysis and planning.
Partnerships

Reinsurers & Co-insurers
Partnerships with reinsurers and co-insurers let Berkshire share large and catastrophe-exposed risks, helping stabilize loss volatility while its insurance float exceeded $100 billion in 2024. These relationships expand underwriting capacity without proportionally increasing capital at risk and provide specialized expertise and timely pricing signals. Counterparty selection and credit quality are tightly managed to protect the float and long-term investment flexibility.
Regulators & Rating Agencies
Berkshire coordinates with insurance, railroad (BNSF) and utility (Berkshire Hathaway Energy) regulators to maintain licenses and compliant operations. Strong ties with rating agencies—S&P AA and Moody's Aa2—help sustain superior credit standing and lower capital costs. Transparent reporting underpins regulatory trust and favorable rate-case outcomes, supporting long-duration contracting and investor confidence.

Industrial & OEM Suppliers
Key suppliers provide locomotives, rolling stock, turbines, transformers, and components for rail, energy, and manufacturing. BNSF operates about 32,500 route miles and roughly 8,000 locomotives, underscoring supplier scale. Strategic sourcing and long-term agreements secure availability and cost predictability. Supplier collaboration enforces reliability and safety while dual-sourcing mitigates disruption risk.

Commercial Customers & Shippers
Collaborative partnerships with major shippers and corporate accounts let Berkshire Hathaway’s BNSF (≈32,500 route-miles) optimize rail logistics and energy load planning, leveraging that U.S. freight rail moves roughly 40% of freight by ton-miles. Joint planning reduces bottlenecks and improves on-time performance; multi-year agreements (commonly 3–5 years) create volume visibility. Data-sharing across partners enhances network efficiency and customer outcomes.
- Route-miles: 32,500+
- Freight share: ~40% of U.S. ton-miles
- Contract terms: 3–5 years
- Outcome: improved on-time performance via data-sharing
Technology & Infrastructure Vendors
Partnerships with IT, telematics, grid and cyber vendors modernize underwriting, claims, rail signaling and utility ops, leveraging BNSF’s ~32,500 route miles and Berkshire Hathaway Energy grids; vendors accelerate digital capability while limiting in-house build costs and meeting 99.9% uptime SLAs.
- 99.9% uptime SLA
- BNSF ~32,500 route miles
- Continuous upgrades = scalability & resilience
Reinsurers steady float >$100B; rail network 32,500 mi
Berkshire leverages reinsurers and co-insurers to stabilize loss volatility and support insurance float >$100B (2024), while managing counterparty credit and underwriting capacity. Regulatory and rating relationships (S&P AA, Moody's Aa2) preserve capital efficiency. Supply, IT and shipper partnerships (BNSF 32,500 route-miles, ~40% U.S. ton-miles) secure operations and digital resilience.
| Metric | Value (2024) |
|---|---|
| Insurance float | >$100B |
| BNSF route-miles | 32,500+ |
| Freight share | ~40% ton-miles |
| Ratings | S&P AA, Moody's Aa2 |
| Uptime SLA | 99.9% |
What is included in the product
 Detailed Word Document
A comprehensive Business Model Canvas for Berkshire Hathaway detailing customer segments, channels, value propositions, key partners, activities, resources, cost structure and revenue streams across the 9 blocks; includes competitive advantages, SWOT-linked insights and practical use for investors, analysts and strategic planning.

 Customizable Excel Spreadsheet
Condenses Berkshire Hathaway’s diverse conglomerate strategy into a digestible one-page canvas, saving hours of analysis while quickly highlighting core value drivers, capital allocation decisions, and acquisition priorities for teams and boardrooms.
Activities

Capital Allocation
Capital allocation at Berkshire deploys retained earnings into acquisitions, organic capex, buybacks and securities to compound value; cash and equivalents roughly $168 billion (mid-2024), enabling large moves. Management applies disciplined hurdle rates and opportunity-cost thinking to prioritize returns. Liquidity is conserved for high-conviction deals while tax-efficient structuring boosts after-tax returns.
Underwriting Discipline
Rigorous risk selection and pricing at Berkshire protect a sizable insurance float—about $200 billion in 2024—by avoiding underpriced business. Cycle-aware capacity management reins in exposure when market pricing softens, preserving underwriting discipline. Conservative reserving bolsters balance sheet strength, while disciplined claims handling keeps loss ratios controlled and reinforces brand trust.

Operational Excellence
Continuous improvement across BNSF (about 32,500 route miles) and Berkshire Hathaway Energy (roughly 4.9 million customers) drives measurable gains in safety, reliability, and cost position. Lean processes and data-driven maintenance cut downtime and extend asset life. Customer service metrics directly inform incentive structures, while local autonomy enables fast, context-specific operational decisions.

Risk & Liquidity Management
Berkshire operates enterprise risk frameworks covering catastrophe, market, credit, operational and regulatory risks, with asset‑liability discipline aligning float duration to stress scenarios. The firm maintains cash and short‑duration Treasuries in excess of $150 billion to preserve optionality and deploy capital quickly. Hedging is used selectively when economics and counterparty terms justify protection.
- Risk coverage: catastrophe, market, credit, operational, regulatory
- Liquidity: >$150 billion cash + short-duration Treasuries
- ALM: float-duration aligned to stress tests
- Hedging: selective, economics-driven
M&A & Integration
Sourcing and evaluating high-quality, moat-protected businesses is continuous, with Berkshire historically acquiring and holding over 60 large operating companies; deal terms prioritize permanence, culture fit, and decentralized stewardship. Post-acquisition, Berkshire exercises minimal central interference to preserve entrepreneurial drive while aligning incentives so owner-operators focus on long-term value creation.
- focus: permanence & culture
- scope: 60+ operating companies
- governance: decentralized stewardship
- alignment: owner-operator incentives
Disciplined capital: $168B cash, $200B insurance float
Capital allocation: $168B cash (mid-2024), disciplined acquisitions and buybacks. Insurance underwriting protects ~ $200B float (2024) with conservative reserving. Operations: BNSF 32,500 route miles; BHE ~4.9M customers; 60+ large subsidiaries run decentralized.
| Metric | 2024 |
|---|---|
| Cash & equivalents | $168B |
| Insurance float | $200B |
| BNSF route miles | 32,500 |
| BHE customers | 4.9M |
| Large subsidiaries | 60+ |
Full Version Awaits
Business Model Canvas
The Berkshire Hathaway Business Model Canvas shown here is the actual deliverable, not a mockup. When you purchase, you’ll receive this exact document—complete and ready to edit, present, or share. No hidden pages or altered content; what you preview is what you’ll download.

Business Model Canvas: Strategic Blueprint for Long-Term Value and Revenue Streams
Unlock the full strategic blueprint behind Berkshire Hathaway’s business model with our concise Business Model Canvas. This downloadable file breaks down value propositions, key partners, revenue streams and financial implications for investors and strategists. Buy the full Canvas to apply proven insights to your analysis and planning.
Partnerships
Reinsurers & Co-insurers
Partnerships with reinsurers and co-insurers let Berkshire share large and catastrophe-exposed risks, helping stabilize loss volatility while its insurance float exceeded $100 billion in 2024. These relationships expand underwriting capacity without proportionally increasing capital at risk and provide specialized expertise and timely pricing signals. Counterparty selection and credit quality are tightly managed to protect the float and long-term investment flexibility.
Regulators & Rating Agencies
Berkshire coordinates with insurance, railroad (BNSF) and utility (Berkshire Hathaway Energy) regulators to maintain licenses and compliant operations. Strong ties with rating agencies—S&P AA and Moody's Aa2—help sustain superior credit standing and lower capital costs. Transparent reporting underpins regulatory trust and favorable rate-case outcomes, supporting long-duration contracting and investor confidence.
Industrial & OEM Suppliers
Key suppliers provide locomotives, rolling stock, turbines, transformers, and components for rail, energy, and manufacturing. BNSF operates about 32,500 route miles and roughly 8,000 locomotives, underscoring supplier scale. Strategic sourcing and long-term agreements secure availability and cost predictability. Supplier collaboration enforces reliability and safety while dual-sourcing mitigates disruption risk.
Commercial Customers & Shippers
Collaborative partnerships with major shippers and corporate accounts let Berkshire Hathaway’s BNSF (≈32,500 route-miles) optimize rail logistics and energy load planning, leveraging that U.S. freight rail moves roughly 40% of freight by ton-miles. Joint planning reduces bottlenecks and improves on-time performance; multi-year agreements (commonly 3–5 years) create volume visibility. Data-sharing across partners enhances network efficiency and customer outcomes.
- Route-miles: 32,500+
- Freight share: ~40% of U.S. ton-miles
- Contract terms: 3–5 years
- Outcome: improved on-time performance via data-sharing
Technology & Infrastructure Vendors
Partnerships with IT, telematics, grid and cyber vendors modernize underwriting, claims, rail signaling and utility ops, leveraging BNSF’s ~32,500 route miles and Berkshire Hathaway Energy grids; vendors accelerate digital capability while limiting in-house build costs and meeting 99.9% uptime SLAs.
- 99.9% uptime SLA
- BNSF ~32,500 route miles
- Continuous upgrades = scalability & resilience
Reinsurers steady float >$100B; rail network 32,500 mi
Berkshire leverages reinsurers and co-insurers to stabilize loss volatility and support insurance float >$100B (2024), while managing counterparty credit and underwriting capacity. Regulatory and rating relationships (S&P AA, Moody's Aa2) preserve capital efficiency. Supply, IT and shipper partnerships (BNSF 32,500 route-miles, ~40% U.S. ton-miles) secure operations and digital resilience.
| Metric | Value (2024) |
|---|---|
| Insurance float | >$100B |
| BNSF route-miles | 32,500+ |
| Freight share | ~40% ton-miles |
| Ratings | S&P AA, Moody's Aa2 |
| Uptime SLA | 99.9% |
What is included in the product
Detailed Word Document
A comprehensive Business Model Canvas for Berkshire Hathaway detailing customer segments, channels, value propositions, key partners, activities, resources, cost structure and revenue streams across the 9 blocks; includes competitive advantages, SWOT-linked insights and practical use for investors, analysts and strategic planning.
Customizable Excel Spreadsheet
Condenses Berkshire Hathaway’s diverse conglomerate strategy into a digestible one-page canvas, saving hours of analysis while quickly highlighting core value drivers, capital allocation decisions, and acquisition priorities for teams and boardrooms.
Activities
Capital Allocation
Capital allocation at Berkshire deploys retained earnings into acquisitions, organic capex, buybacks and securities to compound value; cash and equivalents roughly $168 billion (mid-2024), enabling large moves. Management applies disciplined hurdle rates and opportunity-cost thinking to prioritize returns. Liquidity is conserved for high-conviction deals while tax-efficient structuring boosts after-tax returns.
Underwriting Discipline
Rigorous risk selection and pricing at Berkshire protect a sizable insurance float—about $200 billion in 2024—by avoiding underpriced business. Cycle-aware capacity management reins in exposure when market pricing softens, preserving underwriting discipline. Conservative reserving bolsters balance sheet strength, while disciplined claims handling keeps loss ratios controlled and reinforces brand trust.
Operational Excellence
Continuous improvement across BNSF (about 32,500 route miles) and Berkshire Hathaway Energy (roughly 4.9 million customers) drives measurable gains in safety, reliability, and cost position. Lean processes and data-driven maintenance cut downtime and extend asset life. Customer service metrics directly inform incentive structures, while local autonomy enables fast, context-specific operational decisions.
Risk & Liquidity Management
Berkshire operates enterprise risk frameworks covering catastrophe, market, credit, operational and regulatory risks, with asset‑liability discipline aligning float duration to stress scenarios. The firm maintains cash and short‑duration Treasuries in excess of $150 billion to preserve optionality and deploy capital quickly. Hedging is used selectively when economics and counterparty terms justify protection.
- Risk coverage: catastrophe, market, credit, operational, regulatory
- Liquidity: >$150 billion cash + short-duration Treasuries
- ALM: float-duration aligned to stress tests
- Hedging: selective, economics-driven
M&A & Integration
Sourcing and evaluating high-quality, moat-protected businesses is continuous, with Berkshire historically acquiring and holding over 60 large operating companies; deal terms prioritize permanence, culture fit, and decentralized stewardship. Post-acquisition, Berkshire exercises minimal central interference to preserve entrepreneurial drive while aligning incentives so owner-operators focus on long-term value creation.
- focus: permanence & culture
- scope: 60+ operating companies
- governance: decentralized stewardship
- alignment: owner-operator incentives
Disciplined capital: $168B cash, $200B insurance float
Capital allocation: $168B cash (mid-2024), disciplined acquisitions and buybacks. Insurance underwriting protects ~ $200B float (2024) with conservative reserving. Operations: BNSF 32,500 route miles; BHE ~4.9M customers; 60+ large subsidiaries run decentralized.
| Metric | 2024 |
|---|---|
| Cash & equivalents | $168B |
| Insurance float | $200B |
| BNSF route miles | 32,500 |
| BHE customers | 4.9M |
| Large subsidiaries | 60+ |
Full Version Awaits
Business Model Canvas
The Berkshire Hathaway Business Model Canvas shown here is the actual deliverable, not a mockup. When you purchase, you’ll receive this exact document—complete and ready to edit, present, or share. No hidden pages or altered content; what you preview is what you’ll download.
Original: $10.00
-65%$10.00
$3.50Description
Business Model Canvas: Strategic Blueprint for Long-Term Value and Revenue Streams
Unlock the full strategic blueprint behind Berkshire Hathaway’s business model with our concise Business Model Canvas. This downloadable file breaks down value propositions, key partners, revenue streams and financial implications for investors and strategists. Buy the full Canvas to apply proven insights to your analysis and planning.
Partnerships
Reinsurers & Co-insurers
Partnerships with reinsurers and co-insurers let Berkshire share large and catastrophe-exposed risks, helping stabilize loss volatility while its insurance float exceeded $100 billion in 2024. These relationships expand underwriting capacity without proportionally increasing capital at risk and provide specialized expertise and timely pricing signals. Counterparty selection and credit quality are tightly managed to protect the float and long-term investment flexibility.
Regulators & Rating Agencies
Berkshire coordinates with insurance, railroad (BNSF) and utility (Berkshire Hathaway Energy) regulators to maintain licenses and compliant operations. Strong ties with rating agencies—S&P AA and Moody's Aa2—help sustain superior credit standing and lower capital costs. Transparent reporting underpins regulatory trust and favorable rate-case outcomes, supporting long-duration contracting and investor confidence.
Industrial & OEM Suppliers
Key suppliers provide locomotives, rolling stock, turbines, transformers, and components for rail, energy, and manufacturing. BNSF operates about 32,500 route miles and roughly 8,000 locomotives, underscoring supplier scale. Strategic sourcing and long-term agreements secure availability and cost predictability. Supplier collaboration enforces reliability and safety while dual-sourcing mitigates disruption risk.
Commercial Customers & Shippers
Collaborative partnerships with major shippers and corporate accounts let Berkshire Hathaway’s BNSF (≈32,500 route-miles) optimize rail logistics and energy load planning, leveraging that U.S. freight rail moves roughly 40% of freight by ton-miles. Joint planning reduces bottlenecks and improves on-time performance; multi-year agreements (commonly 3–5 years) create volume visibility. Data-sharing across partners enhances network efficiency and customer outcomes.
- Route-miles: 32,500+
- Freight share: ~40% of U.S. ton-miles
- Contract terms: 3–5 years
- Outcome: improved on-time performance via data-sharing
Technology & Infrastructure Vendors
Partnerships with IT, telematics, grid and cyber vendors modernize underwriting, claims, rail signaling and utility ops, leveraging BNSF’s ~32,500 route miles and Berkshire Hathaway Energy grids; vendors accelerate digital capability while limiting in-house build costs and meeting 99.9% uptime SLAs.
- 99.9% uptime SLA
- BNSF ~32,500 route miles
- Continuous upgrades = scalability & resilience
Reinsurers steady float >$100B; rail network 32,500 mi
Berkshire leverages reinsurers and co-insurers to stabilize loss volatility and support insurance float >$100B (2024), while managing counterparty credit and underwriting capacity. Regulatory and rating relationships (S&P AA, Moody's Aa2) preserve capital efficiency. Supply, IT and shipper partnerships (BNSF 32,500 route-miles, ~40% U.S. ton-miles) secure operations and digital resilience.
| Metric | Value (2024) |
|---|---|
| Insurance float | >$100B |
| BNSF route-miles | 32,500+ |
| Freight share | ~40% ton-miles |
| Ratings | S&P AA, Moody's Aa2 |
| Uptime SLA | 99.9% |
What is included in the product
Detailed Word Document
A comprehensive Business Model Canvas for Berkshire Hathaway detailing customer segments, channels, value propositions, key partners, activities, resources, cost structure and revenue streams across the 9 blocks; includes competitive advantages, SWOT-linked insights and practical use for investors, analysts and strategic planning.
Customizable Excel Spreadsheet
Condenses Berkshire Hathaway’s diverse conglomerate strategy into a digestible one-page canvas, saving hours of analysis while quickly highlighting core value drivers, capital allocation decisions, and acquisition priorities for teams and boardrooms.
Activities
Capital Allocation
Capital allocation at Berkshire deploys retained earnings into acquisitions, organic capex, buybacks and securities to compound value; cash and equivalents roughly $168 billion (mid-2024), enabling large moves. Management applies disciplined hurdle rates and opportunity-cost thinking to prioritize returns. Liquidity is conserved for high-conviction deals while tax-efficient structuring boosts after-tax returns.
Underwriting Discipline
Rigorous risk selection and pricing at Berkshire protect a sizable insurance float—about $200 billion in 2024—by avoiding underpriced business. Cycle-aware capacity management reins in exposure when market pricing softens, preserving underwriting discipline. Conservative reserving bolsters balance sheet strength, while disciplined claims handling keeps loss ratios controlled and reinforces brand trust.
Operational Excellence
Continuous improvement across BNSF (about 32,500 route miles) and Berkshire Hathaway Energy (roughly 4.9 million customers) drives measurable gains in safety, reliability, and cost position. Lean processes and data-driven maintenance cut downtime and extend asset life. Customer service metrics directly inform incentive structures, while local autonomy enables fast, context-specific operational decisions.
Risk & Liquidity Management
Berkshire operates enterprise risk frameworks covering catastrophe, market, credit, operational and regulatory risks, with asset‑liability discipline aligning float duration to stress scenarios. The firm maintains cash and short‑duration Treasuries in excess of $150 billion to preserve optionality and deploy capital quickly. Hedging is used selectively when economics and counterparty terms justify protection.
- Risk coverage: catastrophe, market, credit, operational, regulatory
- Liquidity: >$150 billion cash + short-duration Treasuries
- ALM: float-duration aligned to stress tests
- Hedging: selective, economics-driven
M&A & Integration
Sourcing and evaluating high-quality, moat-protected businesses is continuous, with Berkshire historically acquiring and holding over 60 large operating companies; deal terms prioritize permanence, culture fit, and decentralized stewardship. Post-acquisition, Berkshire exercises minimal central interference to preserve entrepreneurial drive while aligning incentives so owner-operators focus on long-term value creation.
- focus: permanence & culture
- scope: 60+ operating companies
- governance: decentralized stewardship
- alignment: owner-operator incentives
Disciplined capital: $168B cash, $200B insurance float
Capital allocation: $168B cash (mid-2024), disciplined acquisitions and buybacks. Insurance underwriting protects ~ $200B float (2024) with conservative reserving. Operations: BNSF 32,500 route miles; BHE ~4.9M customers; 60+ large subsidiaries run decentralized.
| Metric | 2024 |
|---|---|
| Cash & equivalents | $168B |
| Insurance float | $200B |
| BNSF route miles | 32,500 |
| BHE customers | 4.9M |
| Large subsidiaries | 60+ |
Full Version Awaits
Business Model Canvas
The Berkshire Hathaway Business Model Canvas shown here is the actual deliverable, not a mockup. When you purchase, you’ll receive this exact document—complete and ready to edit, present, or share. No hidden pages or altered content; what you preview is what you’ll download.











