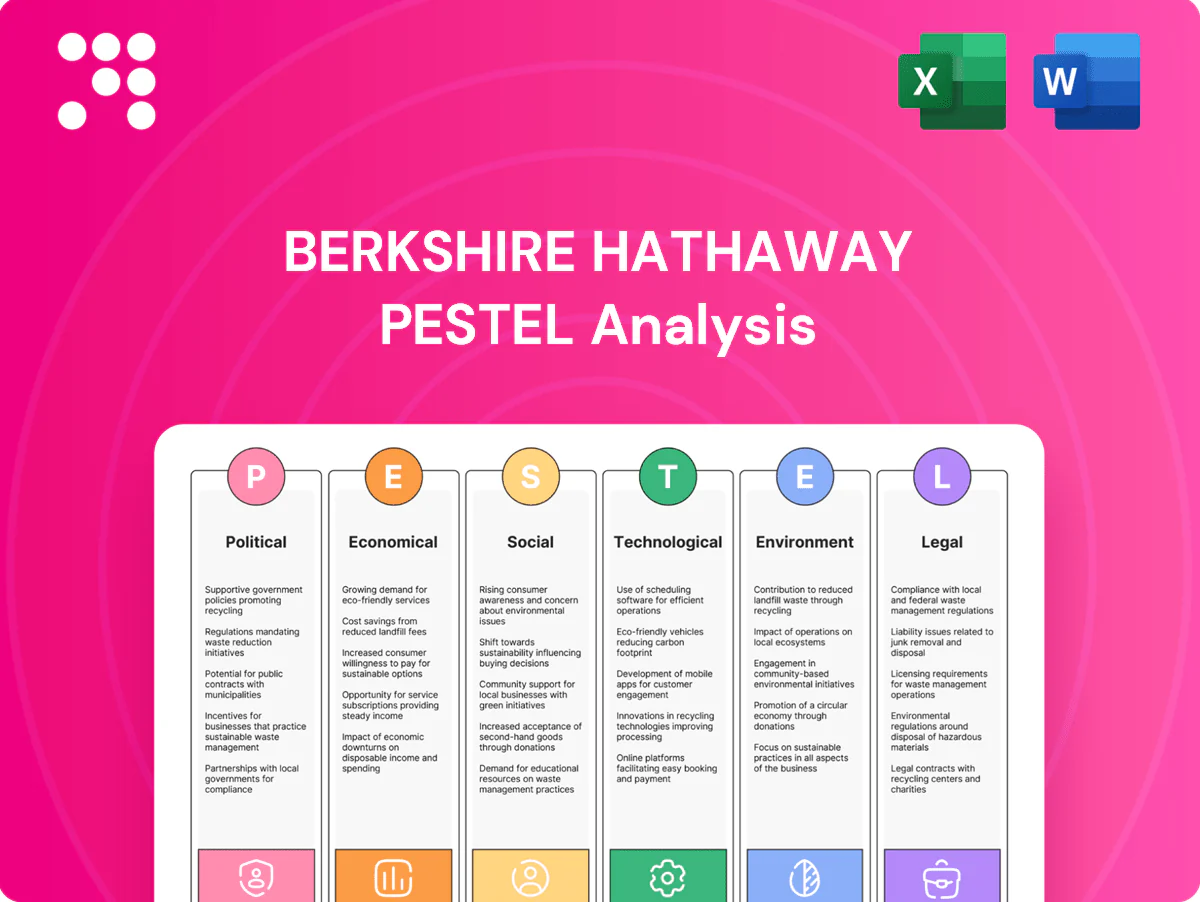
Berkshire Hathaway PESTLE Analysis

Plan Smarter. Present Sharper. Compete Stronger.
Gain a strategic edge with our PESTLE Analysis of Berkshire Hathaway. Understand how political, economic, social, technological, legal and environmental forces shape its risks and opportunities. Ready-to-use, research-backed and fully editable. Purchase the full report for instant, actionable insights.
Political factors

Regulatory oversight of insurance and utilities
Insurance and energy subsidiaries face intensive state and federal oversight that shapes pricing, capital and investment decisions, with rate approvals, reserve requirements and utility commission rulings directly affecting returns. Shifts in regulatory philosophy can tighten or relax allowed returns on equity, altering cash flow profiles for Berkshire Hathaway Energy and insurance operations. Berkshire’s decentralized model requires subsidiaries to align strategy and capital plans with diverse regulator expectations to preserve margins.
Fiscal policy and infrastructure spending
Government fiscal initiatives like the $1.2 trillion IIJA (about $550 billion in new spending) boost BNSF freight volumes and construction-materials demand by funding roads, bridges, ports and grid upgrades. Targeted allocations for roads/bridges and rail capacity lift throughput and utility CapEx opportunities, supporting multi-year freight and equipment cycles for Berkshire businesses. Delays or cuts to these programs would directly curb those growth pipelines despite existing policy-backed visibility.

Trade policy and geopolitics
Tariffs, export controls and geopolitical tensions reshape supply chains, commodity flows and BNSF rail traffic mixes across its ~32,500 route miles, raising logistics costs and re-routing volumes. Manufacturing and retail subsidiaries face input-cost swings and sourcing disruptions that pressure margins. Insurance exposures vary with global risk; Berkshire’s insurance float, which exceeded $140 billion in recent years, and broad portfolio diversification help buffer cross-border shocks.

Tax policy and incentives
- Corporate tax: 21% federal; 15% OECD minimum (2024)
- Clean-energy incentives: IRA ~369B — supports BHE capex
- Capital taxes: top cap gains 20% + 3.8% NIIT
- Stable policy favors long-term underwriting/investment
Antitrust and merger scrutiny
Large-scale acquisitions face heightened review that can prolong timelines or impose remedies. Rail and energy assets, such as BNSF (≈32,500 route miles), are particularly sensitive to competition concerns. Berkshire’s sizable minority stakes in public companies, including an Apple stake valued at about $150 billion in 2023, also attract oversight. Prudent deal selection and transparent processes reduce approval risk.
- Heightened review can delay deals or require divestitures
- Rail/energy sensitive — BNSF ≈32,500 route miles
- Large minority stakes (Apple ~ $150bn in 2023) draw scrutiny
- Transparent processes and targeted deals lower approval risk
Regulation, infrastructure and tariffs drive utility-insurer pricing, capital and returns
Regulatory oversight of insurance and utilities shapes pricing, capital and returns; BHE and insurers must meet state/federal rate, reserve and commission rules. IIJA ~$1.2T (≈$550B new) and IRA ~$369B support BNSF volumes and BHE clean-energy capex. Tariffs, geopolitics and tax shifts (US 21%, OECD 15% min) affect costs, capital allocation and deal approvals.
| Metric | Value |
|---|---|
| Insurance float | >$140B |
| BNSF route miles | ≈32,500 |
| Apple stake (2023) | ≈$150B |
What is included in the product
 Detailed Word Document
Explores how Political, Economic, Social, Technological, Environmental and Legal factors uniquely affect Berkshire Hathaway, with data-backed trends and region- and industry-specific examples; designed for executives and investors to identify threats, opportunities and forward-looking scenarios ready for reports or pitch decks.

 Customizable Excel Spreadsheet
A concise, visually segmented Berkshire Hathaway PESTLE summary that relieves meeting prep pain—editable for region or business line, easily dropped into slides or shared across teams for quick alignment and risk discussions.
Economic factors

Interest rates and investment income
Berkshire’s insurance float is invested largely in fixed income, so prevailing rate levels are pivotal to investment earnings; with the Fed funds rate at 5.25–5.50% (mid‑2025) and the 10‑year Treasury around 4.3%, portfolio income has meaningfully risen. Higher yields support net investment income but can compress equity multiples, making duration positioning and liquidity management essential. Rate cycles also affect lapse and new business pricing, altering underwriting economics.
Inflation and cost pass-through
Rising inflation (US CPI ~3.4% in 2024) and wage growth (avg hourly earnings roughly +4% in 2024) raise claims severity for Berkshire’s insurance arm and increase costs for BNSF and manufacturing, while materials inflation pressures replacement and maintenance outlays. Recovery speed depends on pricing power and regulatory approval; persistent inflation compresses margins when rate resets or tariffs are constrained and short-term rates (Fed funds ~5.25–5.50% end-2024) limit relief. Berkshire’s scale—insurance float ~$162bn (2023) and diversified procurement/efficiency programs—helps mitigate input volatility and smooth pass-through.

Freight demand and industrial cycle
BNSF volumes closely follow U.S. industrial production, consumer demand and energy and agricultural shipments, with North American freight rail moving roughly 1.6 trillion ton‑miles annually. Economic slowdowns cut carloads and yield, while recoveries boost freight mix and pricing. Intermodal competitiveness vs trucking shifts as diesel averaged about $3.63/gal in 2024 (EIA), and long‑haul rail economics sustain cyclical resilience.

Energy demand and commodity prices
Power and gas demand, plus improving renewables economics, drive BHE returns; U.S. electricity demand rose about 0.7% in 2023 (EIA) while BHE operates over 10 GW of wind and solar, lowering marginal costs and supporting regulated returns. Fuel cost swings affect BNSF rail volumes in coal, petroleum and chemicals, and commodity cycles ripple through Berkshire’s manufacturing order books. Diversification across utilities, rail and manufacturing dampens consolidated earnings volatility.
- Power/gas demand: +0.7% U.S. electricity sales (2023, EIA)
- Renewables fleet: >10 GW at BHE
- Fuel sensitivity: impacts coal, petroleum, chemicals rail volumes
- Diversification: utilities + rail + manufacturing reduces volatility
Capital allocation and market valuations
Berkshire allocates capital among buybacks, public equities and whole-company acquisitions based on where attractively priced assets appear; availability of deals drives deployment. With more than $100 billion of liquid assets as of 2024, strong cash generation lets Berkshire invest countercyclically when market dislocations arise. Discipline and long-term focus limit overpaying when market multiples are high, preserving value.
- Cash: >$100B (2024)
- Strategy: buybacks, equities, acquisitions
- Market: high multiples constrain deals
- Opportunity: dislocations enable purchases
- Principle: disciplined, long-term value
Regulation, infrastructure and tariffs drive utility-insurer pricing, capital and returns
Interest rates (Fed funds 5.25–5.50% mid‑2025; 10‑yr ≈4.3%) boost fixed‑income returns from Berkshire’s ~$162bn insurance float and >$100bn cash but can compress equity multiples. Inflation/wages (CPI ~3.4% 2024; avg hourly +4% 2024) raise claims and operating costs; scale and diversification (BNSF, BHE, manufacturing) mitigate volatility.
| Metric | Value |
|---|---|
| Fed funds | 5.25–5.50% |
| 10‑yr Treasury | ≈4.3% |
| Insurance float (2023) | ~$162bn |
| Cash (2024) | >$100bn |
| BHE renewables | >10 GW |
| US CPI (2024) | ~3.4% |
Same Document Delivered
Berkshire Hathaway PESTLE Analysis
This Berkshire Hathaway PESTLE analysis examines political, economic, social, technological, legal, and environmental factors shaping the conglomerate’s strategy and risks. The preview shown here is the exact document you’ll receive after purchase—fully formatted and ready to use. It’s concise, actionable, and download-ready upon payment.

Plan Smarter. Present Sharper. Compete Stronger.
Gain a strategic edge with our PESTLE Analysis of Berkshire Hathaway. Understand how political, economic, social, technological, legal and environmental forces shape its risks and opportunities. Ready-to-use, research-backed and fully editable. Purchase the full report for instant, actionable insights.
Political factors
Regulatory oversight of insurance and utilities
Insurance and energy subsidiaries face intensive state and federal oversight that shapes pricing, capital and investment decisions, with rate approvals, reserve requirements and utility commission rulings directly affecting returns. Shifts in regulatory philosophy can tighten or relax allowed returns on equity, altering cash flow profiles for Berkshire Hathaway Energy and insurance operations. Berkshire’s decentralized model requires subsidiaries to align strategy and capital plans with diverse regulator expectations to preserve margins.
Fiscal policy and infrastructure spending
Government fiscal initiatives like the $1.2 trillion IIJA (about $550 billion in new spending) boost BNSF freight volumes and construction-materials demand by funding roads, bridges, ports and grid upgrades. Targeted allocations for roads/bridges and rail capacity lift throughput and utility CapEx opportunities, supporting multi-year freight and equipment cycles for Berkshire businesses. Delays or cuts to these programs would directly curb those growth pipelines despite existing policy-backed visibility.
Trade policy and geopolitics
Tariffs, export controls and geopolitical tensions reshape supply chains, commodity flows and BNSF rail traffic mixes across its ~32,500 route miles, raising logistics costs and re-routing volumes. Manufacturing and retail subsidiaries face input-cost swings and sourcing disruptions that pressure margins. Insurance exposures vary with global risk; Berkshire’s insurance float, which exceeded $140 billion in recent years, and broad portfolio diversification help buffer cross-border shocks.
Tax policy and incentives
- Corporate tax: 21% federal; 15% OECD minimum (2024)
- Clean-energy incentives: IRA ~369B — supports BHE capex
- Capital taxes: top cap gains 20% + 3.8% NIIT
- Stable policy favors long-term underwriting/investment
Antitrust and merger scrutiny
Large-scale acquisitions face heightened review that can prolong timelines or impose remedies. Rail and energy assets, such as BNSF (≈32,500 route miles), are particularly sensitive to competition concerns. Berkshire’s sizable minority stakes in public companies, including an Apple stake valued at about $150 billion in 2023, also attract oversight. Prudent deal selection and transparent processes reduce approval risk.
- Heightened review can delay deals or require divestitures
- Rail/energy sensitive — BNSF ≈32,500 route miles
- Large minority stakes (Apple ~ $150bn in 2023) draw scrutiny
- Transparent processes and targeted deals lower approval risk
Regulation, infrastructure and tariffs drive utility-insurer pricing, capital and returns
Regulatory oversight of insurance and utilities shapes pricing, capital and returns; BHE and insurers must meet state/federal rate, reserve and commission rules. IIJA ~$1.2T (≈$550B new) and IRA ~$369B support BNSF volumes and BHE clean-energy capex. Tariffs, geopolitics and tax shifts (US 21%, OECD 15% min) affect costs, capital allocation and deal approvals.
| Metric | Value |
|---|---|
| Insurance float | >$140B |
| BNSF route miles | ≈32,500 |
| Apple stake (2023) | ≈$150B |
What is included in the product
Detailed Word Document
Explores how Political, Economic, Social, Technological, Environmental and Legal factors uniquely affect Berkshire Hathaway, with data-backed trends and region- and industry-specific examples; designed for executives and investors to identify threats, opportunities and forward-looking scenarios ready for reports or pitch decks.
Customizable Excel Spreadsheet
A concise, visually segmented Berkshire Hathaway PESTLE summary that relieves meeting prep pain—editable for region or business line, easily dropped into slides or shared across teams for quick alignment and risk discussions.
Economic factors
Interest rates and investment income
Berkshire’s insurance float is invested largely in fixed income, so prevailing rate levels are pivotal to investment earnings; with the Fed funds rate at 5.25–5.50% (mid‑2025) and the 10‑year Treasury around 4.3%, portfolio income has meaningfully risen. Higher yields support net investment income but can compress equity multiples, making duration positioning and liquidity management essential. Rate cycles also affect lapse and new business pricing, altering underwriting economics.
Inflation and cost pass-through
Rising inflation (US CPI ~3.4% in 2024) and wage growth (avg hourly earnings roughly +4% in 2024) raise claims severity for Berkshire’s insurance arm and increase costs for BNSF and manufacturing, while materials inflation pressures replacement and maintenance outlays. Recovery speed depends on pricing power and regulatory approval; persistent inflation compresses margins when rate resets or tariffs are constrained and short-term rates (Fed funds ~5.25–5.50% end-2024) limit relief. Berkshire’s scale—insurance float ~$162bn (2023) and diversified procurement/efficiency programs—helps mitigate input volatility and smooth pass-through.
Freight demand and industrial cycle
BNSF volumes closely follow U.S. industrial production, consumer demand and energy and agricultural shipments, with North American freight rail moving roughly 1.6 trillion ton‑miles annually. Economic slowdowns cut carloads and yield, while recoveries boost freight mix and pricing. Intermodal competitiveness vs trucking shifts as diesel averaged about $3.63/gal in 2024 (EIA), and long‑haul rail economics sustain cyclical resilience.
Energy demand and commodity prices
Power and gas demand, plus improving renewables economics, drive BHE returns; U.S. electricity demand rose about 0.7% in 2023 (EIA) while BHE operates over 10 GW of wind and solar, lowering marginal costs and supporting regulated returns. Fuel cost swings affect BNSF rail volumes in coal, petroleum and chemicals, and commodity cycles ripple through Berkshire’s manufacturing order books. Diversification across utilities, rail and manufacturing dampens consolidated earnings volatility.
- Power/gas demand: +0.7% U.S. electricity sales (2023, EIA)
- Renewables fleet: >10 GW at BHE
- Fuel sensitivity: impacts coal, petroleum, chemicals rail volumes
- Diversification: utilities + rail + manufacturing reduces volatility
Capital allocation and market valuations
Berkshire allocates capital among buybacks, public equities and whole-company acquisitions based on where attractively priced assets appear; availability of deals drives deployment. With more than $100 billion of liquid assets as of 2024, strong cash generation lets Berkshire invest countercyclically when market dislocations arise. Discipline and long-term focus limit overpaying when market multiples are high, preserving value.
- Cash: >$100B (2024)
- Strategy: buybacks, equities, acquisitions
- Market: high multiples constrain deals
- Opportunity: dislocations enable purchases
- Principle: disciplined, long-term value
Regulation, infrastructure and tariffs drive utility-insurer pricing, capital and returns
Interest rates (Fed funds 5.25–5.50% mid‑2025; 10‑yr ≈4.3%) boost fixed‑income returns from Berkshire’s ~$162bn insurance float and >$100bn cash but can compress equity multiples. Inflation/wages (CPI ~3.4% 2024; avg hourly +4% 2024) raise claims and operating costs; scale and diversification (BNSF, BHE, manufacturing) mitigate volatility.
| Metric | Value |
|---|---|
| Fed funds | 5.25–5.50% |
| 10‑yr Treasury | ≈4.3% |
| Insurance float (2023) | ~$162bn |
| Cash (2024) | >$100bn |
| BHE renewables | >10 GW |
| US CPI (2024) | ~3.4% |
Same Document Delivered
Berkshire Hathaway PESTLE Analysis
This Berkshire Hathaway PESTLE analysis examines political, economic, social, technological, legal, and environmental factors shaping the conglomerate’s strategy and risks. The preview shown here is the exact document you’ll receive after purchase—fully formatted and ready to use. It’s concise, actionable, and download-ready upon payment.
Original: $10.00
-65%$10.00
$3.50Description
Plan Smarter. Present Sharper. Compete Stronger.
Gain a strategic edge with our PESTLE Analysis of Berkshire Hathaway. Understand how political, economic, social, technological, legal and environmental forces shape its risks and opportunities. Ready-to-use, research-backed and fully editable. Purchase the full report for instant, actionable insights.
Political factors
Regulatory oversight of insurance and utilities
Insurance and energy subsidiaries face intensive state and federal oversight that shapes pricing, capital and investment decisions, with rate approvals, reserve requirements and utility commission rulings directly affecting returns. Shifts in regulatory philosophy can tighten or relax allowed returns on equity, altering cash flow profiles for Berkshire Hathaway Energy and insurance operations. Berkshire’s decentralized model requires subsidiaries to align strategy and capital plans with diverse regulator expectations to preserve margins.
Fiscal policy and infrastructure spending
Government fiscal initiatives like the $1.2 trillion IIJA (about $550 billion in new spending) boost BNSF freight volumes and construction-materials demand by funding roads, bridges, ports and grid upgrades. Targeted allocations for roads/bridges and rail capacity lift throughput and utility CapEx opportunities, supporting multi-year freight and equipment cycles for Berkshire businesses. Delays or cuts to these programs would directly curb those growth pipelines despite existing policy-backed visibility.
Trade policy and geopolitics
Tariffs, export controls and geopolitical tensions reshape supply chains, commodity flows and BNSF rail traffic mixes across its ~32,500 route miles, raising logistics costs and re-routing volumes. Manufacturing and retail subsidiaries face input-cost swings and sourcing disruptions that pressure margins. Insurance exposures vary with global risk; Berkshire’s insurance float, which exceeded $140 billion in recent years, and broad portfolio diversification help buffer cross-border shocks.
Tax policy and incentives
- Corporate tax: 21% federal; 15% OECD minimum (2024)
- Clean-energy incentives: IRA ~369B — supports BHE capex
- Capital taxes: top cap gains 20% + 3.8% NIIT
- Stable policy favors long-term underwriting/investment
Antitrust and merger scrutiny
Large-scale acquisitions face heightened review that can prolong timelines or impose remedies. Rail and energy assets, such as BNSF (≈32,500 route miles), are particularly sensitive to competition concerns. Berkshire’s sizable minority stakes in public companies, including an Apple stake valued at about $150 billion in 2023, also attract oversight. Prudent deal selection and transparent processes reduce approval risk.
- Heightened review can delay deals or require divestitures
- Rail/energy sensitive — BNSF ≈32,500 route miles
- Large minority stakes (Apple ~ $150bn in 2023) draw scrutiny
- Transparent processes and targeted deals lower approval risk
Regulation, infrastructure and tariffs drive utility-insurer pricing, capital and returns
Regulatory oversight of insurance and utilities shapes pricing, capital and returns; BHE and insurers must meet state/federal rate, reserve and commission rules. IIJA ~$1.2T (≈$550B new) and IRA ~$369B support BNSF volumes and BHE clean-energy capex. Tariffs, geopolitics and tax shifts (US 21%, OECD 15% min) affect costs, capital allocation and deal approvals.
| Metric | Value |
|---|---|
| Insurance float | >$140B |
| BNSF route miles | ≈32,500 |
| Apple stake (2023) | ≈$150B |
What is included in the product
Detailed Word Document
Explores how Political, Economic, Social, Technological, Environmental and Legal factors uniquely affect Berkshire Hathaway, with data-backed trends and region- and industry-specific examples; designed for executives and investors to identify threats, opportunities and forward-looking scenarios ready for reports or pitch decks.
Customizable Excel Spreadsheet
A concise, visually segmented Berkshire Hathaway PESTLE summary that relieves meeting prep pain—editable for region or business line, easily dropped into slides or shared across teams for quick alignment and risk discussions.
Economic factors
Interest rates and investment income
Berkshire’s insurance float is invested largely in fixed income, so prevailing rate levels are pivotal to investment earnings; with the Fed funds rate at 5.25–5.50% (mid‑2025) and the 10‑year Treasury around 4.3%, portfolio income has meaningfully risen. Higher yields support net investment income but can compress equity multiples, making duration positioning and liquidity management essential. Rate cycles also affect lapse and new business pricing, altering underwriting economics.
Inflation and cost pass-through
Rising inflation (US CPI ~3.4% in 2024) and wage growth (avg hourly earnings roughly +4% in 2024) raise claims severity for Berkshire’s insurance arm and increase costs for BNSF and manufacturing, while materials inflation pressures replacement and maintenance outlays. Recovery speed depends on pricing power and regulatory approval; persistent inflation compresses margins when rate resets or tariffs are constrained and short-term rates (Fed funds ~5.25–5.50% end-2024) limit relief. Berkshire’s scale—insurance float ~$162bn (2023) and diversified procurement/efficiency programs—helps mitigate input volatility and smooth pass-through.
Freight demand and industrial cycle
BNSF volumes closely follow U.S. industrial production, consumer demand and energy and agricultural shipments, with North American freight rail moving roughly 1.6 trillion ton‑miles annually. Economic slowdowns cut carloads and yield, while recoveries boost freight mix and pricing. Intermodal competitiveness vs trucking shifts as diesel averaged about $3.63/gal in 2024 (EIA), and long‑haul rail economics sustain cyclical resilience.
Energy demand and commodity prices
Power and gas demand, plus improving renewables economics, drive BHE returns; U.S. electricity demand rose about 0.7% in 2023 (EIA) while BHE operates over 10 GW of wind and solar, lowering marginal costs and supporting regulated returns. Fuel cost swings affect BNSF rail volumes in coal, petroleum and chemicals, and commodity cycles ripple through Berkshire’s manufacturing order books. Diversification across utilities, rail and manufacturing dampens consolidated earnings volatility.
- Power/gas demand: +0.7% U.S. electricity sales (2023, EIA)
- Renewables fleet: >10 GW at BHE
- Fuel sensitivity: impacts coal, petroleum, chemicals rail volumes
- Diversification: utilities + rail + manufacturing reduces volatility
Capital allocation and market valuations
Berkshire allocates capital among buybacks, public equities and whole-company acquisitions based on where attractively priced assets appear; availability of deals drives deployment. With more than $100 billion of liquid assets as of 2024, strong cash generation lets Berkshire invest countercyclically when market dislocations arise. Discipline and long-term focus limit overpaying when market multiples are high, preserving value.
- Cash: >$100B (2024)
- Strategy: buybacks, equities, acquisitions
- Market: high multiples constrain deals
- Opportunity: dislocations enable purchases
- Principle: disciplined, long-term value
Regulation, infrastructure and tariffs drive utility-insurer pricing, capital and returns
Interest rates (Fed funds 5.25–5.50% mid‑2025; 10‑yr ≈4.3%) boost fixed‑income returns from Berkshire’s ~$162bn insurance float and >$100bn cash but can compress equity multiples. Inflation/wages (CPI ~3.4% 2024; avg hourly +4% 2024) raise claims and operating costs; scale and diversification (BNSF, BHE, manufacturing) mitigate volatility.
| Metric | Value |
|---|---|
| Fed funds | 5.25–5.50% |
| 10‑yr Treasury | ≈4.3% |
| Insurance float (2023) | ~$162bn |
| Cash (2024) | >$100bn |
| BHE renewables | >10 GW |
| US CPI (2024) | ~3.4% |
Same Document Delivered
Berkshire Hathaway PESTLE Analysis
This Berkshire Hathaway PESTLE analysis examines political, economic, social, technological, legal, and environmental factors shaping the conglomerate’s strategy and risks. The preview shown here is the exact document you’ll receive after purchase—fully formatted and ready to use. It’s concise, actionable, and download-ready upon payment.











