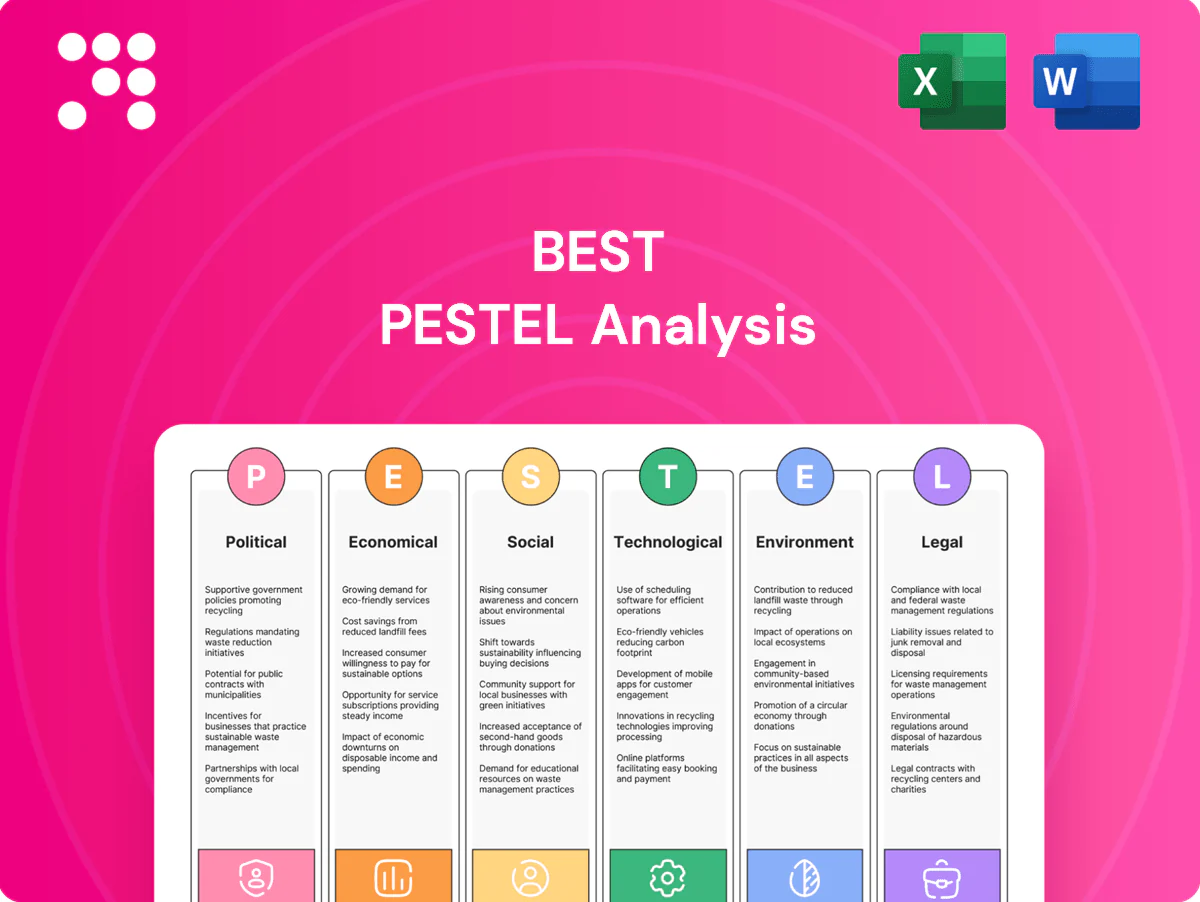
Best PESTLE Analysis

Your Shortcut to Market Insight Starts Here
Unlock strategic advantage with our tailored PESTLE Analysis of Best—clear insights into political, economic, social, technological, legal and environmental forces shaping the company. Use this expert research to anticipate risks, spot growth opportunities, and refine your strategy. Buy the full, ready-to-use report now for the complete, actionable breakdown and immediate download.
Political factors

Trade policy and customs regimes
Changes in tariffs and export controls—eg US Section 301 duties up to 25% on roughly $360bn of Chinese imports—reshape route selection and cost structures, while complex cross-border customs processes increase dwell time and fees. Favorable trade agreements cut transit times and brokerage complexity, lowering landed costs. Protectionism forces delays, higher compliance overhead and inventory buffers. BEST should diversify corridors and keep agile brokerage capabilities.
Government infrastructure investment
Public spending on roads, ports, rail and digital infrastructure directly affects delivery speed and reliability; for example the US Bipartisan Infrastructure Law earmarked about $550 billion in new investment and the BEAD broadband program allocates $42.45 billion to close digital gaps. Strategic investments enable network optimization and hub-placement advantages, while underinvestment raises maintenance costs and service variability. BEST can align expansion with corridors targeted by these projects to capture efficiency gains.

Political stability and security
Unrest, elections, or regional conflicts disrupt transport lanes and warehousing, with Global Peace Index 2024 noting a further deterioration in global peacefulness that raises operational risk. Security risks pushed war‑risk surcharges sharply higher for Red Sea transits in 2023–24, increasing insurance and rerouting costs. Stable jurisdictions show lower service volatility and pricing swings, so BEST needs continuous geopolitical monitoring and redundant lane design to maintain resilience.

Subsidies and incentives for logistics tech
Tax credits and grants for automation, EVs and digitization cut upfront capex barriers and, where available, defray installation and R&D costs; recent U.S. and EU funding rounds through 2024 totaled multi-billion-dollar packages supporting logistics decarbonization. Policies accelerate fleet electrification and smart-sorting adoption, while sudden withdrawal of incentives can extend payback by years. BEST should align major deployments to active policy windows to maximize net present value.
- tax credits/grants reduce capex
- multi-billion funding (US/EU) in 2024
- incentive withdrawal lengthens payback
- time BEST investments to policy windows
Public–private partnerships and localization
Local content rules and PPP frameworks shape contracting and facility siting; World Bank PPI data shows $3.8 trillion invested in infrastructure in developing countries since 1990, underscoring scale and regulatory impact. Partnering with local authorities can unlock land and permits; Nigeria's oil & gas local content law targets roughly 70% local participation as a precedent. Localization mandates often require regional procurement and hiring, and BEST can leverage compliant PPPs to scale last-mile networks.
- Local content: national quotas (example: ~70% Nigeria)
- PPPs: unlock land, permits, risk-sharing
- Localization: regional procurement, hiring requirements
- BEST: use PPPs to scale last-mile compliant networks
Tariffs up to 25%, US $550bn spend reshape supply chains
Tariffs (eg US Section 301 duties up to 25% on ~360bn of Chinese imports) and trade controls raise landed costs and rerouting. Public investment—US Bipartisan Infrastructure Law ~550bn and BEAD 42.45bn—cuts transit time when aligned. Geopolitical risk (Global Peace Index 2024 worsened; Red Sea war‑risk surcharges spiked 2023–24) forces redundant lanes and agile brokerage. Local content/PPPs (World Bank PPI $3.8tn; Nigeria ~70%) affect siting and hiring.
| Factor | 2024/25 datapoint |
|---|---|
| Tariffs | ~$360bn; up to 25% |
| Infrastructure spend | US $550bn; BEAD $42.45bn |
| Local content | World Bank PPI $3.8tn; Nigeria ~70% |
What is included in the product
 Detailed Word Document
Explores how external macro-environmental factors uniquely affect the Best across six dimensions—Political, Economic, Social, Technological, Environmental, and Legal—using data-backed trends and forward-looking insights for scenario planning. Designed for executives and advisors, it maps threats and opportunities with region- and industry-specific examples ready for business plans or investor materials.

 Customizable Excel Spreadsheet
A compact, category-segmented PESTLE summary for quick meeting reference that’s editable with local notes and easily shareable across teams, streamlining external risk discussions and client-ready reports.
Economic factors

Macroeconomic growth and freight demand
Global GDP growth of about 3.0% in 2024 (IMF) drives shipment volumes across B2B and B2C channels, with freight demand closely tracking trade and consumption cycles. Slowdowns compress yields and force price competition as carriers and 3PLs chase volume. Cyclical sectors like autos and construction amplify volume volatility, with swings of 10%+ in peak years. BEST must balance sector exposure and maintain flexible capacity to ride cycles.
E-commerce penetration and basket mix
Global e-commerce sales rose to about $6.3 trillion in 2023 with online share in key markets near 18% in 2024, expanding parcel density and last-mile stops; parcel volumes and stop density rose ~10–15% year-over-year in many metros. Growth in heavy/oversized categories (furniture, groceries) increased freight share by ~12–15%, shifting mix toward specialized handling. Peak season volumes can spike 30–40%, driving surge costs; BEST can monetize via value-added services, premium fulfillment and dynamic pricing to capture higher margins.

Fuel and energy price volatility
Diesel and electricity costs—with Brent averaging about $85/bbl in 2024 and US retail diesel near $4.10/gal while US industrial power ran ≈$0.11/kWh—directly inflate linehaul and facility opex. Fuel surcharges offset some variability but erode customer satisfaction. Hedging, route optimization and telematics cut exposure and fuel burn. BEST should invest in energy-efficient fleet, facility retrofits and alternative fuels (biodiesel, EVs, hydrogen) to lower long-term volatility risk.

Labor market and wage inflation
Tight driver and courier markets—with industry estimates of an 80,000 U.S. driver shortfall (ATA 2023) and turnover often above 50% in last-mile delivery—push wage inflation and retention risk. Training and safety spend improves productivity and lowers claims but raises operating cost. Automation and capital-intensive robotics offset labor constraints; BEST leverages multi-modal staffing and gig partnerships where legal.
- Driver shortage: 80,000 (ATA 2023)
- Turnover: >50% in last-mile (2024 studies)
- Wage inflation: upward pressure on OPEX
- Mitigation: automation, training, gig partnerships
Exchange rates and cross-border costs
Currency swings alter imported equipment costs and foreign revenues and 2024–H1 2025 saw major pairs move roughly 5–12% year-on-year, materially shifting margins; FX volatility also forces frequent repricing of international lanes and contracts. Building natural hedges through local sourcing and local-cost structures can stabilize margins, while BEST should implement targeted FX hedging and shift billing to local currencies where feasible.
- 2024–25 FX moves: ~5–12% Y/Y impact on costs/revenues
- Natural hedges: local costs reduce net exposure
- Actions: use forward/option hedges and local billing
Tariffs up to 25%, US $550bn spend reshape supply chains
Global GDP ~3.0% (IMF 2024) drives freight volumes; e-commerce $6.3T (2023) raises parcel density; energy costs (Brent ~$85/bbl, diesel ~$4.10/gal) and driver shortfall (~80,000 US) inflate OPEX; FX moves 5–12% Y/Y shift margins—BEST must flex capacity, price dynamically, hedge energy/FX and invest in automation.
| Metric | Value |
|---|---|
| Global GDP 2024 | ~3.0% |
| E‑commerce 2023 | $6.3T |
| Brent 2024 | $85/bbl |
| US diesel | $4.10/gal |
| Driver shortfall | ~80,000 |
| FX moves 2024–25 | 5–12% Y/Y |
Same Document Delivered
Best PESTLE Analysis
The preview shown here is the exact Best PESTLE Analysis document you’ll receive after purchase—fully formatted, comprehensive, and ready to use. This screenshot reflects the real file with no placeholders or surprises; the layout, content, and structure are identical to the downloadable final version.

Your Shortcut to Market Insight Starts Here
Unlock strategic advantage with our tailored PESTLE Analysis of Best—clear insights into political, economic, social, technological, legal and environmental forces shaping the company. Use this expert research to anticipate risks, spot growth opportunities, and refine your strategy. Buy the full, ready-to-use report now for the complete, actionable breakdown and immediate download.
Political factors
Trade policy and customs regimes
Changes in tariffs and export controls—eg US Section 301 duties up to 25% on roughly $360bn of Chinese imports—reshape route selection and cost structures, while complex cross-border customs processes increase dwell time and fees. Favorable trade agreements cut transit times and brokerage complexity, lowering landed costs. Protectionism forces delays, higher compliance overhead and inventory buffers. BEST should diversify corridors and keep agile brokerage capabilities.
Government infrastructure investment
Public spending on roads, ports, rail and digital infrastructure directly affects delivery speed and reliability; for example the US Bipartisan Infrastructure Law earmarked about $550 billion in new investment and the BEAD broadband program allocates $42.45 billion to close digital gaps. Strategic investments enable network optimization and hub-placement advantages, while underinvestment raises maintenance costs and service variability. BEST can align expansion with corridors targeted by these projects to capture efficiency gains.
Political stability and security
Unrest, elections, or regional conflicts disrupt transport lanes and warehousing, with Global Peace Index 2024 noting a further deterioration in global peacefulness that raises operational risk. Security risks pushed war‑risk surcharges sharply higher for Red Sea transits in 2023–24, increasing insurance and rerouting costs. Stable jurisdictions show lower service volatility and pricing swings, so BEST needs continuous geopolitical monitoring and redundant lane design to maintain resilience.
Subsidies and incentives for logistics tech
Tax credits and grants for automation, EVs and digitization cut upfront capex barriers and, where available, defray installation and R&D costs; recent U.S. and EU funding rounds through 2024 totaled multi-billion-dollar packages supporting logistics decarbonization. Policies accelerate fleet electrification and smart-sorting adoption, while sudden withdrawal of incentives can extend payback by years. BEST should align major deployments to active policy windows to maximize net present value.
- tax credits/grants reduce capex
- multi-billion funding (US/EU) in 2024
- incentive withdrawal lengthens payback
- time BEST investments to policy windows
Public–private partnerships and localization
Local content rules and PPP frameworks shape contracting and facility siting; World Bank PPI data shows $3.8 trillion invested in infrastructure in developing countries since 1990, underscoring scale and regulatory impact. Partnering with local authorities can unlock land and permits; Nigeria's oil & gas local content law targets roughly 70% local participation as a precedent. Localization mandates often require regional procurement and hiring, and BEST can leverage compliant PPPs to scale last-mile networks.
- Local content: national quotas (example: ~70% Nigeria)
- PPPs: unlock land, permits, risk-sharing
- Localization: regional procurement, hiring requirements
- BEST: use PPPs to scale last-mile compliant networks
Tariffs up to 25%, US $550bn spend reshape supply chains
Tariffs (eg US Section 301 duties up to 25% on ~360bn of Chinese imports) and trade controls raise landed costs and rerouting. Public investment—US Bipartisan Infrastructure Law ~550bn and BEAD 42.45bn—cuts transit time when aligned. Geopolitical risk (Global Peace Index 2024 worsened; Red Sea war‑risk surcharges spiked 2023–24) forces redundant lanes and agile brokerage. Local content/PPPs (World Bank PPI $3.8tn; Nigeria ~70%) affect siting and hiring.
| Factor | 2024/25 datapoint |
|---|---|
| Tariffs | ~$360bn; up to 25% |
| Infrastructure spend | US $550bn; BEAD $42.45bn |
| Local content | World Bank PPI $3.8tn; Nigeria ~70% |
What is included in the product
Detailed Word Document
Explores how external macro-environmental factors uniquely affect the Best across six dimensions—Political, Economic, Social, Technological, Environmental, and Legal—using data-backed trends and forward-looking insights for scenario planning. Designed for executives and advisors, it maps threats and opportunities with region- and industry-specific examples ready for business plans or investor materials.
Customizable Excel Spreadsheet
A compact, category-segmented PESTLE summary for quick meeting reference that’s editable with local notes and easily shareable across teams, streamlining external risk discussions and client-ready reports.
Economic factors
Macroeconomic growth and freight demand
Global GDP growth of about 3.0% in 2024 (IMF) drives shipment volumes across B2B and B2C channels, with freight demand closely tracking trade and consumption cycles. Slowdowns compress yields and force price competition as carriers and 3PLs chase volume. Cyclical sectors like autos and construction amplify volume volatility, with swings of 10%+ in peak years. BEST must balance sector exposure and maintain flexible capacity to ride cycles.
E-commerce penetration and basket mix
Global e-commerce sales rose to about $6.3 trillion in 2023 with online share in key markets near 18% in 2024, expanding parcel density and last-mile stops; parcel volumes and stop density rose ~10–15% year-over-year in many metros. Growth in heavy/oversized categories (furniture, groceries) increased freight share by ~12–15%, shifting mix toward specialized handling. Peak season volumes can spike 30–40%, driving surge costs; BEST can monetize via value-added services, premium fulfillment and dynamic pricing to capture higher margins.
Fuel and energy price volatility
Diesel and electricity costs—with Brent averaging about $85/bbl in 2024 and US retail diesel near $4.10/gal while US industrial power ran ≈$0.11/kWh—directly inflate linehaul and facility opex. Fuel surcharges offset some variability but erode customer satisfaction. Hedging, route optimization and telematics cut exposure and fuel burn. BEST should invest in energy-efficient fleet, facility retrofits and alternative fuels (biodiesel, EVs, hydrogen) to lower long-term volatility risk.
Labor market and wage inflation
Tight driver and courier markets—with industry estimates of an 80,000 U.S. driver shortfall (ATA 2023) and turnover often above 50% in last-mile delivery—push wage inflation and retention risk. Training and safety spend improves productivity and lowers claims but raises operating cost. Automation and capital-intensive robotics offset labor constraints; BEST leverages multi-modal staffing and gig partnerships where legal.
- Driver shortage: 80,000 (ATA 2023)
- Turnover: >50% in last-mile (2024 studies)
- Wage inflation: upward pressure on OPEX
- Mitigation: automation, training, gig partnerships
Exchange rates and cross-border costs
Currency swings alter imported equipment costs and foreign revenues and 2024–H1 2025 saw major pairs move roughly 5–12% year-on-year, materially shifting margins; FX volatility also forces frequent repricing of international lanes and contracts. Building natural hedges through local sourcing and local-cost structures can stabilize margins, while BEST should implement targeted FX hedging and shift billing to local currencies where feasible.
- 2024–25 FX moves: ~5–12% Y/Y impact on costs/revenues
- Natural hedges: local costs reduce net exposure
- Actions: use forward/option hedges and local billing
Tariffs up to 25%, US $550bn spend reshape supply chains
Global GDP ~3.0% (IMF 2024) drives freight volumes; e-commerce $6.3T (2023) raises parcel density; energy costs (Brent ~$85/bbl, diesel ~$4.10/gal) and driver shortfall (~80,000 US) inflate OPEX; FX moves 5–12% Y/Y shift margins—BEST must flex capacity, price dynamically, hedge energy/FX and invest in automation.
| Metric | Value |
|---|---|
| Global GDP 2024 | ~3.0% |
| E‑commerce 2023 | $6.3T |
| Brent 2024 | $85/bbl |
| US diesel | $4.10/gal |
| Driver shortfall | ~80,000 |
| FX moves 2024–25 | 5–12% Y/Y |
Same Document Delivered
Best PESTLE Analysis
The preview shown here is the exact Best PESTLE Analysis document you’ll receive after purchase—fully formatted, comprehensive, and ready to use. This screenshot reflects the real file with no placeholders or surprises; the layout, content, and structure are identical to the downloadable final version.
Original: $10.00
-65%$10.00
$3.50Description
Your Shortcut to Market Insight Starts Here
Unlock strategic advantage with our tailored PESTLE Analysis of Best—clear insights into political, economic, social, technological, legal and environmental forces shaping the company. Use this expert research to anticipate risks, spot growth opportunities, and refine your strategy. Buy the full, ready-to-use report now for the complete, actionable breakdown and immediate download.
Political factors
Trade policy and customs regimes
Changes in tariffs and export controls—eg US Section 301 duties up to 25% on roughly $360bn of Chinese imports—reshape route selection and cost structures, while complex cross-border customs processes increase dwell time and fees. Favorable trade agreements cut transit times and brokerage complexity, lowering landed costs. Protectionism forces delays, higher compliance overhead and inventory buffers. BEST should diversify corridors and keep agile brokerage capabilities.
Government infrastructure investment
Public spending on roads, ports, rail and digital infrastructure directly affects delivery speed and reliability; for example the US Bipartisan Infrastructure Law earmarked about $550 billion in new investment and the BEAD broadband program allocates $42.45 billion to close digital gaps. Strategic investments enable network optimization and hub-placement advantages, while underinvestment raises maintenance costs and service variability. BEST can align expansion with corridors targeted by these projects to capture efficiency gains.
Political stability and security
Unrest, elections, or regional conflicts disrupt transport lanes and warehousing, with Global Peace Index 2024 noting a further deterioration in global peacefulness that raises operational risk. Security risks pushed war‑risk surcharges sharply higher for Red Sea transits in 2023–24, increasing insurance and rerouting costs. Stable jurisdictions show lower service volatility and pricing swings, so BEST needs continuous geopolitical monitoring and redundant lane design to maintain resilience.
Subsidies and incentives for logistics tech
Tax credits and grants for automation, EVs and digitization cut upfront capex barriers and, where available, defray installation and R&D costs; recent U.S. and EU funding rounds through 2024 totaled multi-billion-dollar packages supporting logistics decarbonization. Policies accelerate fleet electrification and smart-sorting adoption, while sudden withdrawal of incentives can extend payback by years. BEST should align major deployments to active policy windows to maximize net present value.
- tax credits/grants reduce capex
- multi-billion funding (US/EU) in 2024
- incentive withdrawal lengthens payback
- time BEST investments to policy windows
Public–private partnerships and localization
Local content rules and PPP frameworks shape contracting and facility siting; World Bank PPI data shows $3.8 trillion invested in infrastructure in developing countries since 1990, underscoring scale and regulatory impact. Partnering with local authorities can unlock land and permits; Nigeria's oil & gas local content law targets roughly 70% local participation as a precedent. Localization mandates often require regional procurement and hiring, and BEST can leverage compliant PPPs to scale last-mile networks.
- Local content: national quotas (example: ~70% Nigeria)
- PPPs: unlock land, permits, risk-sharing
- Localization: regional procurement, hiring requirements
- BEST: use PPPs to scale last-mile compliant networks
Tariffs up to 25%, US $550bn spend reshape supply chains
Tariffs (eg US Section 301 duties up to 25% on ~360bn of Chinese imports) and trade controls raise landed costs and rerouting. Public investment—US Bipartisan Infrastructure Law ~550bn and BEAD 42.45bn—cuts transit time when aligned. Geopolitical risk (Global Peace Index 2024 worsened; Red Sea war‑risk surcharges spiked 2023–24) forces redundant lanes and agile brokerage. Local content/PPPs (World Bank PPI $3.8tn; Nigeria ~70%) affect siting and hiring.
| Factor | 2024/25 datapoint |
|---|---|
| Tariffs | ~$360bn; up to 25% |
| Infrastructure spend | US $550bn; BEAD $42.45bn |
| Local content | World Bank PPI $3.8tn; Nigeria ~70% |
What is included in the product
Detailed Word Document
Explores how external macro-environmental factors uniquely affect the Best across six dimensions—Political, Economic, Social, Technological, Environmental, and Legal—using data-backed trends and forward-looking insights for scenario planning. Designed for executives and advisors, it maps threats and opportunities with region- and industry-specific examples ready for business plans or investor materials.
Customizable Excel Spreadsheet
A compact, category-segmented PESTLE summary for quick meeting reference that’s editable with local notes and easily shareable across teams, streamlining external risk discussions and client-ready reports.
Economic factors
Macroeconomic growth and freight demand
Global GDP growth of about 3.0% in 2024 (IMF) drives shipment volumes across B2B and B2C channels, with freight demand closely tracking trade and consumption cycles. Slowdowns compress yields and force price competition as carriers and 3PLs chase volume. Cyclical sectors like autos and construction amplify volume volatility, with swings of 10%+ in peak years. BEST must balance sector exposure and maintain flexible capacity to ride cycles.
E-commerce penetration and basket mix
Global e-commerce sales rose to about $6.3 trillion in 2023 with online share in key markets near 18% in 2024, expanding parcel density and last-mile stops; parcel volumes and stop density rose ~10–15% year-over-year in many metros. Growth in heavy/oversized categories (furniture, groceries) increased freight share by ~12–15%, shifting mix toward specialized handling. Peak season volumes can spike 30–40%, driving surge costs; BEST can monetize via value-added services, premium fulfillment and dynamic pricing to capture higher margins.
Fuel and energy price volatility
Diesel and electricity costs—with Brent averaging about $85/bbl in 2024 and US retail diesel near $4.10/gal while US industrial power ran ≈$0.11/kWh—directly inflate linehaul and facility opex. Fuel surcharges offset some variability but erode customer satisfaction. Hedging, route optimization and telematics cut exposure and fuel burn. BEST should invest in energy-efficient fleet, facility retrofits and alternative fuels (biodiesel, EVs, hydrogen) to lower long-term volatility risk.
Labor market and wage inflation
Tight driver and courier markets—with industry estimates of an 80,000 U.S. driver shortfall (ATA 2023) and turnover often above 50% in last-mile delivery—push wage inflation and retention risk. Training and safety spend improves productivity and lowers claims but raises operating cost. Automation and capital-intensive robotics offset labor constraints; BEST leverages multi-modal staffing and gig partnerships where legal.
- Driver shortage: 80,000 (ATA 2023)
- Turnover: >50% in last-mile (2024 studies)
- Wage inflation: upward pressure on OPEX
- Mitigation: automation, training, gig partnerships
Exchange rates and cross-border costs
Currency swings alter imported equipment costs and foreign revenues and 2024–H1 2025 saw major pairs move roughly 5–12% year-on-year, materially shifting margins; FX volatility also forces frequent repricing of international lanes and contracts. Building natural hedges through local sourcing and local-cost structures can stabilize margins, while BEST should implement targeted FX hedging and shift billing to local currencies where feasible.
- 2024–25 FX moves: ~5–12% Y/Y impact on costs/revenues
- Natural hedges: local costs reduce net exposure
- Actions: use forward/option hedges and local billing
Tariffs up to 25%, US $550bn spend reshape supply chains
Global GDP ~3.0% (IMF 2024) drives freight volumes; e-commerce $6.3T (2023) raises parcel density; energy costs (Brent ~$85/bbl, diesel ~$4.10/gal) and driver shortfall (~80,000 US) inflate OPEX; FX moves 5–12% Y/Y shift margins—BEST must flex capacity, price dynamically, hedge energy/FX and invest in automation.
| Metric | Value |
|---|---|
| Global GDP 2024 | ~3.0% |
| E‑commerce 2023 | $6.3T |
| Brent 2024 | $85/bbl |
| US diesel | $4.10/gal |
| Driver shortfall | ~80,000 |
| FX moves 2024–25 | 5–12% Y/Y |
Same Document Delivered
Best PESTLE Analysis
The preview shown here is the exact Best PESTLE Analysis document you’ll receive after purchase—fully formatted, comprehensive, and ready to use. This screenshot reflects the real file with no placeholders or surprises; the layout, content, and structure are identical to the downloadable final version.











