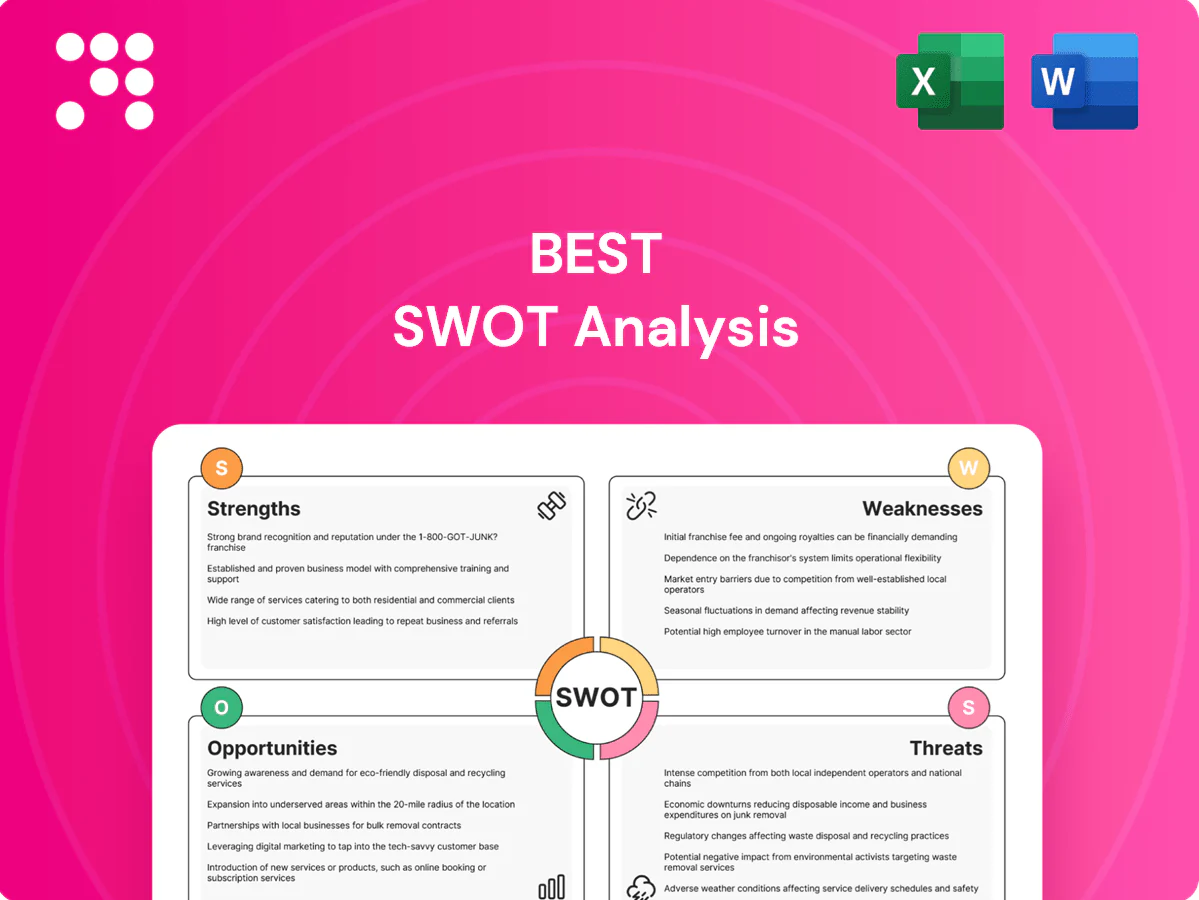
Best SWOT Analysis

Make Insightful Decisions Backed by Expert Research
Ready to move from insight to impact? Purchase the full SWOT analysis for a research-backed, investor-ready report that unveils strengths, risks, and growth levers—complete with editable Word and Excel deliverables. Use it to strategize confidently, support pitches, and make faster, smarter decisions.
Strengths

Tech-enabled network
Best leverages advanced routing, tracking, and automation to boost delivery speed and visibility, integrating order, warehouse, and transport data for real-time decisions across three domains; deployments report up to 20% fewer empty miles and on-time performance above 98%, enabling scalable, standardized service across 50+ regions.
Integrated services
Integrated services combine express, freight, supply chain management and last-mile into an end-to-end offering, reducing fragmentation and vendor count for customers. A single-provider model simplifies procurement and operations while enabling cross-selling that increases wallet share and customer stickiness. Last-mile already represents over 50% of delivery costs, so configurable, industry-specific integrated solutions drive measurable cost and service gains.

Data-driven optimization
Network and shipment data enable continuous cost and route optimization, cutting transport costs by up to 15% through reduced empty miles and better load consolidation; predictive analytics improves demand forecasting and capacity planning with forecast accuracy gains around 25% (Gartner 2024); real-time KPIs and dashboards support SLA-driven service quality, improving on-time delivery by ~10%; closed-loop data feedback drives pricing and yield management uplifts of 5–8%.

Industry diversification
Serving multiple sectors reduces reliance on any single cycle and raises relevance via vertical-specific solutions for retailers, manufacturers and e-commerce; global e-commerce GMV was about 6.3 trillion USD in 2023 and manufacturing accounts for roughly 16% of global GDP, widening market and innovation pathways while smoothing volumes and cash flows.
- Diversifies revenue streams
- Vertical-fit increases customer stickiness
- Smooths seasonality and cash flow
- Expands R&D and product opportunities
Last-mile capability
Owned and partnered last-mile networks reduce the largest cost node—last-mile can account for up to 53% of total shipping costs—by enabling route density and shared capacity in urban cores.
Dense urban networks and flexible delivery options (time-slot, lockers, same-day) lift CSAT and repeat purchase rates in e-commerce markets worth about $5.7 trillion in 2024.
Parcel-level tracking with real-time updates increases transparency and reduces inquiries; last-mile proficiency remains a decisive differentiator in high-growth e-commerce regions.
- Cost focus: last-mile ≈53% of shipping costs
- Market scale: e-commerce ≈$5.7T (2024)
- Customer value: real-time parcel tracking boosts transparency
Logistics:>98% on-time, -20% empty, ~15%
Best achieves >98% on-time delivery and up to 20% fewer empty miles via advanced routing, tracking and automation across 50+ regions.
Integrated end-to-end services cut vendor count and last-mile costs (≈53% of shipping), driving cross-sell and stickiness in a $5.7T e-commerce market (2024).
Data-driven ops yield ~15% transport savings, ~25% forecast accuracy gains and 5–8% pricing/yield uplifts (Gartner 2024).
| Metric | Value |
|---|---|
| On-time | >98% |
| Empty miles | -20% |
| Last-mile cost | ≈53% |
| E‑commerce GMV | $5.7T (2024) |
What is included in the product
 Detailed Word Document
Provides a concise SWOT overview of Best, outlining its internal strengths and weaknesses and the external opportunities and threats shaping its strategic position.

 Customizable Excel Spreadsheet
Provides a focused SWOT matrix that distills complex strategy into clear actions, reducing analysis time and resolving stakeholder misalignment for faster decision-making.
Weaknesses

Thin margins
Logistics is structurally low‑margin, with operating margins commonly in the single digits (roughly 3–8% industry range in 2024–25); price‑sensitive customers limit pricing power. Rising labor costs (labor up ~10–15% in many markets since 2020) and volatile fuel (Brent roughly $70–100/bbl through 2024) compress profitability. Service‑level needs prevent easy cuts, and margin volatility reduces reinvestment capacity.
Capital intensity
Sorting hubs, vehicles, and IT platforms require ongoing capex, with logistics leaders reporting billions annually for network and automation upgrades in 2024. Rapid tech cycles demand continual hardware and software refreshes that accelerate spend. High fixed costs raise breakeven volumes, and modest dips in asset utilization can quickly erode margins and returns.

Service variability
Complex, multi-node networks create delivery inconsistencies, with route/latency variance spiking during peak events when demand can rise 2–3x and SLA breaches increase materially. Third-party partners contribute roughly 50–60% of service incidents, elevating quality variability. Incident management adds overhead and risk, with modern data incidents averaging millions in recovery costs (IBM 2024: $4.45M per breach).

Volume dependence
Volume dependence weakens margins because economies of scale require dense, stable flows; demand shocks can cut load factors by double digits and raise unit costs sharply. Customer churn propagates network inefficiencies, and pricing power erodes without volume leverage—air and ocean carriers saw freight-rate volatility remain elevated through 2024.
- Impact: higher unit costs
- Cause: demand shocks
- Effect: churn amplifies inefficiency
- Result: weaker pricing power
Regulatory burden
Regulatory burden spans transportation, labor, data and cross-border rules, creating layered compliance requirements that raise operational complexity. Data breaches cost companies $4.45M on average in 2023 (IBM), and the EU Digital Markets Act can levy fines up to 10% of global turnover, elevating financial risk. Frequent policy changes add friction, causing delays, fines and localization that hinder standardization and extend timelines.
- Scope: transportation, labor, data, cross-border
- Cost signal: $4.45M average data breach (2023)
- Penalty risk: DMA fines up to 10% global turnover
- Operational impact: delays, localization, lost standardization
Margins 3–8%, labor +10–15%, Brent $70–100/bbl and 50–60% partner incidents squeeze profits
Low structural margins (3–8% industry range 2024–25) and price-sensitive customers limit pricing power. Labor up ~10–15% since 2020 and fuel volatility (Brent $70–100/bbl through 2024) compress profits. High fixed capex (billions annually in 2024), network complexity and 50–60% partner-caused incidents raise unit costs and service volatility.
| Metric | Value | Year/Source |
|---|---|---|
| Operating margin | 3–8% | 2024–25 industry |
| Labor change | +10–15% | Since 2020 |
| Brent | $70–100/bbl | 2024 |
| Data breach cost | $4.45M | IBM 2023 |
| Partner incidents | 50–60% | 2024 |
Full Version Awaits
Best SWOT Analysis
This is the actual Best SWOT Analysis document you’ll receive upon purchase—no surprises, just professional quality and a clear, structured layout. The preview below is taken directly from the full report; buying unlocks the complete, editable version. Purchase to download the entire in-depth analysis immediately.

Make Insightful Decisions Backed by Expert Research
Ready to move from insight to impact? Purchase the full SWOT analysis for a research-backed, investor-ready report that unveils strengths, risks, and growth levers—complete with editable Word and Excel deliverables. Use it to strategize confidently, support pitches, and make faster, smarter decisions.
Strengths
Tech-enabled network
Best leverages advanced routing, tracking, and automation to boost delivery speed and visibility, integrating order, warehouse, and transport data for real-time decisions across three domains; deployments report up to 20% fewer empty miles and on-time performance above 98%, enabling scalable, standardized service across 50+ regions.
Integrated services
Integrated services combine express, freight, supply chain management and last-mile into an end-to-end offering, reducing fragmentation and vendor count for customers. A single-provider model simplifies procurement and operations while enabling cross-selling that increases wallet share and customer stickiness. Last-mile already represents over 50% of delivery costs, so configurable, industry-specific integrated solutions drive measurable cost and service gains.
Data-driven optimization
Network and shipment data enable continuous cost and route optimization, cutting transport costs by up to 15% through reduced empty miles and better load consolidation; predictive analytics improves demand forecasting and capacity planning with forecast accuracy gains around 25% (Gartner 2024); real-time KPIs and dashboards support SLA-driven service quality, improving on-time delivery by ~10%; closed-loop data feedback drives pricing and yield management uplifts of 5–8%.
Industry diversification
Serving multiple sectors reduces reliance on any single cycle and raises relevance via vertical-specific solutions for retailers, manufacturers and e-commerce; global e-commerce GMV was about 6.3 trillion USD in 2023 and manufacturing accounts for roughly 16% of global GDP, widening market and innovation pathways while smoothing volumes and cash flows.
- Diversifies revenue streams
- Vertical-fit increases customer stickiness
- Smooths seasonality and cash flow
- Expands R&D and product opportunities
Last-mile capability
Owned and partnered last-mile networks reduce the largest cost node—last-mile can account for up to 53% of total shipping costs—by enabling route density and shared capacity in urban cores.
Dense urban networks and flexible delivery options (time-slot, lockers, same-day) lift CSAT and repeat purchase rates in e-commerce markets worth about $5.7 trillion in 2024.
Parcel-level tracking with real-time updates increases transparency and reduces inquiries; last-mile proficiency remains a decisive differentiator in high-growth e-commerce regions.
- Cost focus: last-mile ≈53% of shipping costs
- Market scale: e-commerce ≈$5.7T (2024)
- Customer value: real-time parcel tracking boosts transparency
Logistics:>98% on-time, -20% empty, ~15%
Best achieves >98% on-time delivery and up to 20% fewer empty miles via advanced routing, tracking and automation across 50+ regions.
Integrated end-to-end services cut vendor count and last-mile costs (≈53% of shipping), driving cross-sell and stickiness in a $5.7T e-commerce market (2024).
Data-driven ops yield ~15% transport savings, ~25% forecast accuracy gains and 5–8% pricing/yield uplifts (Gartner 2024).
| Metric | Value |
|---|---|
| On-time | >98% |
| Empty miles | -20% |
| Last-mile cost | ≈53% |
| E‑commerce GMV | $5.7T (2024) |
What is included in the product
Detailed Word Document
Provides a concise SWOT overview of Best, outlining its internal strengths and weaknesses and the external opportunities and threats shaping its strategic position.
Customizable Excel Spreadsheet
Provides a focused SWOT matrix that distills complex strategy into clear actions, reducing analysis time and resolving stakeholder misalignment for faster decision-making.
Weaknesses
Thin margins
Logistics is structurally low‑margin, with operating margins commonly in the single digits (roughly 3–8% industry range in 2024–25); price‑sensitive customers limit pricing power. Rising labor costs (labor up ~10–15% in many markets since 2020) and volatile fuel (Brent roughly $70–100/bbl through 2024) compress profitability. Service‑level needs prevent easy cuts, and margin volatility reduces reinvestment capacity.
Capital intensity
Sorting hubs, vehicles, and IT platforms require ongoing capex, with logistics leaders reporting billions annually for network and automation upgrades in 2024. Rapid tech cycles demand continual hardware and software refreshes that accelerate spend. High fixed costs raise breakeven volumes, and modest dips in asset utilization can quickly erode margins and returns.
Service variability
Complex, multi-node networks create delivery inconsistencies, with route/latency variance spiking during peak events when demand can rise 2–3x and SLA breaches increase materially. Third-party partners contribute roughly 50–60% of service incidents, elevating quality variability. Incident management adds overhead and risk, with modern data incidents averaging millions in recovery costs (IBM 2024: $4.45M per breach).
Volume dependence
Volume dependence weakens margins because economies of scale require dense, stable flows; demand shocks can cut load factors by double digits and raise unit costs sharply. Customer churn propagates network inefficiencies, and pricing power erodes without volume leverage—air and ocean carriers saw freight-rate volatility remain elevated through 2024.
- Impact: higher unit costs
- Cause: demand shocks
- Effect: churn amplifies inefficiency
- Result: weaker pricing power
Regulatory burden
Regulatory burden spans transportation, labor, data and cross-border rules, creating layered compliance requirements that raise operational complexity. Data breaches cost companies $4.45M on average in 2023 (IBM), and the EU Digital Markets Act can levy fines up to 10% of global turnover, elevating financial risk. Frequent policy changes add friction, causing delays, fines and localization that hinder standardization and extend timelines.
- Scope: transportation, labor, data, cross-border
- Cost signal: $4.45M average data breach (2023)
- Penalty risk: DMA fines up to 10% global turnover
- Operational impact: delays, localization, lost standardization
Margins 3–8%, labor +10–15%, Brent $70–100/bbl and 50–60% partner incidents squeeze profits
Low structural margins (3–8% industry range 2024–25) and price-sensitive customers limit pricing power. Labor up ~10–15% since 2020 and fuel volatility (Brent $70–100/bbl through 2024) compress profits. High fixed capex (billions annually in 2024), network complexity and 50–60% partner-caused incidents raise unit costs and service volatility.
| Metric | Value | Year/Source |
|---|---|---|
| Operating margin | 3–8% | 2024–25 industry |
| Labor change | +10–15% | Since 2020 |
| Brent | $70–100/bbl | 2024 |
| Data breach cost | $4.45M | IBM 2023 |
| Partner incidents | 50–60% | 2024 |
Full Version Awaits
Best SWOT Analysis
This is the actual Best SWOT Analysis document you’ll receive upon purchase—no surprises, just professional quality and a clear, structured layout. The preview below is taken directly from the full report; buying unlocks the complete, editable version. Purchase to download the entire in-depth analysis immediately.
Description
Make Insightful Decisions Backed by Expert Research
Ready to move from insight to impact? Purchase the full SWOT analysis for a research-backed, investor-ready report that unveils strengths, risks, and growth levers—complete with editable Word and Excel deliverables. Use it to strategize confidently, support pitches, and make faster, smarter decisions.
Strengths
Tech-enabled network
Best leverages advanced routing, tracking, and automation to boost delivery speed and visibility, integrating order, warehouse, and transport data for real-time decisions across three domains; deployments report up to 20% fewer empty miles and on-time performance above 98%, enabling scalable, standardized service across 50+ regions.
Integrated services
Integrated services combine express, freight, supply chain management and last-mile into an end-to-end offering, reducing fragmentation and vendor count for customers. A single-provider model simplifies procurement and operations while enabling cross-selling that increases wallet share and customer stickiness. Last-mile already represents over 50% of delivery costs, so configurable, industry-specific integrated solutions drive measurable cost and service gains.
Data-driven optimization
Network and shipment data enable continuous cost and route optimization, cutting transport costs by up to 15% through reduced empty miles and better load consolidation; predictive analytics improves demand forecasting and capacity planning with forecast accuracy gains around 25% (Gartner 2024); real-time KPIs and dashboards support SLA-driven service quality, improving on-time delivery by ~10%; closed-loop data feedback drives pricing and yield management uplifts of 5–8%.
Industry diversification
Serving multiple sectors reduces reliance on any single cycle and raises relevance via vertical-specific solutions for retailers, manufacturers and e-commerce; global e-commerce GMV was about 6.3 trillion USD in 2023 and manufacturing accounts for roughly 16% of global GDP, widening market and innovation pathways while smoothing volumes and cash flows.
- Diversifies revenue streams
- Vertical-fit increases customer stickiness
- Smooths seasonality and cash flow
- Expands R&D and product opportunities
Last-mile capability
Owned and partnered last-mile networks reduce the largest cost node—last-mile can account for up to 53% of total shipping costs—by enabling route density and shared capacity in urban cores.
Dense urban networks and flexible delivery options (time-slot, lockers, same-day) lift CSAT and repeat purchase rates in e-commerce markets worth about $5.7 trillion in 2024.
Parcel-level tracking with real-time updates increases transparency and reduces inquiries; last-mile proficiency remains a decisive differentiator in high-growth e-commerce regions.
- Cost focus: last-mile ≈53% of shipping costs
- Market scale: e-commerce ≈$5.7T (2024)
- Customer value: real-time parcel tracking boosts transparency
Logistics:>98% on-time, -20% empty, ~15%
Best achieves >98% on-time delivery and up to 20% fewer empty miles via advanced routing, tracking and automation across 50+ regions.
Integrated end-to-end services cut vendor count and last-mile costs (≈53% of shipping), driving cross-sell and stickiness in a $5.7T e-commerce market (2024).
Data-driven ops yield ~15% transport savings, ~25% forecast accuracy gains and 5–8% pricing/yield uplifts (Gartner 2024).
| Metric | Value |
|---|---|
| On-time | >98% |
| Empty miles | -20% |
| Last-mile cost | ≈53% |
| E‑commerce GMV | $5.7T (2024) |
What is included in the product
Detailed Word Document
Provides a concise SWOT overview of Best, outlining its internal strengths and weaknesses and the external opportunities and threats shaping its strategic position.
Customizable Excel Spreadsheet
Provides a focused SWOT matrix that distills complex strategy into clear actions, reducing analysis time and resolving stakeholder misalignment for faster decision-making.
Weaknesses
Thin margins
Logistics is structurally low‑margin, with operating margins commonly in the single digits (roughly 3–8% industry range in 2024–25); price‑sensitive customers limit pricing power. Rising labor costs (labor up ~10–15% in many markets since 2020) and volatile fuel (Brent roughly $70–100/bbl through 2024) compress profitability. Service‑level needs prevent easy cuts, and margin volatility reduces reinvestment capacity.
Capital intensity
Sorting hubs, vehicles, and IT platforms require ongoing capex, with logistics leaders reporting billions annually for network and automation upgrades in 2024. Rapid tech cycles demand continual hardware and software refreshes that accelerate spend. High fixed costs raise breakeven volumes, and modest dips in asset utilization can quickly erode margins and returns.
Service variability
Complex, multi-node networks create delivery inconsistencies, with route/latency variance spiking during peak events when demand can rise 2–3x and SLA breaches increase materially. Third-party partners contribute roughly 50–60% of service incidents, elevating quality variability. Incident management adds overhead and risk, with modern data incidents averaging millions in recovery costs (IBM 2024: $4.45M per breach).
Volume dependence
Volume dependence weakens margins because economies of scale require dense, stable flows; demand shocks can cut load factors by double digits and raise unit costs sharply. Customer churn propagates network inefficiencies, and pricing power erodes without volume leverage—air and ocean carriers saw freight-rate volatility remain elevated through 2024.
- Impact: higher unit costs
- Cause: demand shocks
- Effect: churn amplifies inefficiency
- Result: weaker pricing power
Regulatory burden
Regulatory burden spans transportation, labor, data and cross-border rules, creating layered compliance requirements that raise operational complexity. Data breaches cost companies $4.45M on average in 2023 (IBM), and the EU Digital Markets Act can levy fines up to 10% of global turnover, elevating financial risk. Frequent policy changes add friction, causing delays, fines and localization that hinder standardization and extend timelines.
- Scope: transportation, labor, data, cross-border
- Cost signal: $4.45M average data breach (2023)
- Penalty risk: DMA fines up to 10% global turnover
- Operational impact: delays, localization, lost standardization
Margins 3–8%, labor +10–15%, Brent $70–100/bbl and 50–60% partner incidents squeeze profits
Low structural margins (3–8% industry range 2024–25) and price-sensitive customers limit pricing power. Labor up ~10–15% since 2020 and fuel volatility (Brent $70–100/bbl through 2024) compress profits. High fixed capex (billions annually in 2024), network complexity and 50–60% partner-caused incidents raise unit costs and service volatility.
| Metric | Value | Year/Source |
|---|---|---|
| Operating margin | 3–8% | 2024–25 industry |
| Labor change | +10–15% | Since 2020 |
| Brent | $70–100/bbl | 2024 |
| Data breach cost | $4.45M | IBM 2023 |
| Partner incidents | 50–60% | 2024 |
Full Version Awaits
Best SWOT Analysis
This is the actual Best SWOT Analysis document you’ll receive upon purchase—no surprises, just professional quality and a clear, structured layout. The preview below is taken directly from the full report; buying unlocks the complete, editable version. Purchase to download the entire in-depth analysis immediately.











