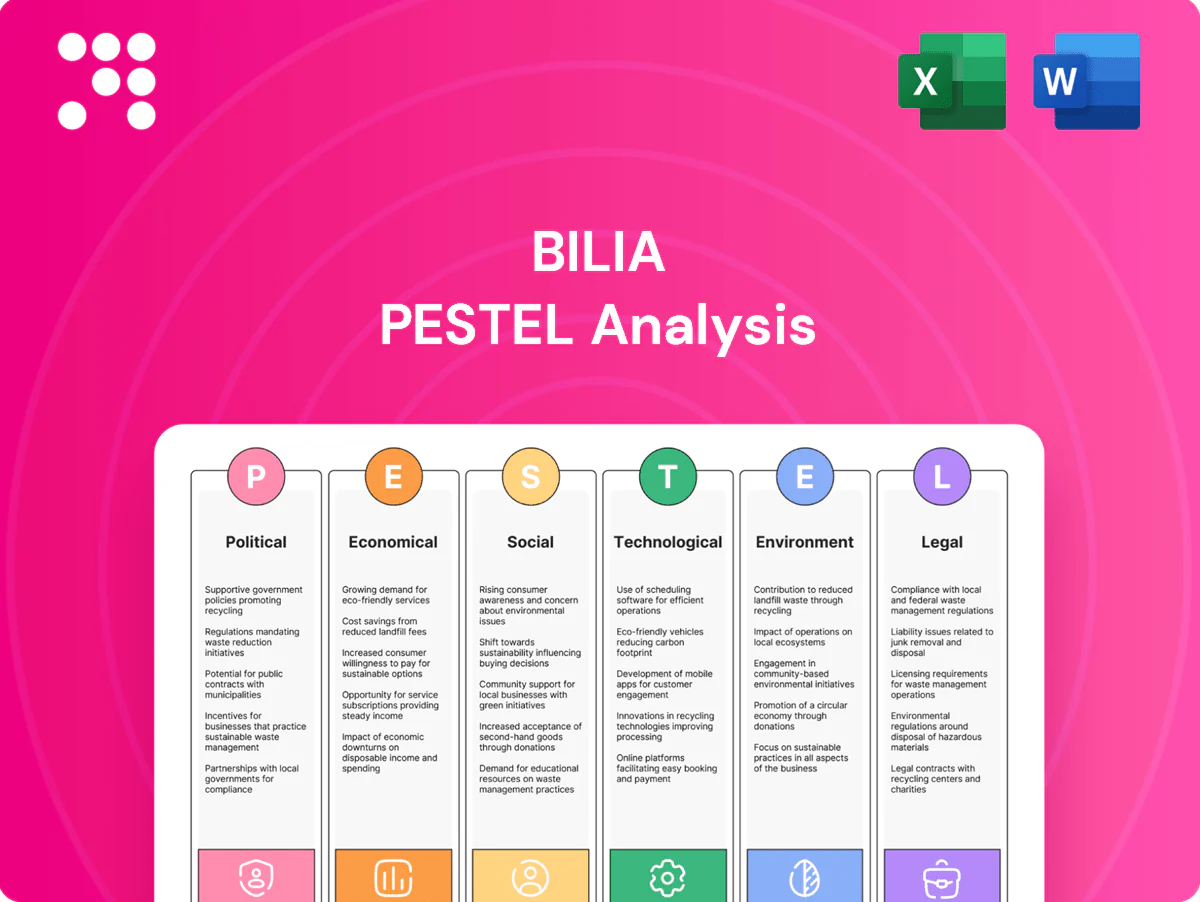
Bilia PESTLE Analysis

Make Smarter Strategic Decisions with a Complete PESTEL View
Gain strategic clarity on Bilia with our PESTLE Analysis—concise evaluation of political, economic, social, technological, legal and environmental forces shaping its outlook. Ideal for investors and strategists, this ready-to-use report highlights risks and opportunities. Purchase the full analysis to access actionable, downloadable insights now.
Political factors

EU automotive industrial policy
EU emphasis on strategic autonomy and a 2035 zero‑emission target is forcing OEMs to revise sourcing and dealer terms, altering margins and allocation rules for retailers like Bilia. Industrial tools such as the 2023 Critical Raw Materials Act and the EU Battery Regulation, plus subsidies for local EV supply chains, are reshaping brand lineups and production footprints. With BEV share near 20% of EU new‑car sales in 2024, localization rules can lengthen lead times and shift pricing, so Bilia must track how incentives cascade into allocation and retail margins.
EV incentives and taxation
National subsidies, VAT exemptions and registration taxes differ across Europe—Norway saw battery EVs at about 86% of new-car sales in 2023 while EU BEV share averaged ~17% in 2024, driving stark country-level demand gaps. Reduced support in some EU states has already increased cross-border and used-car flows, shifting mix between ICE and EV inventory. Bilia must maintain agile pricing, dynamic sourcing and inventory planning tied to real-time policy changes and tax signals.

Trade and tariff dynamics
EU external tariff for passenger cars is 10% and temporary safeguard duties on some Chinese EVs were introduced in 2024, shifting competitive price points and dealer margins. Currency-sensitive import costs (FX volatility) compound tariff impacts across brands and models. Sudden political escalations risk supply interruptions or forced model repricing. Bilia should diversify brand exposure and strengthen FX and procurement hedging tactics.

Local government transport policies
Local government transport policies—over 270 low-emission zones across Europe by 2024 and congestion-charge areas like Stockholm (traffic down ~20% after introduction)—shift consumer preferences toward EVs and hybrids; Sweden saw battery-electric vehicles reach about 40% of new car sales in 2024, boosting demand for chargers, batteries and servicing.
- LEZs: 270+ (Europe, 2024)
- Congestion impact: Stockholm ~20% traffic drop
- Sweden BEV new sales ≈40% (2024)
- Risk: fragmented rules complicate marketing/inventory
- Opportunity: tailor municipal offers to capture local demand
Nordic-EU regulatory interplay
- 30-jurisdictions: EU27+EEA3
- Variable registration/licensing regimes increase cycle times
- Harmonization helps but national exceptions remain
- Standardized compliance lowers political friction costs
EU 2035 zero‑emission push, tariffs and 270+ LEZs reshape BEV sourcing and dealer margins
EU 2035 zero‑emission push and CRMA/Battery Regulation reshape OEM sourcing and dealer margins; EU BEV ~20% of new sales (2024), Sweden ~40% (2024), Norway ~86% (2023). Tariffs/safeguards (EU car tariff 10%, 2024 China EV duties) plus FX volatility raise import costs. 270+ LEZs (2024) and 30 jurisdictions increase compliance and inventory complexity.
| Metric | Value | Implication |
|---|---|---|
| EU BEV share | ~20% (2024) | Allocation shifts |
| Sweden | ~40% (2024) | Stronger EV demand |
| Norway | ~86% (2023) | Market extremes |
| EU tariff | 10% | Higher import cost |
| LEZs | 270+ (2024) | Local demand variance |
| Jurisdictions | 30 | Compliance complexity |
What is included in the product
 Detailed Word Document
Explores how macro-environmental forces uniquely affect Bilia across Political, Economic, Social, Technological, Environmental and Legal dimensions, with data-driven trends and forward-looking insights to support scenario planning; designed for executives, consultants and investors to identify risks, opportunities and strategic actions, ready for direct use in reports and decks.

 Customizable Excel Spreadsheet
Condensed, visually segmented PESTLE summary of Bilia for quick reference in meetings or presentations, easily editable for your region or business line and ideal for sharing across teams to streamline risk discussions and strategic planning.
Economic factors

Interest rates and auto financing
Financing costs directly shape affordability and conversions for new and used vehicles; with the ECB deposit rate at 4.00% (July 2025) and 12‑month EURIBOR near 3.5%, monthly payments have eased from 2023 peaks. Rate sensitivity is acute for premium models and long‑tenor loans (48–84 months), which drive higher elasticity. Bilia can leverage captive‑like financing partnerships to stabilize margins and protect volumes.
Used car price normalization
Post-pandemic supply shocks pushed used car prices up ~25-30% by 2021–22, but Cox Automotive data show values fell about 25% from peak by mid-2024, nearing pre-2020 norms; this normalization compresses margins. Residual value shifts have trimmed lease returns by roughly 3–7 percentage points and lowered remarketing profitability. Some EVs face faster depreciation—20–40% first-year declines for select models—complicating pricing. Robust appraisal and dynamic pricing tools are essential for Bilia to protect used-inventory turn.

Consumer confidence and real incomes
Macro sentiment and real incomes shape showroom traffic: Swedish consumer confidence hovered around -15 in 2024 while CPI eased to about 3% in 2024, and electricity prices fell roughly 40% versus 2022, boosting discretionary capacity. Energy and wage trends drive service deferrals and longer ownership cycles even as improving inflation can unlock pent-up replacement demand. Cost-of-living pressures sustain down-trading; Bilia’s value packages and certified-used programs can capture budget-conscious buyers.

FX exposure in Nordic and EU markets
- Translation risk: multi-currency reporting
- Transaction risk: OEM invoice vs local sale mismatch
- Hedging: policy + natural offsets essential
- Pricing/inventory: align clauses and financing to FX
Supply chain stability and inventory
Semiconductor lead times have fallen roughly 30% from 2021‑22 peaks and container rates are down about 60%, improving new car availability and fill rates but squeezing per‑unit margins; higher funding costs (central bank rates ~4% in 2024) keep inventory carry costs meaningful. Bilia therefore needs strict days‑in‑stock targets and SKU mix optimisation to protect margins.
- Improved fill rates ↑ vs 2022
- Per‑unit margin pressure ↓
- Inventory carry cost ≈ funding rate ~4%
- Action: days‑in‑stock + mix optimisation
EU 2035 zero‑emission push, tariffs and 270+ LEZs reshape BEV sourcing and dealer margins
Higher financing costs (ECB deposit 4.00% July 2025; 12m EURIBOR ~3.5%) pressure affordability, especially for premium long‑tenor loans. Used values fell ~25% from peak by mid‑2024, compressing remarketing margins; select EVs show 20–40% first‑year depreciation. Consumer confidence weak (-15 in 2024) but CPI ~3% and lower energy boost replacement demand; FX (EUR/SEK 11.3; NOK/SEK 0.92) adds margin risk.
| Metric | Value |
|---|---|
| ECB deposit | 4.00% (Jul 2025) |
| Used car value change | -25% from peak (mid‑2024) |
| EV 1st‑yr dep | 20–40% |
| EUR/SEK | 11.3 (Jul 2025) |
Preview the Actual Deliverable
Bilia PESTLE Analysis
The preview shown here is the exact Bilia PESTLE document you’ll receive after purchase—fully formatted and ready to use. It contains the same analysis, structure and visuals displayed here with no placeholders or edits required. After payment you’ll instantly download this final, professionally structured file and can apply the insights immediately.

Make Smarter Strategic Decisions with a Complete PESTEL View
Gain strategic clarity on Bilia with our PESTLE Analysis—concise evaluation of political, economic, social, technological, legal and environmental forces shaping its outlook. Ideal for investors and strategists, this ready-to-use report highlights risks and opportunities. Purchase the full analysis to access actionable, downloadable insights now.
Political factors
EU automotive industrial policy
EU emphasis on strategic autonomy and a 2035 zero‑emission target is forcing OEMs to revise sourcing and dealer terms, altering margins and allocation rules for retailers like Bilia. Industrial tools such as the 2023 Critical Raw Materials Act and the EU Battery Regulation, plus subsidies for local EV supply chains, are reshaping brand lineups and production footprints. With BEV share near 20% of EU new‑car sales in 2024, localization rules can lengthen lead times and shift pricing, so Bilia must track how incentives cascade into allocation and retail margins.
EV incentives and taxation
National subsidies, VAT exemptions and registration taxes differ across Europe—Norway saw battery EVs at about 86% of new-car sales in 2023 while EU BEV share averaged ~17% in 2024, driving stark country-level demand gaps. Reduced support in some EU states has already increased cross-border and used-car flows, shifting mix between ICE and EV inventory. Bilia must maintain agile pricing, dynamic sourcing and inventory planning tied to real-time policy changes and tax signals.
Trade and tariff dynamics
EU external tariff for passenger cars is 10% and temporary safeguard duties on some Chinese EVs were introduced in 2024, shifting competitive price points and dealer margins. Currency-sensitive import costs (FX volatility) compound tariff impacts across brands and models. Sudden political escalations risk supply interruptions or forced model repricing. Bilia should diversify brand exposure and strengthen FX and procurement hedging tactics.
Local government transport policies
Local government transport policies—over 270 low-emission zones across Europe by 2024 and congestion-charge areas like Stockholm (traffic down ~20% after introduction)—shift consumer preferences toward EVs and hybrids; Sweden saw battery-electric vehicles reach about 40% of new car sales in 2024, boosting demand for chargers, batteries and servicing.
- LEZs: 270+ (Europe, 2024)
- Congestion impact: Stockholm ~20% traffic drop
- Sweden BEV new sales ≈40% (2024)
- Risk: fragmented rules complicate marketing/inventory
- Opportunity: tailor municipal offers to capture local demand
Nordic-EU regulatory interplay
- 30-jurisdictions: EU27+EEA3
- Variable registration/licensing regimes increase cycle times
- Harmonization helps but national exceptions remain
- Standardized compliance lowers political friction costs
EU 2035 zero‑emission push, tariffs and 270+ LEZs reshape BEV sourcing and dealer margins
EU 2035 zero‑emission push and CRMA/Battery Regulation reshape OEM sourcing and dealer margins; EU BEV ~20% of new sales (2024), Sweden ~40% (2024), Norway ~86% (2023). Tariffs/safeguards (EU car tariff 10%, 2024 China EV duties) plus FX volatility raise import costs. 270+ LEZs (2024) and 30 jurisdictions increase compliance and inventory complexity.
| Metric | Value | Implication |
|---|---|---|
| EU BEV share | ~20% (2024) | Allocation shifts |
| Sweden | ~40% (2024) | Stronger EV demand |
| Norway | ~86% (2023) | Market extremes |
| EU tariff | 10% | Higher import cost |
| LEZs | 270+ (2024) | Local demand variance |
| Jurisdictions | 30 | Compliance complexity |
What is included in the product
Detailed Word Document
Explores how macro-environmental forces uniquely affect Bilia across Political, Economic, Social, Technological, Environmental and Legal dimensions, with data-driven trends and forward-looking insights to support scenario planning; designed for executives, consultants and investors to identify risks, opportunities and strategic actions, ready for direct use in reports and decks.
Customizable Excel Spreadsheet
Condensed, visually segmented PESTLE summary of Bilia for quick reference in meetings or presentations, easily editable for your region or business line and ideal for sharing across teams to streamline risk discussions and strategic planning.
Economic factors
Interest rates and auto financing
Financing costs directly shape affordability and conversions for new and used vehicles; with the ECB deposit rate at 4.00% (July 2025) and 12‑month EURIBOR near 3.5%, monthly payments have eased from 2023 peaks. Rate sensitivity is acute for premium models and long‑tenor loans (48–84 months), which drive higher elasticity. Bilia can leverage captive‑like financing partnerships to stabilize margins and protect volumes.
Used car price normalization
Post-pandemic supply shocks pushed used car prices up ~25-30% by 2021–22, but Cox Automotive data show values fell about 25% from peak by mid-2024, nearing pre-2020 norms; this normalization compresses margins. Residual value shifts have trimmed lease returns by roughly 3–7 percentage points and lowered remarketing profitability. Some EVs face faster depreciation—20–40% first-year declines for select models—complicating pricing. Robust appraisal and dynamic pricing tools are essential for Bilia to protect used-inventory turn.
Consumer confidence and real incomes
Macro sentiment and real incomes shape showroom traffic: Swedish consumer confidence hovered around -15 in 2024 while CPI eased to about 3% in 2024, and electricity prices fell roughly 40% versus 2022, boosting discretionary capacity. Energy and wage trends drive service deferrals and longer ownership cycles even as improving inflation can unlock pent-up replacement demand. Cost-of-living pressures sustain down-trading; Bilia’s value packages and certified-used programs can capture budget-conscious buyers.
FX exposure in Nordic and EU markets
- Translation risk: multi-currency reporting
- Transaction risk: OEM invoice vs local sale mismatch
- Hedging: policy + natural offsets essential
- Pricing/inventory: align clauses and financing to FX
Supply chain stability and inventory
Semiconductor lead times have fallen roughly 30% from 2021‑22 peaks and container rates are down about 60%, improving new car availability and fill rates but squeezing per‑unit margins; higher funding costs (central bank rates ~4% in 2024) keep inventory carry costs meaningful. Bilia therefore needs strict days‑in‑stock targets and SKU mix optimisation to protect margins.
- Improved fill rates ↑ vs 2022
- Per‑unit margin pressure ↓
- Inventory carry cost ≈ funding rate ~4%
- Action: days‑in‑stock + mix optimisation
EU 2035 zero‑emission push, tariffs and 270+ LEZs reshape BEV sourcing and dealer margins
Higher financing costs (ECB deposit 4.00% July 2025; 12m EURIBOR ~3.5%) pressure affordability, especially for premium long‑tenor loans. Used values fell ~25% from peak by mid‑2024, compressing remarketing margins; select EVs show 20–40% first‑year depreciation. Consumer confidence weak (-15 in 2024) but CPI ~3% and lower energy boost replacement demand; FX (EUR/SEK 11.3; NOK/SEK 0.92) adds margin risk.
| Metric | Value |
|---|---|
| ECB deposit | 4.00% (Jul 2025) |
| Used car value change | -25% from peak (mid‑2024) |
| EV 1st‑yr dep | 20–40% |
| EUR/SEK | 11.3 (Jul 2025) |
Preview the Actual Deliverable
Bilia PESTLE Analysis
The preview shown here is the exact Bilia PESTLE document you’ll receive after purchase—fully formatted and ready to use. It contains the same analysis, structure and visuals displayed here with no placeholders or edits required. After payment you’ll instantly download this final, professionally structured file and can apply the insights immediately.
Original: $10.00
-65%$10.00
$3.50Description
Make Smarter Strategic Decisions with a Complete PESTEL View
Gain strategic clarity on Bilia with our PESTLE Analysis—concise evaluation of political, economic, social, technological, legal and environmental forces shaping its outlook. Ideal for investors and strategists, this ready-to-use report highlights risks and opportunities. Purchase the full analysis to access actionable, downloadable insights now.
Political factors
EU automotive industrial policy
EU emphasis on strategic autonomy and a 2035 zero‑emission target is forcing OEMs to revise sourcing and dealer terms, altering margins and allocation rules for retailers like Bilia. Industrial tools such as the 2023 Critical Raw Materials Act and the EU Battery Regulation, plus subsidies for local EV supply chains, are reshaping brand lineups and production footprints. With BEV share near 20% of EU new‑car sales in 2024, localization rules can lengthen lead times and shift pricing, so Bilia must track how incentives cascade into allocation and retail margins.
EV incentives and taxation
National subsidies, VAT exemptions and registration taxes differ across Europe—Norway saw battery EVs at about 86% of new-car sales in 2023 while EU BEV share averaged ~17% in 2024, driving stark country-level demand gaps. Reduced support in some EU states has already increased cross-border and used-car flows, shifting mix between ICE and EV inventory. Bilia must maintain agile pricing, dynamic sourcing and inventory planning tied to real-time policy changes and tax signals.
Trade and tariff dynamics
EU external tariff for passenger cars is 10% and temporary safeguard duties on some Chinese EVs were introduced in 2024, shifting competitive price points and dealer margins. Currency-sensitive import costs (FX volatility) compound tariff impacts across brands and models. Sudden political escalations risk supply interruptions or forced model repricing. Bilia should diversify brand exposure and strengthen FX and procurement hedging tactics.
Local government transport policies
Local government transport policies—over 270 low-emission zones across Europe by 2024 and congestion-charge areas like Stockholm (traffic down ~20% after introduction)—shift consumer preferences toward EVs and hybrids; Sweden saw battery-electric vehicles reach about 40% of new car sales in 2024, boosting demand for chargers, batteries and servicing.
- LEZs: 270+ (Europe, 2024)
- Congestion impact: Stockholm ~20% traffic drop
- Sweden BEV new sales ≈40% (2024)
- Risk: fragmented rules complicate marketing/inventory
- Opportunity: tailor municipal offers to capture local demand
Nordic-EU regulatory interplay
- 30-jurisdictions: EU27+EEA3
- Variable registration/licensing regimes increase cycle times
- Harmonization helps but national exceptions remain
- Standardized compliance lowers political friction costs
EU 2035 zero‑emission push, tariffs and 270+ LEZs reshape BEV sourcing and dealer margins
EU 2035 zero‑emission push and CRMA/Battery Regulation reshape OEM sourcing and dealer margins; EU BEV ~20% of new sales (2024), Sweden ~40% (2024), Norway ~86% (2023). Tariffs/safeguards (EU car tariff 10%, 2024 China EV duties) plus FX volatility raise import costs. 270+ LEZs (2024) and 30 jurisdictions increase compliance and inventory complexity.
| Metric | Value | Implication |
|---|---|---|
| EU BEV share | ~20% (2024) | Allocation shifts |
| Sweden | ~40% (2024) | Stronger EV demand |
| Norway | ~86% (2023) | Market extremes |
| EU tariff | 10% | Higher import cost |
| LEZs | 270+ (2024) | Local demand variance |
| Jurisdictions | 30 | Compliance complexity |
What is included in the product
Detailed Word Document
Explores how macro-environmental forces uniquely affect Bilia across Political, Economic, Social, Technological, Environmental and Legal dimensions, with data-driven trends and forward-looking insights to support scenario planning; designed for executives, consultants and investors to identify risks, opportunities and strategic actions, ready for direct use in reports and decks.
Customizable Excel Spreadsheet
Condensed, visually segmented PESTLE summary of Bilia for quick reference in meetings or presentations, easily editable for your region or business line and ideal for sharing across teams to streamline risk discussions and strategic planning.
Economic factors
Interest rates and auto financing
Financing costs directly shape affordability and conversions for new and used vehicles; with the ECB deposit rate at 4.00% (July 2025) and 12‑month EURIBOR near 3.5%, monthly payments have eased from 2023 peaks. Rate sensitivity is acute for premium models and long‑tenor loans (48–84 months), which drive higher elasticity. Bilia can leverage captive‑like financing partnerships to stabilize margins and protect volumes.
Used car price normalization
Post-pandemic supply shocks pushed used car prices up ~25-30% by 2021–22, but Cox Automotive data show values fell about 25% from peak by mid-2024, nearing pre-2020 norms; this normalization compresses margins. Residual value shifts have trimmed lease returns by roughly 3–7 percentage points and lowered remarketing profitability. Some EVs face faster depreciation—20–40% first-year declines for select models—complicating pricing. Robust appraisal and dynamic pricing tools are essential for Bilia to protect used-inventory turn.
Consumer confidence and real incomes
Macro sentiment and real incomes shape showroom traffic: Swedish consumer confidence hovered around -15 in 2024 while CPI eased to about 3% in 2024, and electricity prices fell roughly 40% versus 2022, boosting discretionary capacity. Energy and wage trends drive service deferrals and longer ownership cycles even as improving inflation can unlock pent-up replacement demand. Cost-of-living pressures sustain down-trading; Bilia’s value packages and certified-used programs can capture budget-conscious buyers.
FX exposure in Nordic and EU markets
- Translation risk: multi-currency reporting
- Transaction risk: OEM invoice vs local sale mismatch
- Hedging: policy + natural offsets essential
- Pricing/inventory: align clauses and financing to FX
Supply chain stability and inventory
Semiconductor lead times have fallen roughly 30% from 2021‑22 peaks and container rates are down about 60%, improving new car availability and fill rates but squeezing per‑unit margins; higher funding costs (central bank rates ~4% in 2024) keep inventory carry costs meaningful. Bilia therefore needs strict days‑in‑stock targets and SKU mix optimisation to protect margins.
- Improved fill rates ↑ vs 2022
- Per‑unit margin pressure ↓
- Inventory carry cost ≈ funding rate ~4%
- Action: days‑in‑stock + mix optimisation
EU 2035 zero‑emission push, tariffs and 270+ LEZs reshape BEV sourcing and dealer margins
Higher financing costs (ECB deposit 4.00% July 2025; 12m EURIBOR ~3.5%) pressure affordability, especially for premium long‑tenor loans. Used values fell ~25% from peak by mid‑2024, compressing remarketing margins; select EVs show 20–40% first‑year depreciation. Consumer confidence weak (-15 in 2024) but CPI ~3% and lower energy boost replacement demand; FX (EUR/SEK 11.3; NOK/SEK 0.92) adds margin risk.
| Metric | Value |
|---|---|
| ECB deposit | 4.00% (Jul 2025) |
| Used car value change | -25% from peak (mid‑2024) |
| EV 1st‑yr dep | 20–40% |
| EUR/SEK | 11.3 (Jul 2025) |
Preview the Actual Deliverable
Bilia PESTLE Analysis
The preview shown here is the exact Bilia PESTLE document you’ll receive after purchase—fully formatted and ready to use. It contains the same analysis, structure and visuals displayed here with no placeholders or edits required. After payment you’ll instantly download this final, professionally structured file and can apply the insights immediately.











