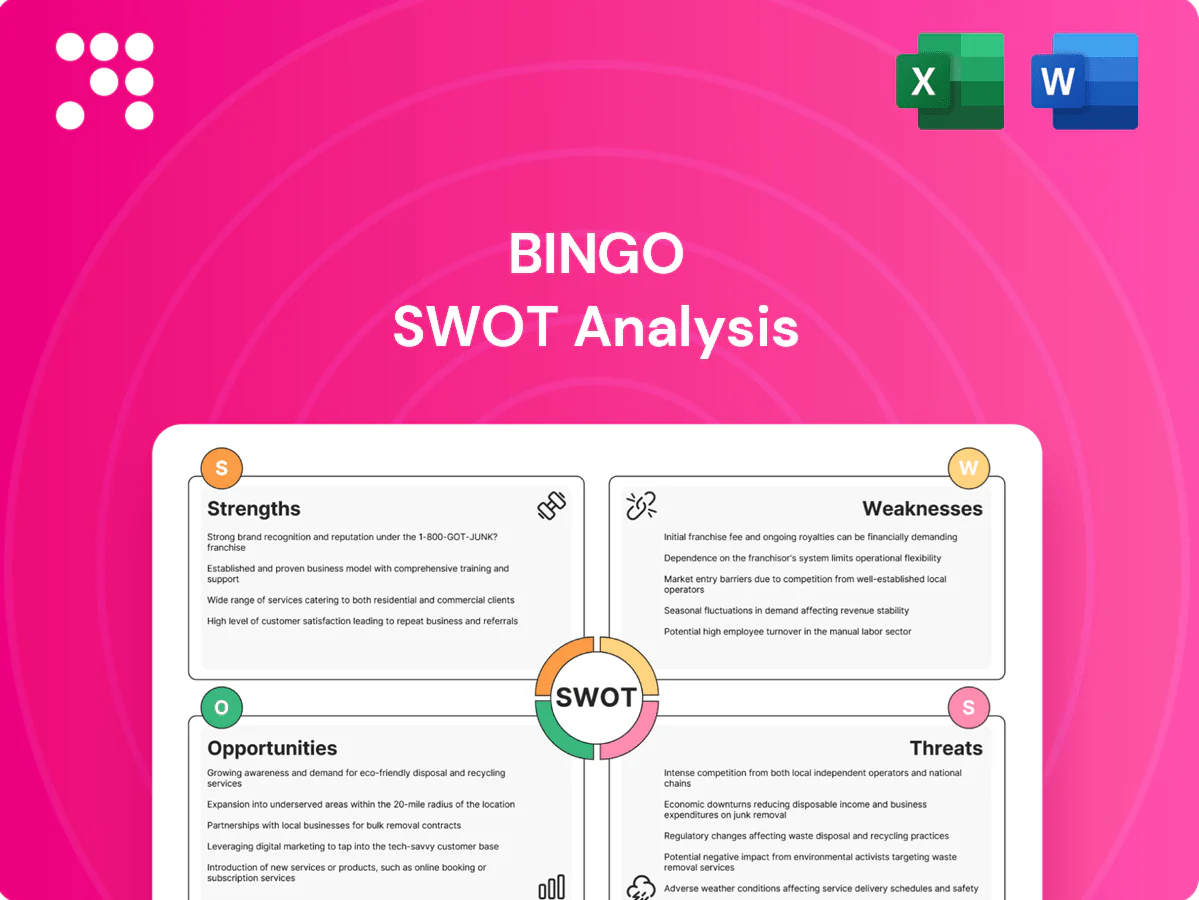
BINGO SWOT Analysis

Your Strategic Toolkit Starts Here
Explore BINGO's strategic landscape with this concise SWOT overview—see strengths like strong brand recognition, weaknesses such as limited diversification, opportunities from market expansion, and threats from regulatory shifts. Want the full analysis with financial context and editable deliverables? Purchase the complete SWOT report to unlock in-depth insights, actionable recommendations, and Excel/Word files for planning and investment decisions.
Strengths

Vertically integrated waste value chain
BINGO’s vertically integrated value chain—controlling collection, transfer, sorting and processing—lets it capture margins across the chain, supporting reported FY24 revenue of ~AUD 1.1bn and improved EBITDA conversion. Operational synergies and route-density efficiencies lower per-tonne cost and reduce reliance on third parties, while one-stop solutions raise customer retention and service speed. Balancing volumes across facilities increases resilience against local demand swings.
Leadership in C&D resource recovery
Specialist focus on construction and demolition streams delivers diversion rates exceeding 90%, producing recycled aggregates, sand and other recovered outputs that advance circular-economy targets; Bingo processes several million tonnes of C&D annually. Long-standing contracts with tier-one builders such as Lendlease and CPB Contractors anchor volumes, and scale across C&D sites boosts throughput and pricing power.

Modern sorting and processing assets
State-of-the-art MRFs and transfer stations using optical sorters, sensors and balers lifted recovery yields by 10–20 percentage points and cut contamination to under 8% according to 2024 industry benchmarks. Automated lines (typical throughput 30–100 t/hr) and compliance-ready emissions/reporting systems lower processing costs ~15–25% per tonne, boosting margins. Robust assets support >95% service-level compliance and materially increase contract win/renewal rates.

Alignment with sustainability and regulation
Rising landfill levies exceeding A$100/tonne in several Australian states (2024) and tightening ESG mandates boost demand for recovery services; federal and state circular economy targets and green building ratings such as NABERS and Green Star increase demand for recycled content. BINGO converts regulatory pressure into revenue via diversion, material sales and higher-margin recovery services, strengthening brand equity from verified environmental performance.
- Regulatory tailwind: levies >A$100/t (2024)
- Market signal: NABERS/Green Star demand for recycled inputs
- Business impact: tipping/diversion → recurring revenue
- Brand: premium positioning from verified environmental metrics
Diverse customer base and contract stickiness
- Segments: construction, commercial, residential
- Retention: recurring routes, multi-year contracts
- Drivers: high switching costs, compliance support, reliable service
- Growth: cross-sell across bins, collection, recycling
Vertical recycling platform: FY24 revenue AUD 1.1bn, >90% C&D diversion
BINGO’s vertical integration captures margins across collection-to-processing, supporting FY24 revenue ~AUD 1.1bn and stronger EBITDA conversion. C&D focus diverts >90% of several million tpa, backed by tier-one contracts. Automated MRFs raise recovery 10–20 ppt and cut processing costs ~15–25%/t. Landfill levies >A$100/t (2024) and ESG demand boost pricing power.
| Metric | 2024 |
|---|---|
| Revenue | AUD 1.1bn |
| Divert rate | >90% |
| Landfill levy | >A$100/t |
| Processing cost saving | 15–25%/t |
What is included in the product
 Detailed Word Document
Provides a concise SWOT evaluation of BINGO, highlighting internal strengths and weaknesses alongside external opportunities and threats to inform strategic decision-making and competitive positioning.

 Customizable Excel Spreadsheet
BINGO SWOT Analysis distills complex strategic inputs into a clear, visual matrix that speeds alignment and decision-making, reducing meeting friction and enabling quick updates to reflect shifting priorities.
Weaknesses

High exposure to construction cycles
High exposure to construction cycles makes volumes and pricing highly sensitive to building and infrastructure activity, with C&D and skip demand often falling sharply during downturns (construction is roughly 9–10% of GDP in many advanced markets in 2024). Project delays and slower approvals can compress cashflow and utilization rates. Seasonal swings and macro volatility drive uneven C&D and skip streams. Offsets are limited when residential and commercial demand soften simultaneously.
Capital intensity and maintenance burden
Heavy capex—refuse trucks typically cost $300,000–$600,000, roll‑off/bulk bins $300–$1,500 each, and modern MRFs commonly cost $20–100 million—drives large upfront spend and ongoing maintenance/replacement cycles. Fleet downtime and MRF outages raise service disruption risk and raise maintenance spend. High fixed costs compress margins at low volumes and can strain balance sheets during expansion.

Geographic concentration risk
Significant asset clustering in NSW and Victoria—Sydney and Melbourne together account for about 40% of Australia’s population and NSW+VIC ~60%—concentrates BINGO’s exposures in metro corridors. This heightens sensitivity to state planning decisions, local levies and waste policy shifts (e.g., differing landfill levies across states). Dense-market competition and stronger community expectations elevate operational and reputational risk. Limited geographic spread reduces resilience versus national and global peers.

Recovered commodity price volatility
- earnings-sensitivity: ±25% y/y
- contamination-costs: +10–30%
- forecast-error: >15%
- inventory/offtake-risk: 1–3 months revenue exposure
Operational and compliance complexity
Operational sites face contamination, odour, noise and traffic risks that can trigger EPA oversight and permits; statutory fines can reach about 50,000 USD per day for major air/water violations, and cleanup/liability costs can run into millions.
Robust incident response, ongoing environmental monitoring and proactive community relations are required to avoid shutdowns; a single high-profile non-compliance can cause severe reputational and financial loss.
- Contamination, odour, noise, traffic risks
- Stringent licensing & EPA enforcement; fines up to 50,000 USD/day
- Need incident response, monitoring, community engagement
- High reputational exposure from any breach
9–10% GDP construction cyclicality; NSW+VIC ~60%
High cyclicality: construction ~9–10% of GDP (2024) making volumes/pricing volatile; heavy capex (trucks $300,000–$600,000; MRFs $20–100m) raises fixed costs; NSW+VIC ~60% concentration increases policy/reputational risk. Commodity swings ±25% y/y, contamination costs +10–30%, inventory/offtake = 1–3 months; fines up to $50,000/day.
| Metric | Value |
|---|---|
| Construction share | 9–10% GDP (2024) |
| Truck capex | $300k–$600k |
| MRF capex | $20–100m |
| Regional exposure | NSW+VIC ~60% |
| Earnings volatility | ±25% y/y |
Same Document Delivered
BINGO SWOT Analysis
This is the actual BINGO SWOT analysis document you’ll receive upon purchase—no surprises, just professional quality. The preview below is taken directly from the full SWOT report you'll get; purchase unlocks the complete, editable version. You’re viewing a live preview of the real file—buy now to download the full, detailed report.

Your Strategic Toolkit Starts Here
Explore BINGO's strategic landscape with this concise SWOT overview—see strengths like strong brand recognition, weaknesses such as limited diversification, opportunities from market expansion, and threats from regulatory shifts. Want the full analysis with financial context and editable deliverables? Purchase the complete SWOT report to unlock in-depth insights, actionable recommendations, and Excel/Word files for planning and investment decisions.
Strengths
Vertically integrated waste value chain
BINGO’s vertically integrated value chain—controlling collection, transfer, sorting and processing—lets it capture margins across the chain, supporting reported FY24 revenue of ~AUD 1.1bn and improved EBITDA conversion. Operational synergies and route-density efficiencies lower per-tonne cost and reduce reliance on third parties, while one-stop solutions raise customer retention and service speed. Balancing volumes across facilities increases resilience against local demand swings.
Leadership in C&D resource recovery
Specialist focus on construction and demolition streams delivers diversion rates exceeding 90%, producing recycled aggregates, sand and other recovered outputs that advance circular-economy targets; Bingo processes several million tonnes of C&D annually. Long-standing contracts with tier-one builders such as Lendlease and CPB Contractors anchor volumes, and scale across C&D sites boosts throughput and pricing power.
Modern sorting and processing assets
State-of-the-art MRFs and transfer stations using optical sorters, sensors and balers lifted recovery yields by 10–20 percentage points and cut contamination to under 8% according to 2024 industry benchmarks. Automated lines (typical throughput 30–100 t/hr) and compliance-ready emissions/reporting systems lower processing costs ~15–25% per tonne, boosting margins. Robust assets support >95% service-level compliance and materially increase contract win/renewal rates.
Alignment with sustainability and regulation
Rising landfill levies exceeding A$100/tonne in several Australian states (2024) and tightening ESG mandates boost demand for recovery services; federal and state circular economy targets and green building ratings such as NABERS and Green Star increase demand for recycled content. BINGO converts regulatory pressure into revenue via diversion, material sales and higher-margin recovery services, strengthening brand equity from verified environmental performance.
- Regulatory tailwind: levies >A$100/t (2024)
- Market signal: NABERS/Green Star demand for recycled inputs
- Business impact: tipping/diversion → recurring revenue
- Brand: premium positioning from verified environmental metrics
Diverse customer base and contract stickiness
- Segments: construction, commercial, residential
- Retention: recurring routes, multi-year contracts
- Drivers: high switching costs, compliance support, reliable service
- Growth: cross-sell across bins, collection, recycling
Vertical recycling platform: FY24 revenue AUD 1.1bn, >90% C&D diversion
BINGO’s vertical integration captures margins across collection-to-processing, supporting FY24 revenue ~AUD 1.1bn and stronger EBITDA conversion. C&D focus diverts >90% of several million tpa, backed by tier-one contracts. Automated MRFs raise recovery 10–20 ppt and cut processing costs ~15–25%/t. Landfill levies >A$100/t (2024) and ESG demand boost pricing power.
| Metric | 2024 |
|---|---|
| Revenue | AUD 1.1bn |
| Divert rate | >90% |
| Landfill levy | >A$100/t |
| Processing cost saving | 15–25%/t |
What is included in the product
Detailed Word Document
Provides a concise SWOT evaluation of BINGO, highlighting internal strengths and weaknesses alongside external opportunities and threats to inform strategic decision-making and competitive positioning.
Customizable Excel Spreadsheet
BINGO SWOT Analysis distills complex strategic inputs into a clear, visual matrix that speeds alignment and decision-making, reducing meeting friction and enabling quick updates to reflect shifting priorities.
Weaknesses
High exposure to construction cycles
High exposure to construction cycles makes volumes and pricing highly sensitive to building and infrastructure activity, with C&D and skip demand often falling sharply during downturns (construction is roughly 9–10% of GDP in many advanced markets in 2024). Project delays and slower approvals can compress cashflow and utilization rates. Seasonal swings and macro volatility drive uneven C&D and skip streams. Offsets are limited when residential and commercial demand soften simultaneously.
Capital intensity and maintenance burden
Heavy capex—refuse trucks typically cost $300,000–$600,000, roll‑off/bulk bins $300–$1,500 each, and modern MRFs commonly cost $20–100 million—drives large upfront spend and ongoing maintenance/replacement cycles. Fleet downtime and MRF outages raise service disruption risk and raise maintenance spend. High fixed costs compress margins at low volumes and can strain balance sheets during expansion.
Geographic concentration risk
Significant asset clustering in NSW and Victoria—Sydney and Melbourne together account for about 40% of Australia’s population and NSW+VIC ~60%—concentrates BINGO’s exposures in metro corridors. This heightens sensitivity to state planning decisions, local levies and waste policy shifts (e.g., differing landfill levies across states). Dense-market competition and stronger community expectations elevate operational and reputational risk. Limited geographic spread reduces resilience versus national and global peers.
Recovered commodity price volatility
- earnings-sensitivity: ±25% y/y
- contamination-costs: +10–30%
- forecast-error: >15%
- inventory/offtake-risk: 1–3 months revenue exposure
Operational and compliance complexity
Operational sites face contamination, odour, noise and traffic risks that can trigger EPA oversight and permits; statutory fines can reach about 50,000 USD per day for major air/water violations, and cleanup/liability costs can run into millions.
Robust incident response, ongoing environmental monitoring and proactive community relations are required to avoid shutdowns; a single high-profile non-compliance can cause severe reputational and financial loss.
- Contamination, odour, noise, traffic risks
- Stringent licensing & EPA enforcement; fines up to 50,000 USD/day
- Need incident response, monitoring, community engagement
- High reputational exposure from any breach
9–10% GDP construction cyclicality; NSW+VIC ~60%
High cyclicality: construction ~9–10% of GDP (2024) making volumes/pricing volatile; heavy capex (trucks $300,000–$600,000; MRFs $20–100m) raises fixed costs; NSW+VIC ~60% concentration increases policy/reputational risk. Commodity swings ±25% y/y, contamination costs +10–30%, inventory/offtake = 1–3 months; fines up to $50,000/day.
| Metric | Value |
|---|---|
| Construction share | 9–10% GDP (2024) |
| Truck capex | $300k–$600k |
| MRF capex | $20–100m |
| Regional exposure | NSW+VIC ~60% |
| Earnings volatility | ±25% y/y |
Same Document Delivered
BINGO SWOT Analysis
This is the actual BINGO SWOT analysis document you’ll receive upon purchase—no surprises, just professional quality. The preview below is taken directly from the full SWOT report you'll get; purchase unlocks the complete, editable version. You’re viewing a live preview of the real file—buy now to download the full, detailed report.
Original: $10.00
-65%$10.00
$3.50Description
Your Strategic Toolkit Starts Here
Explore BINGO's strategic landscape with this concise SWOT overview—see strengths like strong brand recognition, weaknesses such as limited diversification, opportunities from market expansion, and threats from regulatory shifts. Want the full analysis with financial context and editable deliverables? Purchase the complete SWOT report to unlock in-depth insights, actionable recommendations, and Excel/Word files for planning and investment decisions.
Strengths
Vertically integrated waste value chain
BINGO’s vertically integrated value chain—controlling collection, transfer, sorting and processing—lets it capture margins across the chain, supporting reported FY24 revenue of ~AUD 1.1bn and improved EBITDA conversion. Operational synergies and route-density efficiencies lower per-tonne cost and reduce reliance on third parties, while one-stop solutions raise customer retention and service speed. Balancing volumes across facilities increases resilience against local demand swings.
Leadership in C&D resource recovery
Specialist focus on construction and demolition streams delivers diversion rates exceeding 90%, producing recycled aggregates, sand and other recovered outputs that advance circular-economy targets; Bingo processes several million tonnes of C&D annually. Long-standing contracts with tier-one builders such as Lendlease and CPB Contractors anchor volumes, and scale across C&D sites boosts throughput and pricing power.
Modern sorting and processing assets
State-of-the-art MRFs and transfer stations using optical sorters, sensors and balers lifted recovery yields by 10–20 percentage points and cut contamination to under 8% according to 2024 industry benchmarks. Automated lines (typical throughput 30–100 t/hr) and compliance-ready emissions/reporting systems lower processing costs ~15–25% per tonne, boosting margins. Robust assets support >95% service-level compliance and materially increase contract win/renewal rates.
Alignment with sustainability and regulation
Rising landfill levies exceeding A$100/tonne in several Australian states (2024) and tightening ESG mandates boost demand for recovery services; federal and state circular economy targets and green building ratings such as NABERS and Green Star increase demand for recycled content. BINGO converts regulatory pressure into revenue via diversion, material sales and higher-margin recovery services, strengthening brand equity from verified environmental performance.
- Regulatory tailwind: levies >A$100/t (2024)
- Market signal: NABERS/Green Star demand for recycled inputs
- Business impact: tipping/diversion → recurring revenue
- Brand: premium positioning from verified environmental metrics
Diverse customer base and contract stickiness
- Segments: construction, commercial, residential
- Retention: recurring routes, multi-year contracts
- Drivers: high switching costs, compliance support, reliable service
- Growth: cross-sell across bins, collection, recycling
Vertical recycling platform: FY24 revenue AUD 1.1bn, >90% C&D diversion
BINGO’s vertical integration captures margins across collection-to-processing, supporting FY24 revenue ~AUD 1.1bn and stronger EBITDA conversion. C&D focus diverts >90% of several million tpa, backed by tier-one contracts. Automated MRFs raise recovery 10–20 ppt and cut processing costs ~15–25%/t. Landfill levies >A$100/t (2024) and ESG demand boost pricing power.
| Metric | 2024 |
|---|---|
| Revenue | AUD 1.1bn |
| Divert rate | >90% |
| Landfill levy | >A$100/t |
| Processing cost saving | 15–25%/t |
What is included in the product
Detailed Word Document
Provides a concise SWOT evaluation of BINGO, highlighting internal strengths and weaknesses alongside external opportunities and threats to inform strategic decision-making and competitive positioning.
Customizable Excel Spreadsheet
BINGO SWOT Analysis distills complex strategic inputs into a clear, visual matrix that speeds alignment and decision-making, reducing meeting friction and enabling quick updates to reflect shifting priorities.
Weaknesses
High exposure to construction cycles
High exposure to construction cycles makes volumes and pricing highly sensitive to building and infrastructure activity, with C&D and skip demand often falling sharply during downturns (construction is roughly 9–10% of GDP in many advanced markets in 2024). Project delays and slower approvals can compress cashflow and utilization rates. Seasonal swings and macro volatility drive uneven C&D and skip streams. Offsets are limited when residential and commercial demand soften simultaneously.
Capital intensity and maintenance burden
Heavy capex—refuse trucks typically cost $300,000–$600,000, roll‑off/bulk bins $300–$1,500 each, and modern MRFs commonly cost $20–100 million—drives large upfront spend and ongoing maintenance/replacement cycles. Fleet downtime and MRF outages raise service disruption risk and raise maintenance spend. High fixed costs compress margins at low volumes and can strain balance sheets during expansion.
Geographic concentration risk
Significant asset clustering in NSW and Victoria—Sydney and Melbourne together account for about 40% of Australia’s population and NSW+VIC ~60%—concentrates BINGO’s exposures in metro corridors. This heightens sensitivity to state planning decisions, local levies and waste policy shifts (e.g., differing landfill levies across states). Dense-market competition and stronger community expectations elevate operational and reputational risk. Limited geographic spread reduces resilience versus national and global peers.
Recovered commodity price volatility
- earnings-sensitivity: ±25% y/y
- contamination-costs: +10–30%
- forecast-error: >15%
- inventory/offtake-risk: 1–3 months revenue exposure
Operational and compliance complexity
Operational sites face contamination, odour, noise and traffic risks that can trigger EPA oversight and permits; statutory fines can reach about 50,000 USD per day for major air/water violations, and cleanup/liability costs can run into millions.
Robust incident response, ongoing environmental monitoring and proactive community relations are required to avoid shutdowns; a single high-profile non-compliance can cause severe reputational and financial loss.
- Contamination, odour, noise, traffic risks
- Stringent licensing & EPA enforcement; fines up to 50,000 USD/day
- Need incident response, monitoring, community engagement
- High reputational exposure from any breach
9–10% GDP construction cyclicality; NSW+VIC ~60%
High cyclicality: construction ~9–10% of GDP (2024) making volumes/pricing volatile; heavy capex (trucks $300,000–$600,000; MRFs $20–100m) raises fixed costs; NSW+VIC ~60% concentration increases policy/reputational risk. Commodity swings ±25% y/y, contamination costs +10–30%, inventory/offtake = 1–3 months; fines up to $50,000/day.
| Metric | Value |
|---|---|
| Construction share | 9–10% GDP (2024) |
| Truck capex | $300k–$600k |
| MRF capex | $20–100m |
| Regional exposure | NSW+VIC ~60% |
| Earnings volatility | ±25% y/y |
Same Document Delivered
BINGO SWOT Analysis
This is the actual BINGO SWOT analysis document you’ll receive upon purchase—no surprises, just professional quality. The preview below is taken directly from the full SWOT report you'll get; purchase unlocks the complete, editable version. You’re viewing a live preview of the real file—buy now to download the full, detailed report.











