BioNTech Porter's Five Forces Analysis

From Overview to Strategy Blueprint
BioNTech faces intense competitive rivalry and high buyer scrutiny, balanced by strong supplier relationships for specialized inputs and significant regulatory and innovation barriers that limit new entrants; substitute threats vary by therapeutic area and pricing dynamics. This brief snapshot only scratches the surface. Unlock the full Porter's Five Forces Analysis to explore BioNTech’s competitive dynamics, market pressures, and strategic advantages in detail.
Suppliers Bargaining Power

Scarce mRNA inputs and LNP components
Core mRNA inputs (nucleoside-modified nucleotides, capping reagents) and LNP lipids are sourced from a single-digit number of qualified suppliers, creating scarcity and long lead times; qualification and GMP revalidation typically take 6–12 months, raising effective switching costs. Supplier concentration increases pricing leverage and, while dual-sourcing is feasible, it is time-consuming and costly.
Specialized equipment and single-use systems
By 2024 three vendors — Sartorius, Cytiva (GE Healthcare) and Thermo Fisher — control most high-spec instruments, microfluidic mixers and single-use bioprocess skids used by mRNA manufacturers, concentrating supplier power. Customization and validation embed vendor technology into GMP processes, raising switching costs and lock-in. Platform substitutions risk yield and quality variability documented in industry transfers, while multi-year service contracts (commonly 3–5 years) further entrench dependence.

GMP consumables and quality standards
Strict GMP and regulatory documentation requirements (EU Annex 11 and FDA 21 CFR Part 11) limit acceptable suppliers for BioNTech, narrowing sources for critical consumables. Batch traceability and QA audits raise onboarding costs and time, while approved-vendor lists reduce negotiating flexibility. Any supplier deviation can trigger costly revalidation, reinforcing supplier power.

Cold-chain logistics and fill-finish capacity
Ultra-cold storage, specialized shippers and qualified couriers remain capacity constrained for BioNTech, with industry reports through 2024 noting persistent shortages after pandemic peak demand; sterile fill-finish lines with high throughput continue to be bottlenecks, driving spot premiums during surges.
Long-term capacity reservations mitigate disruption but raise fixed costs and reduce flexibility, squeezing margins during lower demand periods.
- Cold-chain market ~200B (2023–24 trend)
- Fill-finish utilization often >85% in high-demand phases
- Spot premiums material during spikes; long-term bookings increase costs
Biotech reagents and enzymes
- Market concentration: major suppliers dominate
- Lead times: weeks–months for specialized items
- MOQs and custom batches increase buyer dependence
- Contracts: price escalators tied to input costs/CPI
Supplier concentration and long GMP revalidation drive price leverage and cold-chain premiums
Supplier concentration (single-digit qualified vendors) grants pricing and lead-time leverage; qualification/GMP revalidation 6–12 months elevates switching costs. Key vendors (Sartorius, Cytiva, Thermo Fisher) dominate instruments and reagents, while cold-chain market ~200B (2023–24) and fill-finish utilization >85% during surges create spot premiums. Contracts often include price escalators and MOQs, locking buyers.
| Metric | Value | Note |
|---|---|---|
| GMP revalidation | 6–12 months | Switching cost |
| Cold-chain market | ~200B | 2023–24 |
| Fill-finish utl. | >85% | Peak demand |
What is included in the product
 Detailed Word Document
Concise Porter's Five Forces analysis tailored to BioNTech, evaluating competitive rivalry, supplier and buyer power, threat of new entrants and substitutes, and regulatory/disruptive risks shaping its pricing, profitability, and strategic defenses.

 Customizable Excel Spreadsheet
Instant, one-sheet Porter's Five Forces for BioNTech—customizable pressure levels and clean spider chart visualization to simplify strategic decisions and slide-ready summaries.
Customers Bargaining Power

Government and supranational purchasers
Public health agencies and alliances such as the EU and WHO-affiliated COVAX aggregate demand, securing volume-based pricing and driving down unit prices for BioNTech vaccines; public purchasers accounted for the majority of COVID-19 vaccine volumes (over 70% of doses procured globally in 2021–2022). Tender processes and transparency requirements increase buyer leverage, letting them dictate delivery schedules and liability clauses, while budget cycles and shifting health priorities in 2024 influence reorder power.
Large pharma partners and co-commercialization
Large pharma partners can demand favorable economics, milestones and rights, leveraging the global pharma market size of about $1.6 trillion in 2024 and the top firms’ ~40% market share. Their sales channels and manufacturing scale strengthen bargaining power, often forcing co-development terms that cap margins while expanding access. Partners’ portfolio shifts can reallocate BioNTech resources and reprioritize launches and funding.

Payers and HTA bodies
Insurers and HTA bodies intensely scrutinize cost-effectiveness — over 30 OECD countries had formal HTA agencies by 2024 and decision makers often benchmark against thresholds like $100,000–$150,000 per QALY. Reimbursement determinations materially affect price realization and patient access across markets. Outcomes-based contracts increasingly shift performance and revenue risk to manufacturers, while cross-country reference pricing amplifies buyer leverage across jurisdictions.

Hospitals and oncology centers
For individualized therapies hospitals and oncology centers shape uptake through protocol adoption and trial participation; budget committees negotiate price concessions and bundled support given CAR-T list prices of roughly 373,000–475,000 USD (2024). Clinical workflow integration and vein-to-vein turnaround (≈3–4 weeks) are key decision levers. Concentration in major centers, with ≈300 US authorized CAR-T sites (2023–24), elevates their negotiating power.
- Protocol adoption drives demand
- Budget committees negotiate discounts/support
- Integration & turnaround (~3–4 weeks) influence selection
- Concentration (≈300 US sites) increases buyer power
Switching costs vs. clinical differentiation
High switching costs from cold-chain logistics, staff training and EHR integration reduce buyer power when BioNTech products show clear clinical differentiation, while the presence of multiple therapeutic alternatives and biosimilars strengthens buyers' negotiating leverage; real-world evidence and companion diagnostics continuously reshape perceived value, and post-pandemic demand normalization has made purchasers more selective.
- High switching costs vs differentiation
- Alternatives increase buyer leverage
- RWE and diagnostics shift value
- Normalized demand → greater selectivity
Public tenders and HTAs compress prices; provider concentration sustains premium CAR-T pricing
Public purchasers (>70% COVID doses 2021–22) and tenders drive price pressure; large pharma partners (global market ~$1.6T in 2024) and HTA bodies (>30 OECD agencies by 2024) further constrain pricing and reimbursement. Provider concentration (≈300 US CAR-T sites) and high switching costs support premium pricing, while alternatives, RWE and diagnostics increase buyer leverage and selectivity.
| Buyer | Metric | 2024 |
|---|---|---|
| Public purchasers | Share of COVID doses | >70% |
| Pharma partners | Market size | $1.6T |
| HTA | OECD agencies | >30 |
| Providers | CAR-T sites (US) | ≈300 |
What You See Is What You Get
BioNTech Porter's Five Forces Analysis
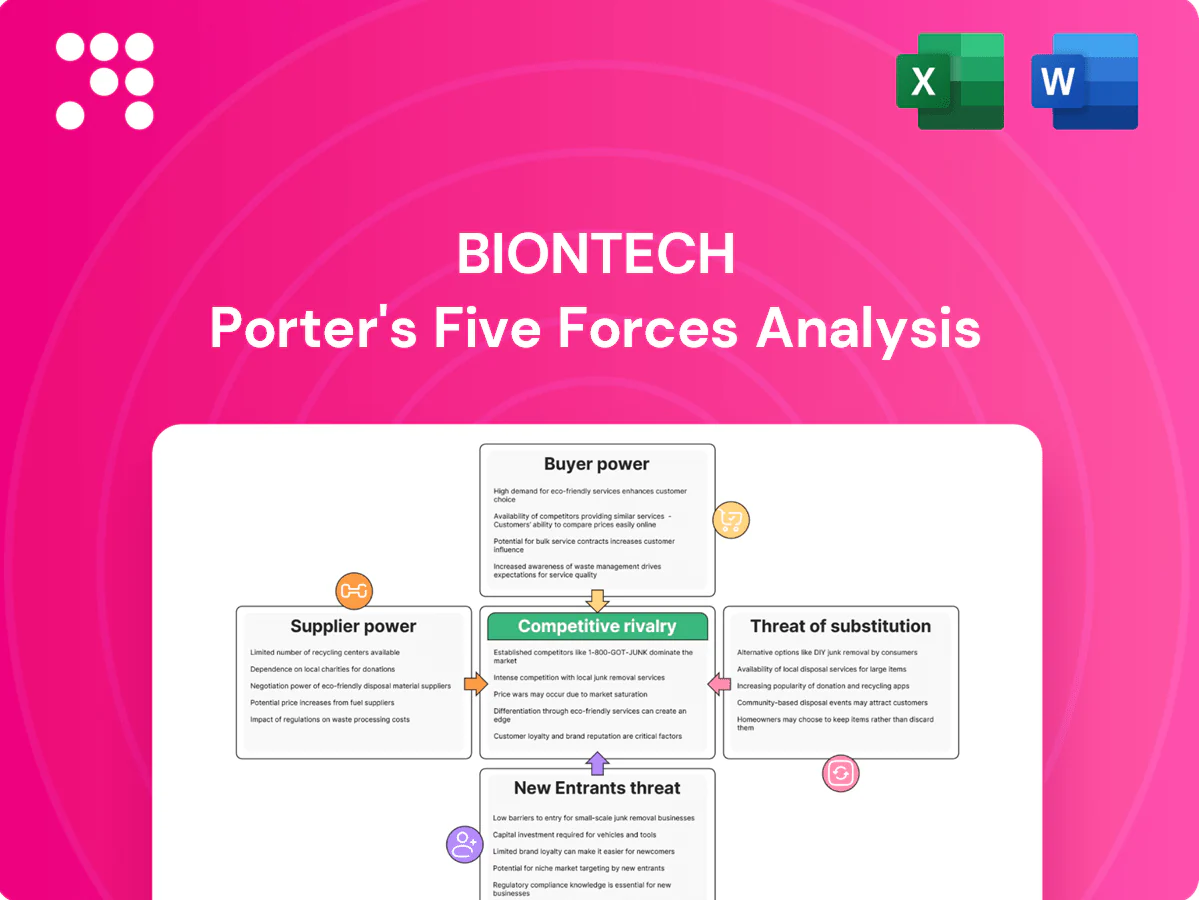
This preview shows the exact BioNTech Porter's Five Forces analysis you'll receive immediately after purchase—comprehensive, professionally formatted, and ready to use. The report covers threat of new entrants, bargaining power of suppliers and buyers, threat of substitutes, and competitive rivalry with data-driven insights specific to BioNTech. No samples or placeholders; what you see is the deliverable available for instant download.

From Overview to Strategy Blueprint
BioNTech faces intense competitive rivalry and high buyer scrutiny, balanced by strong supplier relationships for specialized inputs and significant regulatory and innovation barriers that limit new entrants; substitute threats vary by therapeutic area and pricing dynamics. This brief snapshot only scratches the surface. Unlock the full Porter's Five Forces Analysis to explore BioNTech’s competitive dynamics, market pressures, and strategic advantages in detail.
Suppliers Bargaining Power
Scarce mRNA inputs and LNP components
Core mRNA inputs (nucleoside-modified nucleotides, capping reagents) and LNP lipids are sourced from a single-digit number of qualified suppliers, creating scarcity and long lead times; qualification and GMP revalidation typically take 6–12 months, raising effective switching costs. Supplier concentration increases pricing leverage and, while dual-sourcing is feasible, it is time-consuming and costly.
Specialized equipment and single-use systems
By 2024 three vendors — Sartorius, Cytiva (GE Healthcare) and Thermo Fisher — control most high-spec instruments, microfluidic mixers and single-use bioprocess skids used by mRNA manufacturers, concentrating supplier power. Customization and validation embed vendor technology into GMP processes, raising switching costs and lock-in. Platform substitutions risk yield and quality variability documented in industry transfers, while multi-year service contracts (commonly 3–5 years) further entrench dependence.
GMP consumables and quality standards
Strict GMP and regulatory documentation requirements (EU Annex 11 and FDA 21 CFR Part 11) limit acceptable suppliers for BioNTech, narrowing sources for critical consumables. Batch traceability and QA audits raise onboarding costs and time, while approved-vendor lists reduce negotiating flexibility. Any supplier deviation can trigger costly revalidation, reinforcing supplier power.
Cold-chain logistics and fill-finish capacity
Ultra-cold storage, specialized shippers and qualified couriers remain capacity constrained for BioNTech, with industry reports through 2024 noting persistent shortages after pandemic peak demand; sterile fill-finish lines with high throughput continue to be bottlenecks, driving spot premiums during surges.
Long-term capacity reservations mitigate disruption but raise fixed costs and reduce flexibility, squeezing margins during lower demand periods.
- Cold-chain market ~200B (2023–24 trend)
- Fill-finish utilization often >85% in high-demand phases
- Spot premiums material during spikes; long-term bookings increase costs
Biotech reagents and enzymes
- Market concentration: major suppliers dominate
- Lead times: weeks–months for specialized items
- MOQs and custom batches increase buyer dependence
- Contracts: price escalators tied to input costs/CPI
Supplier concentration and long GMP revalidation drive price leverage and cold-chain premiums
Supplier concentration (single-digit qualified vendors) grants pricing and lead-time leverage; qualification/GMP revalidation 6–12 months elevates switching costs. Key vendors (Sartorius, Cytiva, Thermo Fisher) dominate instruments and reagents, while cold-chain market ~200B (2023–24) and fill-finish utilization >85% during surges create spot premiums. Contracts often include price escalators and MOQs, locking buyers.
| Metric | Value | Note |
|---|---|---|
| GMP revalidation | 6–12 months | Switching cost |
| Cold-chain market | ~200B | 2023–24 |
| Fill-finish utl. | >85% | Peak demand |
What is included in the product
Detailed Word Document
Concise Porter's Five Forces analysis tailored to BioNTech, evaluating competitive rivalry, supplier and buyer power, threat of new entrants and substitutes, and regulatory/disruptive risks shaping its pricing, profitability, and strategic defenses.
Customizable Excel Spreadsheet
Instant, one-sheet Porter's Five Forces for BioNTech—customizable pressure levels and clean spider chart visualization to simplify strategic decisions and slide-ready summaries.
Customers Bargaining Power
Government and supranational purchasers
Public health agencies and alliances such as the EU and WHO-affiliated COVAX aggregate demand, securing volume-based pricing and driving down unit prices for BioNTech vaccines; public purchasers accounted for the majority of COVID-19 vaccine volumes (over 70% of doses procured globally in 2021–2022). Tender processes and transparency requirements increase buyer leverage, letting them dictate delivery schedules and liability clauses, while budget cycles and shifting health priorities in 2024 influence reorder power.
Large pharma partners and co-commercialization
Large pharma partners can demand favorable economics, milestones and rights, leveraging the global pharma market size of about $1.6 trillion in 2024 and the top firms’ ~40% market share. Their sales channels and manufacturing scale strengthen bargaining power, often forcing co-development terms that cap margins while expanding access. Partners’ portfolio shifts can reallocate BioNTech resources and reprioritize launches and funding.
Payers and HTA bodies
Insurers and HTA bodies intensely scrutinize cost-effectiveness — over 30 OECD countries had formal HTA agencies by 2024 and decision makers often benchmark against thresholds like $100,000–$150,000 per QALY. Reimbursement determinations materially affect price realization and patient access across markets. Outcomes-based contracts increasingly shift performance and revenue risk to manufacturers, while cross-country reference pricing amplifies buyer leverage across jurisdictions.
Hospitals and oncology centers
For individualized therapies hospitals and oncology centers shape uptake through protocol adoption and trial participation; budget committees negotiate price concessions and bundled support given CAR-T list prices of roughly 373,000–475,000 USD (2024). Clinical workflow integration and vein-to-vein turnaround (≈3–4 weeks) are key decision levers. Concentration in major centers, with ≈300 US authorized CAR-T sites (2023–24), elevates their negotiating power.
- Protocol adoption drives demand
- Budget committees negotiate discounts/support
- Integration & turnaround (~3–4 weeks) influence selection
- Concentration (≈300 US sites) increases buyer power
Switching costs vs. clinical differentiation
High switching costs from cold-chain logistics, staff training and EHR integration reduce buyer power when BioNTech products show clear clinical differentiation, while the presence of multiple therapeutic alternatives and biosimilars strengthens buyers' negotiating leverage; real-world evidence and companion diagnostics continuously reshape perceived value, and post-pandemic demand normalization has made purchasers more selective.
- High switching costs vs differentiation
- Alternatives increase buyer leverage
- RWE and diagnostics shift value
- Normalized demand → greater selectivity
Public tenders and HTAs compress prices; provider concentration sustains premium CAR-T pricing
Public purchasers (>70% COVID doses 2021–22) and tenders drive price pressure; large pharma partners (global market ~$1.6T in 2024) and HTA bodies (>30 OECD agencies by 2024) further constrain pricing and reimbursement. Provider concentration (≈300 US CAR-T sites) and high switching costs support premium pricing, while alternatives, RWE and diagnostics increase buyer leverage and selectivity.
| Buyer | Metric | 2024 |
|---|---|---|
| Public purchasers | Share of COVID doses | >70% |
| Pharma partners | Market size | $1.6T |
| HTA | OECD agencies | >30 |
| Providers | CAR-T sites (US) | ≈300 |
What You See Is What You Get
BioNTech Porter's Five Forces Analysis
This preview shows the exact BioNTech Porter's Five Forces analysis you'll receive immediately after purchase—comprehensive, professionally formatted, and ready to use. The report covers threat of new entrants, bargaining power of suppliers and buyers, threat of substitutes, and competitive rivalry with data-driven insights specific to BioNTech. No samples or placeholders; what you see is the deliverable available for instant download.
Description
From Overview to Strategy Blueprint
BioNTech faces intense competitive rivalry and high buyer scrutiny, balanced by strong supplier relationships for specialized inputs and significant regulatory and innovation barriers that limit new entrants; substitute threats vary by therapeutic area and pricing dynamics. This brief snapshot only scratches the surface. Unlock the full Porter's Five Forces Analysis to explore BioNTech’s competitive dynamics, market pressures, and strategic advantages in detail.
Suppliers Bargaining Power
Scarce mRNA inputs and LNP components
Core mRNA inputs (nucleoside-modified nucleotides, capping reagents) and LNP lipids are sourced from a single-digit number of qualified suppliers, creating scarcity and long lead times; qualification and GMP revalidation typically take 6–12 months, raising effective switching costs. Supplier concentration increases pricing leverage and, while dual-sourcing is feasible, it is time-consuming and costly.
Specialized equipment and single-use systems
By 2024 three vendors — Sartorius, Cytiva (GE Healthcare) and Thermo Fisher — control most high-spec instruments, microfluidic mixers and single-use bioprocess skids used by mRNA manufacturers, concentrating supplier power. Customization and validation embed vendor technology into GMP processes, raising switching costs and lock-in. Platform substitutions risk yield and quality variability documented in industry transfers, while multi-year service contracts (commonly 3–5 years) further entrench dependence.
GMP consumables and quality standards
Strict GMP and regulatory documentation requirements (EU Annex 11 and FDA 21 CFR Part 11) limit acceptable suppliers for BioNTech, narrowing sources for critical consumables. Batch traceability and QA audits raise onboarding costs and time, while approved-vendor lists reduce negotiating flexibility. Any supplier deviation can trigger costly revalidation, reinforcing supplier power.
Cold-chain logistics and fill-finish capacity
Ultra-cold storage, specialized shippers and qualified couriers remain capacity constrained for BioNTech, with industry reports through 2024 noting persistent shortages after pandemic peak demand; sterile fill-finish lines with high throughput continue to be bottlenecks, driving spot premiums during surges.
Long-term capacity reservations mitigate disruption but raise fixed costs and reduce flexibility, squeezing margins during lower demand periods.
- Cold-chain market ~200B (2023–24 trend)
- Fill-finish utilization often >85% in high-demand phases
- Spot premiums material during spikes; long-term bookings increase costs
Biotech reagents and enzymes
- Market concentration: major suppliers dominate
- Lead times: weeks–months for specialized items
- MOQs and custom batches increase buyer dependence
- Contracts: price escalators tied to input costs/CPI
Supplier concentration and long GMP revalidation drive price leverage and cold-chain premiums
Supplier concentration (single-digit qualified vendors) grants pricing and lead-time leverage; qualification/GMP revalidation 6–12 months elevates switching costs. Key vendors (Sartorius, Cytiva, Thermo Fisher) dominate instruments and reagents, while cold-chain market ~200B (2023–24) and fill-finish utilization >85% during surges create spot premiums. Contracts often include price escalators and MOQs, locking buyers.
| Metric | Value | Note |
|---|---|---|
| GMP revalidation | 6–12 months | Switching cost |
| Cold-chain market | ~200B | 2023–24 |
| Fill-finish utl. | >85% | Peak demand |
What is included in the product
Detailed Word Document
Concise Porter's Five Forces analysis tailored to BioNTech, evaluating competitive rivalry, supplier and buyer power, threat of new entrants and substitutes, and regulatory/disruptive risks shaping its pricing, profitability, and strategic defenses.
Customizable Excel Spreadsheet
Instant, one-sheet Porter's Five Forces for BioNTech—customizable pressure levels and clean spider chart visualization to simplify strategic decisions and slide-ready summaries.
Customers Bargaining Power
Government and supranational purchasers
Public health agencies and alliances such as the EU and WHO-affiliated COVAX aggregate demand, securing volume-based pricing and driving down unit prices for BioNTech vaccines; public purchasers accounted for the majority of COVID-19 vaccine volumes (over 70% of doses procured globally in 2021–2022). Tender processes and transparency requirements increase buyer leverage, letting them dictate delivery schedules and liability clauses, while budget cycles and shifting health priorities in 2024 influence reorder power.
Large pharma partners and co-commercialization
Large pharma partners can demand favorable economics, milestones and rights, leveraging the global pharma market size of about $1.6 trillion in 2024 and the top firms’ ~40% market share. Their sales channels and manufacturing scale strengthen bargaining power, often forcing co-development terms that cap margins while expanding access. Partners’ portfolio shifts can reallocate BioNTech resources and reprioritize launches and funding.
Payers and HTA bodies
Insurers and HTA bodies intensely scrutinize cost-effectiveness — over 30 OECD countries had formal HTA agencies by 2024 and decision makers often benchmark against thresholds like $100,000–$150,000 per QALY. Reimbursement determinations materially affect price realization and patient access across markets. Outcomes-based contracts increasingly shift performance and revenue risk to manufacturers, while cross-country reference pricing amplifies buyer leverage across jurisdictions.
Hospitals and oncology centers
For individualized therapies hospitals and oncology centers shape uptake through protocol adoption and trial participation; budget committees negotiate price concessions and bundled support given CAR-T list prices of roughly 373,000–475,000 USD (2024). Clinical workflow integration and vein-to-vein turnaround (≈3–4 weeks) are key decision levers. Concentration in major centers, with ≈300 US authorized CAR-T sites (2023–24), elevates their negotiating power.
- Protocol adoption drives demand
- Budget committees negotiate discounts/support
- Integration & turnaround (~3–4 weeks) influence selection
- Concentration (≈300 US sites) increases buyer power
Switching costs vs. clinical differentiation
High switching costs from cold-chain logistics, staff training and EHR integration reduce buyer power when BioNTech products show clear clinical differentiation, while the presence of multiple therapeutic alternatives and biosimilars strengthens buyers' negotiating leverage; real-world evidence and companion diagnostics continuously reshape perceived value, and post-pandemic demand normalization has made purchasers more selective.
- High switching costs vs differentiation
- Alternatives increase buyer leverage
- RWE and diagnostics shift value
- Normalized demand → greater selectivity
Public tenders and HTAs compress prices; provider concentration sustains premium CAR-T pricing
Public purchasers (>70% COVID doses 2021–22) and tenders drive price pressure; large pharma partners (global market ~$1.6T in 2024) and HTA bodies (>30 OECD agencies by 2024) further constrain pricing and reimbursement. Provider concentration (≈300 US CAR-T sites) and high switching costs support premium pricing, while alternatives, RWE and diagnostics increase buyer leverage and selectivity.
| Buyer | Metric | 2024 |
|---|---|---|
| Public purchasers | Share of COVID doses | >70% |
| Pharma partners | Market size | $1.6T |
| HTA | OECD agencies | >30 |
| Providers | CAR-T sites (US) | ≈300 |
What You See Is What You Get
BioNTech Porter's Five Forces Analysis
This preview shows the exact BioNTech Porter's Five Forces analysis you'll receive immediately after purchase—comprehensive, professionally formatted, and ready to use. The report covers threat of new entrants, bargaining power of suppliers and buyers, threat of substitutes, and competitive rivalry with data-driven insights specific to BioNTech. No samples or placeholders; what you see is the deliverable available for instant download.











