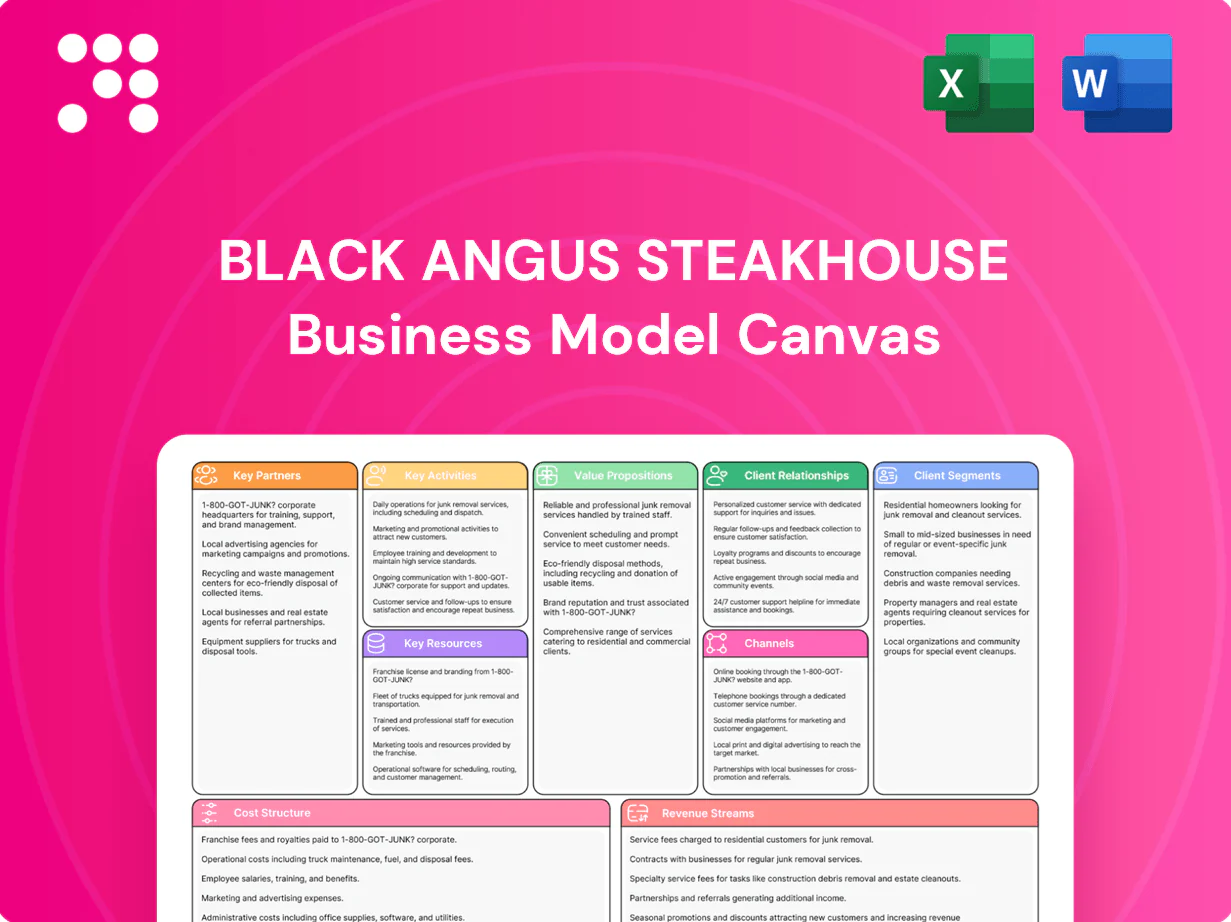
Black Angus Steakhouse Business Model Canvas

Steakhouse Business Model Canvas: Customers, Value & Revenue
Unlock the strategic blueprint behind Black Angus Steakhouse with our concise Business Model Canvas overview—detailing customer segments, value propositions, channels and revenue streams. Want the full, editable Canvas with SWOT-backed insights and financial implications? Download the complete Word & Excel package to apply or benchmark today.
Partnerships

Ranchers & Beef Suppliers
Secure relationships with reputable ranchers ensure consistent access to high-quality Angus beef and prime rib, typically sourcing through approved suppliers under 12–36 month agreements. Long-term contracts stabilize pricing and reduce supply volatility for core SKU procurement. Co-developing specs locks in cut, marbling, and aging standards and enables joint marketing highlighting traceability and animal welfare.
Seafood & Specialty Purveyors
Partnering with vetted seafood vendors ensures freshness and adherence to sustainability standards that 70% of diners said influenced purchases in 2024, supporting brand trust. Seasonal sourcing enables limited-time offers that historically lift traffic 5–8% and boost average check. Vendor QA programs can cut spoilage and returns by around 15–20%, improving gross margins. Collaborative forecasting aligns catch availability with menu planning, reducing stockouts by roughly 15%.

Beverage Distributors & Breweries
Beverage distributors and brewery partners secure a steady flow of wines, beers and spirits tailored to steak pairings, leveraging 2024 craft-beer trends (US craft share ~13% by volume, Brewers Association) to source limited-release taps that drive novelty and repeat visits. Volume pricing and rebates enhance beverage gross margins while co-op funds underwrite in-restaurant promotions and tasting events.

Delivery & Reservation Platforms
Delivery aggregators (DoorDash 56% US share, Uber Eats ~24% in 2024) expand off‑premise reach, smoothing demand variability and capturing ~one quarter of incremental sales for full‑service chains. Reservation partners raise table turns and guest‑flow visibility, while data‑sharing improves demand forecasting and enables targeted offers; joint campaigns typically lift off‑peak traffic by double digits.
- Aggregator reach: DoorDash 56%
- Reservation visibility: higher turns, fewer no‑shows
- Data sharing: better forecasting, targeted promos
- Joint campaigns: +10%+ off‑peak utilization
Landlords & Equipment Vendors
Favorable leases with tenant improvement allowances averaging $50–150 per sq ft in 2024 materially improve Black Angus unit economics by lowering upfront buildout costs. Kitchen equipment partners provide service-level agreements targeting 99% uptime, cutting downtime-related sales losses by ~20%. Coordinated maintenance and bulk purchasing reduced equipment capex by ~18% and lowered health-code risk through faster repairs.
- TI allowances: $50–150/sq ft (2024)
- SLA uptime: 99% — ~20% fewer downtime losses
- Bulk capex savings: ~18% on grills/ovens/refrigeration
Ranch deals secure supply; 15-20% spoilage, 18% capex cuts
Long-term contracts with ranchers (12–36 months) secure consistent Angus beef specs and price stability. Seafood, beverage and equipment partners cut spoilage and capex (~15–20% spoilage reduction; ~18% capex savings) while seasonal and co‑op promotions lift traffic 5–8%. Aggregators (DoorDash 56%, Uber Eats 24% 2024) and reservation partners expand off‑premise sales and improve forecasting.
| Partner | Metric | 2024 |
|---|---|---|
| Ranchers | Contract | 12–36 mo |
| Seafood | Purchase influence | 70% |
| Aggregators | Share | DoorDash 56%, Uber Eats 24% |
| Leases | TI | $50–150/sq ft |
What is included in the product
 Detailed Word Document
A comprehensive Business Model Canvas for Black Angus Steakhouse outlining customer segments, value propositions, channels, revenue streams, key partners, activities, resources, cost structure and customer relationships in nine classic blocks; includes competitive advantages and linked SWOT analysis to support investor presentations and strategic decision-making.

 Customizable Excel Spreadsheet
One-page editable Business Model Canvas for Black Angus Steakhouse that condenses strategy into a clean, shareable layout—saves hours formatting and helps teams quickly identify core components for brainstorming, boardrooms, or competitive comparison.
Activities

Menu Engineering & QA
Analyze item mix, margins and prep complexity to shift SKUs toward higher-contribution dishes, targeting industry food-cost bands of 28–35% to lift gross margin; 2024 benchmarking shows full-service concepts focus on mix optimization to improve profitability. Standardize recipes and cooking specs to reduce variance and speed ticket times. Pilot limited-time offerings to test demand and seasonality, aiming for 4–8% incremental sales per LTO. Conduct vendor and product audits quarterly to sustain quality and control cost.
Procurement & Inventory Control
Forecast weekly and seasonal demand using POS trends to align orders with sales patterns and avoid stockouts, targeting a restaurant food cost near 30% as industry benchmarks in 2024 suggest. Implement FIFO, batch tracking and waste logs to reduce shrink and improve gross margin. Maintain 1–3 days safety stock for high-velocity SKUs and negotiate fixed pricing and delivery windows to stabilize COGS and reduce variability.

Culinary Execution & Service
Ensure precise steak doneness with a target 95% accuracy and standardized plating within a 60–90 second pass window to maintain consistency at scale. Deliver hospitable table service aligned to casual dining norms with average check & service cadence monitoring; aim for ~1.8 table turns per evening without eroding experience. Handle peaks via expo coordination and line balancing, sustaining throughput with a 1:4 expeditor-to-line cook ratio.

Marketing & Loyalty Operations
Run promotions like steak nights and seasonal menus to lift weekday traffic and capture occasion spend; 2024 industry benchmarks show loyalty members typically spend 15-20% more and visit more often. Leverage CRM for targeted offers and reactivation campaigns, produce social and email content highlighting steaks and ambiance, and track channel ROI to reallocate spend toward higher-performing tactics.
Facility & Compliance Management
Maintain kitchens, dining rooms, and decor to brand standards through routine audits and standardized checklists, ensuring consistent guest experience and minimizing brand risk.
Adhere to multi-state health, safety, and labor regulations, train staff on food safety and responsible alcohol service, and schedule preventive maintenance to reduce equipment breakdowns and costly downtime.
- Routine brand audits
- Regulatory compliance across states
- Food safety & alcohol training
- Scheduled preventive maintenance
Optimize ops: 28–35% food cost, 95% doneness, 4–8% LTO uplift
Optimize SKU mix to hit 28–35% food cost, standardize recipes for 95% doneness accuracy and 60–90s pass time, run quarterly vendor audits and LTO pilots targeting 4–8% incremental sales. Align weekly POS forecasts with 1–3 days safety stock to reduce shrink, and use CRM to drive loyalty (15–20% higher spend) and ~1.8 nightly table turns.
| Metric | Target/2024 |
|---|---|
| Food cost | 28–35% |
| Doneness accuracy | 95% |
| LTO uplift | 4–8% |
| Loyalty spend | 15–20% |
Full Version Awaits
Business Model Canvas
The Business Model Canvas previewed here for Black Angus Steakhouse is the exact document you’ll receive—no mockup, no condensed sample. When you purchase, you’ll download the complete, ready-to-edit file formatted exactly as shown, with all sections and content included for immediate use.

Steakhouse Business Model Canvas: Customers, Value & Revenue
Unlock the strategic blueprint behind Black Angus Steakhouse with our concise Business Model Canvas overview—detailing customer segments, value propositions, channels and revenue streams. Want the full, editable Canvas with SWOT-backed insights and financial implications? Download the complete Word & Excel package to apply or benchmark today.
Partnerships
Ranchers & Beef Suppliers
Secure relationships with reputable ranchers ensure consistent access to high-quality Angus beef and prime rib, typically sourcing through approved suppliers under 12–36 month agreements. Long-term contracts stabilize pricing and reduce supply volatility for core SKU procurement. Co-developing specs locks in cut, marbling, and aging standards and enables joint marketing highlighting traceability and animal welfare.
Seafood & Specialty Purveyors
Partnering with vetted seafood vendors ensures freshness and adherence to sustainability standards that 70% of diners said influenced purchases in 2024, supporting brand trust. Seasonal sourcing enables limited-time offers that historically lift traffic 5–8% and boost average check. Vendor QA programs can cut spoilage and returns by around 15–20%, improving gross margins. Collaborative forecasting aligns catch availability with menu planning, reducing stockouts by roughly 15%.
Beverage Distributors & Breweries
Beverage distributors and brewery partners secure a steady flow of wines, beers and spirits tailored to steak pairings, leveraging 2024 craft-beer trends (US craft share ~13% by volume, Brewers Association) to source limited-release taps that drive novelty and repeat visits. Volume pricing and rebates enhance beverage gross margins while co-op funds underwrite in-restaurant promotions and tasting events.
Delivery & Reservation Platforms
Delivery aggregators (DoorDash 56% US share, Uber Eats ~24% in 2024) expand off‑premise reach, smoothing demand variability and capturing ~one quarter of incremental sales for full‑service chains. Reservation partners raise table turns and guest‑flow visibility, while data‑sharing improves demand forecasting and enables targeted offers; joint campaigns typically lift off‑peak traffic by double digits.
- Aggregator reach: DoorDash 56%
- Reservation visibility: higher turns, fewer no‑shows
- Data sharing: better forecasting, targeted promos
- Joint campaigns: +10%+ off‑peak utilization
Landlords & Equipment Vendors
Favorable leases with tenant improvement allowances averaging $50–150 per sq ft in 2024 materially improve Black Angus unit economics by lowering upfront buildout costs. Kitchen equipment partners provide service-level agreements targeting 99% uptime, cutting downtime-related sales losses by ~20%. Coordinated maintenance and bulk purchasing reduced equipment capex by ~18% and lowered health-code risk through faster repairs.
- TI allowances: $50–150/sq ft (2024)
- SLA uptime: 99% — ~20% fewer downtime losses
- Bulk capex savings: ~18% on grills/ovens/refrigeration
Ranch deals secure supply; 15-20% spoilage, 18% capex cuts
Long-term contracts with ranchers (12–36 months) secure consistent Angus beef specs and price stability. Seafood, beverage and equipment partners cut spoilage and capex (~15–20% spoilage reduction; ~18% capex savings) while seasonal and co‑op promotions lift traffic 5–8%. Aggregators (DoorDash 56%, Uber Eats 24% 2024) and reservation partners expand off‑premise sales and improve forecasting.
| Partner | Metric | 2024 |
|---|---|---|
| Ranchers | Contract | 12–36 mo |
| Seafood | Purchase influence | 70% |
| Aggregators | Share | DoorDash 56%, Uber Eats 24% |
| Leases | TI | $50–150/sq ft |
What is included in the product
Detailed Word Document
A comprehensive Business Model Canvas for Black Angus Steakhouse outlining customer segments, value propositions, channels, revenue streams, key partners, activities, resources, cost structure and customer relationships in nine classic blocks; includes competitive advantages and linked SWOT analysis to support investor presentations and strategic decision-making.
Customizable Excel Spreadsheet
One-page editable Business Model Canvas for Black Angus Steakhouse that condenses strategy into a clean, shareable layout—saves hours formatting and helps teams quickly identify core components for brainstorming, boardrooms, or competitive comparison.
Activities
Menu Engineering & QA
Analyze item mix, margins and prep complexity to shift SKUs toward higher-contribution dishes, targeting industry food-cost bands of 28–35% to lift gross margin; 2024 benchmarking shows full-service concepts focus on mix optimization to improve profitability. Standardize recipes and cooking specs to reduce variance and speed ticket times. Pilot limited-time offerings to test demand and seasonality, aiming for 4–8% incremental sales per LTO. Conduct vendor and product audits quarterly to sustain quality and control cost.
Procurement & Inventory Control
Forecast weekly and seasonal demand using POS trends to align orders with sales patterns and avoid stockouts, targeting a restaurant food cost near 30% as industry benchmarks in 2024 suggest. Implement FIFO, batch tracking and waste logs to reduce shrink and improve gross margin. Maintain 1–3 days safety stock for high-velocity SKUs and negotiate fixed pricing and delivery windows to stabilize COGS and reduce variability.
Culinary Execution & Service
Ensure precise steak doneness with a target 95% accuracy and standardized plating within a 60–90 second pass window to maintain consistency at scale. Deliver hospitable table service aligned to casual dining norms with average check & service cadence monitoring; aim for ~1.8 table turns per evening without eroding experience. Handle peaks via expo coordination and line balancing, sustaining throughput with a 1:4 expeditor-to-line cook ratio.
Marketing & Loyalty Operations
Run promotions like steak nights and seasonal menus to lift weekday traffic and capture occasion spend; 2024 industry benchmarks show loyalty members typically spend 15-20% more and visit more often. Leverage CRM for targeted offers and reactivation campaigns, produce social and email content highlighting steaks and ambiance, and track channel ROI to reallocate spend toward higher-performing tactics.
Facility & Compliance Management
Maintain kitchens, dining rooms, and decor to brand standards through routine audits and standardized checklists, ensuring consistent guest experience and minimizing brand risk.
Adhere to multi-state health, safety, and labor regulations, train staff on food safety and responsible alcohol service, and schedule preventive maintenance to reduce equipment breakdowns and costly downtime.
- Routine brand audits
- Regulatory compliance across states
- Food safety & alcohol training
- Scheduled preventive maintenance
Optimize ops: 28–35% food cost, 95% doneness, 4–8% LTO uplift
Optimize SKU mix to hit 28–35% food cost, standardize recipes for 95% doneness accuracy and 60–90s pass time, run quarterly vendor audits and LTO pilots targeting 4–8% incremental sales. Align weekly POS forecasts with 1–3 days safety stock to reduce shrink, and use CRM to drive loyalty (15–20% higher spend) and ~1.8 nightly table turns.
| Metric | Target/2024 |
|---|---|
| Food cost | 28–35% |
| Doneness accuracy | 95% |
| LTO uplift | 4–8% |
| Loyalty spend | 15–20% |
Full Version Awaits
Business Model Canvas
The Business Model Canvas previewed here for Black Angus Steakhouse is the exact document you’ll receive—no mockup, no condensed sample. When you purchase, you’ll download the complete, ready-to-edit file formatted exactly as shown, with all sections and content included for immediate use.
Original: $10.00
-65%$10.00
$3.50Description
Steakhouse Business Model Canvas: Customers, Value & Revenue
Unlock the strategic blueprint behind Black Angus Steakhouse with our concise Business Model Canvas overview—detailing customer segments, value propositions, channels and revenue streams. Want the full, editable Canvas with SWOT-backed insights and financial implications? Download the complete Word & Excel package to apply or benchmark today.
Partnerships
Ranchers & Beef Suppliers
Secure relationships with reputable ranchers ensure consistent access to high-quality Angus beef and prime rib, typically sourcing through approved suppliers under 12–36 month agreements. Long-term contracts stabilize pricing and reduce supply volatility for core SKU procurement. Co-developing specs locks in cut, marbling, and aging standards and enables joint marketing highlighting traceability and animal welfare.
Seafood & Specialty Purveyors
Partnering with vetted seafood vendors ensures freshness and adherence to sustainability standards that 70% of diners said influenced purchases in 2024, supporting brand trust. Seasonal sourcing enables limited-time offers that historically lift traffic 5–8% and boost average check. Vendor QA programs can cut spoilage and returns by around 15–20%, improving gross margins. Collaborative forecasting aligns catch availability with menu planning, reducing stockouts by roughly 15%.
Beverage Distributors & Breweries
Beverage distributors and brewery partners secure a steady flow of wines, beers and spirits tailored to steak pairings, leveraging 2024 craft-beer trends (US craft share ~13% by volume, Brewers Association) to source limited-release taps that drive novelty and repeat visits. Volume pricing and rebates enhance beverage gross margins while co-op funds underwrite in-restaurant promotions and tasting events.
Delivery & Reservation Platforms
Delivery aggregators (DoorDash 56% US share, Uber Eats ~24% in 2024) expand off‑premise reach, smoothing demand variability and capturing ~one quarter of incremental sales for full‑service chains. Reservation partners raise table turns and guest‑flow visibility, while data‑sharing improves demand forecasting and enables targeted offers; joint campaigns typically lift off‑peak traffic by double digits.
- Aggregator reach: DoorDash 56%
- Reservation visibility: higher turns, fewer no‑shows
- Data sharing: better forecasting, targeted promos
- Joint campaigns: +10%+ off‑peak utilization
Landlords & Equipment Vendors
Favorable leases with tenant improvement allowances averaging $50–150 per sq ft in 2024 materially improve Black Angus unit economics by lowering upfront buildout costs. Kitchen equipment partners provide service-level agreements targeting 99% uptime, cutting downtime-related sales losses by ~20%. Coordinated maintenance and bulk purchasing reduced equipment capex by ~18% and lowered health-code risk through faster repairs.
- TI allowances: $50–150/sq ft (2024)
- SLA uptime: 99% — ~20% fewer downtime losses
- Bulk capex savings: ~18% on grills/ovens/refrigeration
Ranch deals secure supply; 15-20% spoilage, 18% capex cuts
Long-term contracts with ranchers (12–36 months) secure consistent Angus beef specs and price stability. Seafood, beverage and equipment partners cut spoilage and capex (~15–20% spoilage reduction; ~18% capex savings) while seasonal and co‑op promotions lift traffic 5–8%. Aggregators (DoorDash 56%, Uber Eats 24% 2024) and reservation partners expand off‑premise sales and improve forecasting.
| Partner | Metric | 2024 |
|---|---|---|
| Ranchers | Contract | 12–36 mo |
| Seafood | Purchase influence | 70% |
| Aggregators | Share | DoorDash 56%, Uber Eats 24% |
| Leases | TI | $50–150/sq ft |
What is included in the product
Detailed Word Document
A comprehensive Business Model Canvas for Black Angus Steakhouse outlining customer segments, value propositions, channels, revenue streams, key partners, activities, resources, cost structure and customer relationships in nine classic blocks; includes competitive advantages and linked SWOT analysis to support investor presentations and strategic decision-making.
Customizable Excel Spreadsheet
One-page editable Business Model Canvas for Black Angus Steakhouse that condenses strategy into a clean, shareable layout—saves hours formatting and helps teams quickly identify core components for brainstorming, boardrooms, or competitive comparison.
Activities
Menu Engineering & QA
Analyze item mix, margins and prep complexity to shift SKUs toward higher-contribution dishes, targeting industry food-cost bands of 28–35% to lift gross margin; 2024 benchmarking shows full-service concepts focus on mix optimization to improve profitability. Standardize recipes and cooking specs to reduce variance and speed ticket times. Pilot limited-time offerings to test demand and seasonality, aiming for 4–8% incremental sales per LTO. Conduct vendor and product audits quarterly to sustain quality and control cost.
Procurement & Inventory Control
Forecast weekly and seasonal demand using POS trends to align orders with sales patterns and avoid stockouts, targeting a restaurant food cost near 30% as industry benchmarks in 2024 suggest. Implement FIFO, batch tracking and waste logs to reduce shrink and improve gross margin. Maintain 1–3 days safety stock for high-velocity SKUs and negotiate fixed pricing and delivery windows to stabilize COGS and reduce variability.
Culinary Execution & Service
Ensure precise steak doneness with a target 95% accuracy and standardized plating within a 60–90 second pass window to maintain consistency at scale. Deliver hospitable table service aligned to casual dining norms with average check & service cadence monitoring; aim for ~1.8 table turns per evening without eroding experience. Handle peaks via expo coordination and line balancing, sustaining throughput with a 1:4 expeditor-to-line cook ratio.
Marketing & Loyalty Operations
Run promotions like steak nights and seasonal menus to lift weekday traffic and capture occasion spend; 2024 industry benchmarks show loyalty members typically spend 15-20% more and visit more often. Leverage CRM for targeted offers and reactivation campaigns, produce social and email content highlighting steaks and ambiance, and track channel ROI to reallocate spend toward higher-performing tactics.
Facility & Compliance Management
Maintain kitchens, dining rooms, and decor to brand standards through routine audits and standardized checklists, ensuring consistent guest experience and minimizing brand risk.
Adhere to multi-state health, safety, and labor regulations, train staff on food safety and responsible alcohol service, and schedule preventive maintenance to reduce equipment breakdowns and costly downtime.
- Routine brand audits
- Regulatory compliance across states
- Food safety & alcohol training
- Scheduled preventive maintenance
Optimize ops: 28–35% food cost, 95% doneness, 4–8% LTO uplift
Optimize SKU mix to hit 28–35% food cost, standardize recipes for 95% doneness accuracy and 60–90s pass time, run quarterly vendor audits and LTO pilots targeting 4–8% incremental sales. Align weekly POS forecasts with 1–3 days safety stock to reduce shrink, and use CRM to drive loyalty (15–20% higher spend) and ~1.8 nightly table turns.
| Metric | Target/2024 |
|---|---|
| Food cost | 28–35% |
| Doneness accuracy | 95% |
| LTO uplift | 4–8% |
| Loyalty spend | 15–20% |
Full Version Awaits
Business Model Canvas
The Business Model Canvas previewed here for Black Angus Steakhouse is the exact document you’ll receive—no mockup, no condensed sample. When you purchase, you’ll download the complete, ready-to-edit file formatted exactly as shown, with all sections and content included for immediate use.











