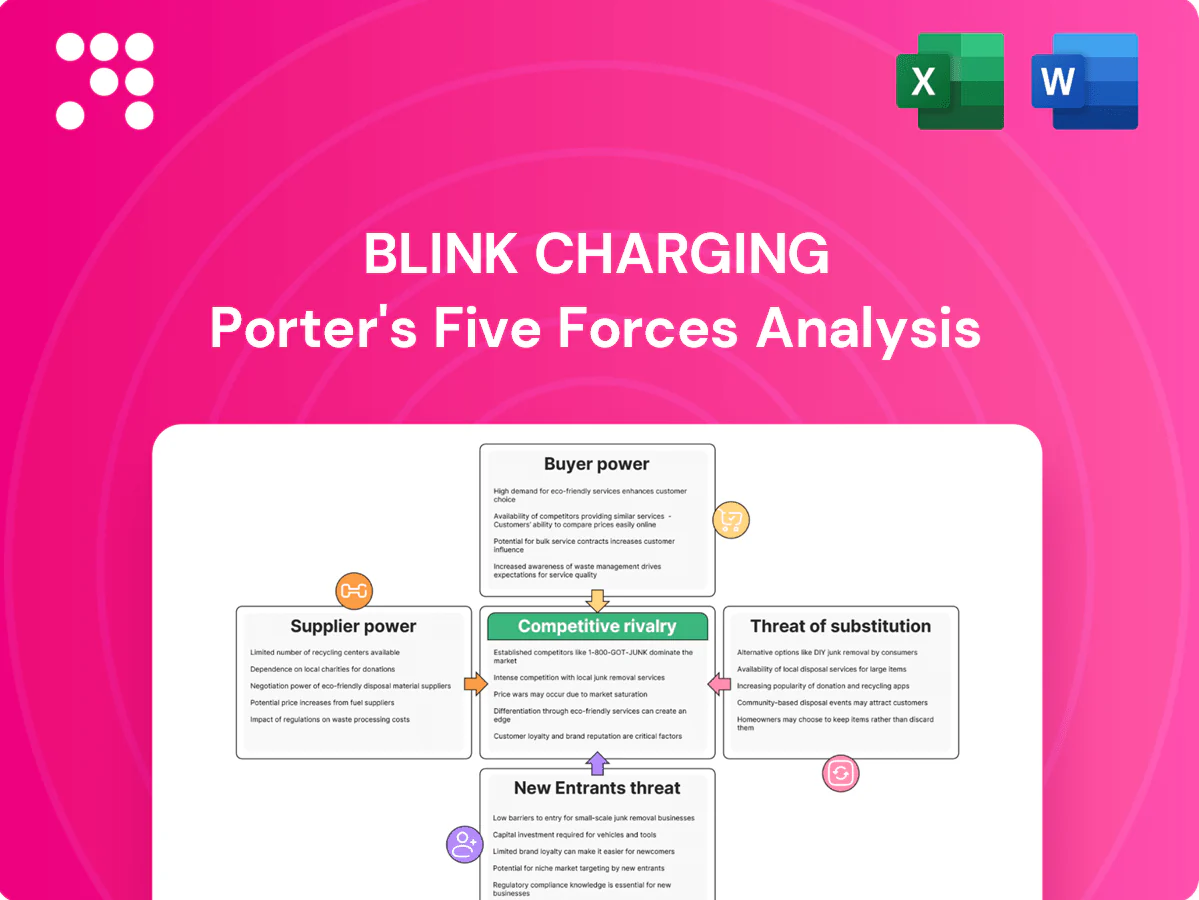
Blink Charging Porter's Five Forces Analysis

From Overview to Strategy Blueprint
Blink Charging faces intense competitive dynamics from established EV charging networks and new entrants, while supplier leverage over key components and evolving buyer expectations shape margins and pricing power. Substitute threats and regulatory shifts add layers of uncertainty to growth forecasts. This brief snapshot only scratches the surface—unlock the full Porter's Five Forces Analysis for force-by-force ratings, visuals, and actionable strategy insights.
Suppliers Bargaining Power

Concentrated power-electronics vendors
Core components such as power modules, semiconductors, and high-capacity rectifiers are sourced from a limited set of global suppliers, and with the global semiconductor market exceeding 500 billion dollars in 2024 this concentration raises switching costs and lead-time risk for Blink. Supply tightness can drive higher component prices and disrupt delivery schedules, while dual-sourcing and design-for-substitution lower but do not eliminate exposure.
Utility and grid dependence
Utilities wield local monopoly control over interconnection, transformer capacity and tariffs, with interconnection timelines commonly 3–12 months and upgrade costs often from about $10,000 to $200,000 for DC fast sites. DC fast charger energization timelines and unpredictable upgrade fees create capital deployment risk. Demand charges can account for roughly 30–60% of commercial charging bills, compressing Blink’s margins and delaying station revenue realization.

Installation and EPC contractors
Skilled civil, electrical and permitting labor is regionally constrained; industry surveys show about 80% of contractors reported hiring difficulty in 2023–24, letting installers command 10–25% premiums and scheduling priority. Installer competence directly impacts Blink uptime and warranty costs, and while Blink’s preferred-partner network reduces variability, capacity bottlenecks persisted through 2024, slowing deployments.

Software and firmware dependencies
Embedded firmware, networking modules, and OCPP stacks for Blink Charging often come from specialized third parties, creating integration lock-in that heightens bargaining power for niche vendors. Security and compliance updates are ongoing obligations that maintain dependency and can increase maintenance costs and timing risk. Blink's strategy to internalize more of the stack reduces but does not eliminate supplier leverage, especially for proprietary modules and certified security components.
- Third-party firmware: integration lock-in raises supplier power
- Ongoing security/compliance updates: recurring dependency and cost
- Internalization: lowers but does not remove vendor leverage
- Market note 2024: large EV networks prioritize certified modules for compliance
Hardware OEMs and ODMs
Reliance on contract OEMs/ODMs exposes Blink to MOQs (often 1,000+ units) and third‑party capacity allocation that can delay ramping specific models.
Currency swings and 2024 logistics dynamics — container spot rates roughly 30% below 2021 peaks — can be passed through to hardware costs.
Custom tooling raises switching friction; volume commitments secure better pricing but increase inventory and obsolescence risk.
- MOQ exposure: 1,000+ units
- Logistics: 2024 container rates ~30% below 2021 peaks
- Tooling friction: high switching cost
- Volume deals: better terms vs inventory risk
Supplier concentration, interconnection monopsony and 80% installer scarcity boost deployment risk
Blink faces concentrated hardware and semiconductor suppliers (global semiconductors >500B in 2024) plus utility interconnection monopsony (3–12 month timelines; upgrades $10k–$200k), raising switching costs and deployment risk. Skilled installer scarcity (≈80% hiring difficulty 2023–24) and OEM MOQs (~1,000+ units) further strengthen supplier power while internalization reduces but does not remove leverage.
| Metric | 2024 Value |
|---|---|
| Semiconductor market | >$500B |
| Interconnection timeline | 3–12 months |
| Upgrade cost | $10k–$200k |
| Demand charges | 30–60% |
| Contractor hiring difficulty | ≈80% |
| MOQ | 1,000+ units |
| Container rates vs 2021 | ≈-30% |
What is included in the product
 Detailed Word Document
Tailored analysis of Blink Charging's competitive landscape that uncovers key drivers of rivalry, customer influence, supplier power, and market entry risks. Identifies disruptive threats, substitute technologies, and strategic levers that affect pricing, profitability, and growth potential.

 Customizable Excel Spreadsheet
A clear, one-sheet Porter’s Five Forces for Blink Charging that distills competitive pressures and strategic gaps—relieving analysis overload and ready to drop into pitch decks or boardroom slides.
Customers Bargaining Power

Site hosts with multi-bid RFPs
Property owners, municipalities and fleets run competitive multi-bid RFPs that force Blink to compete on price and contract terms; Blink reported approximately $87 million revenue in 2023, highlighting sensitivity to large tender outcomes. Comparable hardware specs and open OCPP protocols make vendor comparison straightforward, intensifying buyer leverage. Buyers often demand revenue shares or installation subsidies, pressuring margins. Blink must instead win on lower TCO, >99% uptime targets and strict service SLAs.
Low technical switching costs
OCPP and the rise of standard connectors—NACS (opened by Tesla in Nov 2022) and CCS—significantly lower technical switching costs and reduce vendor lock-in, enabling site hosts to migrate networks with limited retrofits. This interoperability elevates buyer leverage during renewals, pressuring pricing and service terms. Long-term service contracts, commonly 3–5 years, partially counterbalance churn risk by locking in revenue and support commitments.

Scale buyers negotiate hard
Fleet operators and large REITs extract steep volume discounts and bespoke SLAs from Blink Charging, as high utilization from fleets makes station economics highly sensitive to price and uptime; vendors therefore compete aggressively for these contracts. Consolidated purchasing by fleets and portfolio landlords boosts customer bargaining power, and landing a few anchor clients often establishes market pricing precedents that other buyers demand.

Sensitivity to uptime and ROI
Hosts prioritize reliable uptime and predictable payback over feature sets; by 2024 many commercial hosts target 99%+ station uptime and favor providers offering clear ROI timelines. Poor performance frequently triggers credits, penalties or contract termination, and buyers increasingly demand explicit performance guarantees. Those guarantees shift uptime, warranty and operational risk — and thus margin compression — onto the vendor.
- 2024 uptime target: 99%+
- Common remedies: credits, penalties, termination
- Effect: risk and margin shifted to vendor
Access to incentives
Public subsidies (NEVI program $5 billion) and IRA EV tax credits up to $7,500 are often routed through site hosts, letting buyers demand lower net pricing; grant eligibility becomes a negotiating lever and limited funding windows create timing pressure. Vendors like Blink must co-manage applications and incentive paperwork to close deals and mitigate buyer bargaining power.
- Host-routed subsidies increase buyer leverage
- NEVI $5B and IRA $7,500 amplify discount demands
- Funding windows = timing leverage
- Vendor success requires co-managing applications
Buyers wield leverage: interoperability, NEVI $5B and up to $7,500 IRA credits pressure margins
Customers wield strong leverage via competitive RFPs and volume deals—Blink reported $87M revenue in 2023, so large tenders materially affect results. OCPP and NACS/CCS interoperability lower switching costs, enabling host migration and tougher renewals. Hosts demand 99%+ uptime, revenue shares and subsidies, shifting risk and compressing vendor margins. NEVI $5B and IRA credits (up to $7,500) amplify buyer bargaining power.
| Metric | Value |
|---|---|
| Blink revenue (2023) | $87M |
| Host uptime target (2024) | 99%+ |
| NEVI funding | $5B |
| IRA EV tax credit | Up to $7,500 |
Preview Before You Purchase
Blink Charging Porter's Five Forces Analysis
This preview shows the complete Porter’s Five Forces analysis of Blink Charging and is the exact document you will receive upon purchase. It contains porter-specific evaluation of competitive rivalry, supplier and buyer power, threat of entrants and substitutes. The file is fully formatted and ready for immediate download—no placeholders, no samples.

From Overview to Strategy Blueprint
Blink Charging faces intense competitive dynamics from established EV charging networks and new entrants, while supplier leverage over key components and evolving buyer expectations shape margins and pricing power. Substitute threats and regulatory shifts add layers of uncertainty to growth forecasts. This brief snapshot only scratches the surface—unlock the full Porter's Five Forces Analysis for force-by-force ratings, visuals, and actionable strategy insights.
Suppliers Bargaining Power
Concentrated power-electronics vendors
Core components such as power modules, semiconductors, and high-capacity rectifiers are sourced from a limited set of global suppliers, and with the global semiconductor market exceeding 500 billion dollars in 2024 this concentration raises switching costs and lead-time risk for Blink. Supply tightness can drive higher component prices and disrupt delivery schedules, while dual-sourcing and design-for-substitution lower but do not eliminate exposure.
Utility and grid dependence
Utilities wield local monopoly control over interconnection, transformer capacity and tariffs, with interconnection timelines commonly 3–12 months and upgrade costs often from about $10,000 to $200,000 for DC fast sites. DC fast charger energization timelines and unpredictable upgrade fees create capital deployment risk. Demand charges can account for roughly 30–60% of commercial charging bills, compressing Blink’s margins and delaying station revenue realization.
Installation and EPC contractors
Skilled civil, electrical and permitting labor is regionally constrained; industry surveys show about 80% of contractors reported hiring difficulty in 2023–24, letting installers command 10–25% premiums and scheduling priority. Installer competence directly impacts Blink uptime and warranty costs, and while Blink’s preferred-partner network reduces variability, capacity bottlenecks persisted through 2024, slowing deployments.
Software and firmware dependencies
Embedded firmware, networking modules, and OCPP stacks for Blink Charging often come from specialized third parties, creating integration lock-in that heightens bargaining power for niche vendors. Security and compliance updates are ongoing obligations that maintain dependency and can increase maintenance costs and timing risk. Blink's strategy to internalize more of the stack reduces but does not eliminate supplier leverage, especially for proprietary modules and certified security components.
- Third-party firmware: integration lock-in raises supplier power
- Ongoing security/compliance updates: recurring dependency and cost
- Internalization: lowers but does not remove vendor leverage
- Market note 2024: large EV networks prioritize certified modules for compliance
Hardware OEMs and ODMs
Reliance on contract OEMs/ODMs exposes Blink to MOQs (often 1,000+ units) and third‑party capacity allocation that can delay ramping specific models.
Currency swings and 2024 logistics dynamics — container spot rates roughly 30% below 2021 peaks — can be passed through to hardware costs.
Custom tooling raises switching friction; volume commitments secure better pricing but increase inventory and obsolescence risk.
- MOQ exposure: 1,000+ units
- Logistics: 2024 container rates ~30% below 2021 peaks
- Tooling friction: high switching cost
- Volume deals: better terms vs inventory risk
Supplier concentration, interconnection monopsony and 80% installer scarcity boost deployment risk
Blink faces concentrated hardware and semiconductor suppliers (global semiconductors >500B in 2024) plus utility interconnection monopsony (3–12 month timelines; upgrades $10k–$200k), raising switching costs and deployment risk. Skilled installer scarcity (≈80% hiring difficulty 2023–24) and OEM MOQs (~1,000+ units) further strengthen supplier power while internalization reduces but does not remove leverage.
| Metric | 2024 Value |
|---|---|
| Semiconductor market | >$500B |
| Interconnection timeline | 3–12 months |
| Upgrade cost | $10k–$200k |
| Demand charges | 30–60% |
| Contractor hiring difficulty | ≈80% |
| MOQ | 1,000+ units |
| Container rates vs 2021 | ≈-30% |
What is included in the product
Detailed Word Document
Tailored analysis of Blink Charging's competitive landscape that uncovers key drivers of rivalry, customer influence, supplier power, and market entry risks. Identifies disruptive threats, substitute technologies, and strategic levers that affect pricing, profitability, and growth potential.
Customizable Excel Spreadsheet
A clear, one-sheet Porter’s Five Forces for Blink Charging that distills competitive pressures and strategic gaps—relieving analysis overload and ready to drop into pitch decks or boardroom slides.
Customers Bargaining Power
Site hosts with multi-bid RFPs
Property owners, municipalities and fleets run competitive multi-bid RFPs that force Blink to compete on price and contract terms; Blink reported approximately $87 million revenue in 2023, highlighting sensitivity to large tender outcomes. Comparable hardware specs and open OCPP protocols make vendor comparison straightforward, intensifying buyer leverage. Buyers often demand revenue shares or installation subsidies, pressuring margins. Blink must instead win on lower TCO, >99% uptime targets and strict service SLAs.
Low technical switching costs
OCPP and the rise of standard connectors—NACS (opened by Tesla in Nov 2022) and CCS—significantly lower technical switching costs and reduce vendor lock-in, enabling site hosts to migrate networks with limited retrofits. This interoperability elevates buyer leverage during renewals, pressuring pricing and service terms. Long-term service contracts, commonly 3–5 years, partially counterbalance churn risk by locking in revenue and support commitments.
Scale buyers negotiate hard
Fleet operators and large REITs extract steep volume discounts and bespoke SLAs from Blink Charging, as high utilization from fleets makes station economics highly sensitive to price and uptime; vendors therefore compete aggressively for these contracts. Consolidated purchasing by fleets and portfolio landlords boosts customer bargaining power, and landing a few anchor clients often establishes market pricing precedents that other buyers demand.
Sensitivity to uptime and ROI
Hosts prioritize reliable uptime and predictable payback over feature sets; by 2024 many commercial hosts target 99%+ station uptime and favor providers offering clear ROI timelines. Poor performance frequently triggers credits, penalties or contract termination, and buyers increasingly demand explicit performance guarantees. Those guarantees shift uptime, warranty and operational risk — and thus margin compression — onto the vendor.
- 2024 uptime target: 99%+
- Common remedies: credits, penalties, termination
- Effect: risk and margin shifted to vendor
Access to incentives
Public subsidies (NEVI program $5 billion) and IRA EV tax credits up to $7,500 are often routed through site hosts, letting buyers demand lower net pricing; grant eligibility becomes a negotiating lever and limited funding windows create timing pressure. Vendors like Blink must co-manage applications and incentive paperwork to close deals and mitigate buyer bargaining power.
- Host-routed subsidies increase buyer leverage
- NEVI $5B and IRA $7,500 amplify discount demands
- Funding windows = timing leverage
- Vendor success requires co-managing applications
Buyers wield leverage: interoperability, NEVI $5B and up to $7,500 IRA credits pressure margins
Customers wield strong leverage via competitive RFPs and volume deals—Blink reported $87M revenue in 2023, so large tenders materially affect results. OCPP and NACS/CCS interoperability lower switching costs, enabling host migration and tougher renewals. Hosts demand 99%+ uptime, revenue shares and subsidies, shifting risk and compressing vendor margins. NEVI $5B and IRA credits (up to $7,500) amplify buyer bargaining power.
| Metric | Value |
|---|---|
| Blink revenue (2023) | $87M |
| Host uptime target (2024) | 99%+ |
| NEVI funding | $5B |
| IRA EV tax credit | Up to $7,500 |
Preview Before You Purchase
Blink Charging Porter's Five Forces Analysis
This preview shows the complete Porter’s Five Forces analysis of Blink Charging and is the exact document you will receive upon purchase. It contains porter-specific evaluation of competitive rivalry, supplier and buyer power, threat of entrants and substitutes. The file is fully formatted and ready for immediate download—no placeholders, no samples.
Original: $10.00
-65%$10.00
$3.50Description
From Overview to Strategy Blueprint
Blink Charging faces intense competitive dynamics from established EV charging networks and new entrants, while supplier leverage over key components and evolving buyer expectations shape margins and pricing power. Substitute threats and regulatory shifts add layers of uncertainty to growth forecasts. This brief snapshot only scratches the surface—unlock the full Porter's Five Forces Analysis for force-by-force ratings, visuals, and actionable strategy insights.
Suppliers Bargaining Power
Concentrated power-electronics vendors
Core components such as power modules, semiconductors, and high-capacity rectifiers are sourced from a limited set of global suppliers, and with the global semiconductor market exceeding 500 billion dollars in 2024 this concentration raises switching costs and lead-time risk for Blink. Supply tightness can drive higher component prices and disrupt delivery schedules, while dual-sourcing and design-for-substitution lower but do not eliminate exposure.
Utility and grid dependence
Utilities wield local monopoly control over interconnection, transformer capacity and tariffs, with interconnection timelines commonly 3–12 months and upgrade costs often from about $10,000 to $200,000 for DC fast sites. DC fast charger energization timelines and unpredictable upgrade fees create capital deployment risk. Demand charges can account for roughly 30–60% of commercial charging bills, compressing Blink’s margins and delaying station revenue realization.
Installation and EPC contractors
Skilled civil, electrical and permitting labor is regionally constrained; industry surveys show about 80% of contractors reported hiring difficulty in 2023–24, letting installers command 10–25% premiums and scheduling priority. Installer competence directly impacts Blink uptime and warranty costs, and while Blink’s preferred-partner network reduces variability, capacity bottlenecks persisted through 2024, slowing deployments.
Software and firmware dependencies
Embedded firmware, networking modules, and OCPP stacks for Blink Charging often come from specialized third parties, creating integration lock-in that heightens bargaining power for niche vendors. Security and compliance updates are ongoing obligations that maintain dependency and can increase maintenance costs and timing risk. Blink's strategy to internalize more of the stack reduces but does not eliminate supplier leverage, especially for proprietary modules and certified security components.
- Third-party firmware: integration lock-in raises supplier power
- Ongoing security/compliance updates: recurring dependency and cost
- Internalization: lowers but does not remove vendor leverage
- Market note 2024: large EV networks prioritize certified modules for compliance
Hardware OEMs and ODMs
Reliance on contract OEMs/ODMs exposes Blink to MOQs (often 1,000+ units) and third‑party capacity allocation that can delay ramping specific models.
Currency swings and 2024 logistics dynamics — container spot rates roughly 30% below 2021 peaks — can be passed through to hardware costs.
Custom tooling raises switching friction; volume commitments secure better pricing but increase inventory and obsolescence risk.
- MOQ exposure: 1,000+ units
- Logistics: 2024 container rates ~30% below 2021 peaks
- Tooling friction: high switching cost
- Volume deals: better terms vs inventory risk
Supplier concentration, interconnection monopsony and 80% installer scarcity boost deployment risk
Blink faces concentrated hardware and semiconductor suppliers (global semiconductors >500B in 2024) plus utility interconnection monopsony (3–12 month timelines; upgrades $10k–$200k), raising switching costs and deployment risk. Skilled installer scarcity (≈80% hiring difficulty 2023–24) and OEM MOQs (~1,000+ units) further strengthen supplier power while internalization reduces but does not remove leverage.
| Metric | 2024 Value |
|---|---|
| Semiconductor market | >$500B |
| Interconnection timeline | 3–12 months |
| Upgrade cost | $10k–$200k |
| Demand charges | 30–60% |
| Contractor hiring difficulty | ≈80% |
| MOQ | 1,000+ units |
| Container rates vs 2021 | ≈-30% |
What is included in the product
Detailed Word Document
Tailored analysis of Blink Charging's competitive landscape that uncovers key drivers of rivalry, customer influence, supplier power, and market entry risks. Identifies disruptive threats, substitute technologies, and strategic levers that affect pricing, profitability, and growth potential.
Customizable Excel Spreadsheet
A clear, one-sheet Porter’s Five Forces for Blink Charging that distills competitive pressures and strategic gaps—relieving analysis overload and ready to drop into pitch decks or boardroom slides.
Customers Bargaining Power
Site hosts with multi-bid RFPs
Property owners, municipalities and fleets run competitive multi-bid RFPs that force Blink to compete on price and contract terms; Blink reported approximately $87 million revenue in 2023, highlighting sensitivity to large tender outcomes. Comparable hardware specs and open OCPP protocols make vendor comparison straightforward, intensifying buyer leverage. Buyers often demand revenue shares or installation subsidies, pressuring margins. Blink must instead win on lower TCO, >99% uptime targets and strict service SLAs.
Low technical switching costs
OCPP and the rise of standard connectors—NACS (opened by Tesla in Nov 2022) and CCS—significantly lower technical switching costs and reduce vendor lock-in, enabling site hosts to migrate networks with limited retrofits. This interoperability elevates buyer leverage during renewals, pressuring pricing and service terms. Long-term service contracts, commonly 3–5 years, partially counterbalance churn risk by locking in revenue and support commitments.
Scale buyers negotiate hard
Fleet operators and large REITs extract steep volume discounts and bespoke SLAs from Blink Charging, as high utilization from fleets makes station economics highly sensitive to price and uptime; vendors therefore compete aggressively for these contracts. Consolidated purchasing by fleets and portfolio landlords boosts customer bargaining power, and landing a few anchor clients often establishes market pricing precedents that other buyers demand.
Sensitivity to uptime and ROI
Hosts prioritize reliable uptime and predictable payback over feature sets; by 2024 many commercial hosts target 99%+ station uptime and favor providers offering clear ROI timelines. Poor performance frequently triggers credits, penalties or contract termination, and buyers increasingly demand explicit performance guarantees. Those guarantees shift uptime, warranty and operational risk — and thus margin compression — onto the vendor.
- 2024 uptime target: 99%+
- Common remedies: credits, penalties, termination
- Effect: risk and margin shifted to vendor
Access to incentives
Public subsidies (NEVI program $5 billion) and IRA EV tax credits up to $7,500 are often routed through site hosts, letting buyers demand lower net pricing; grant eligibility becomes a negotiating lever and limited funding windows create timing pressure. Vendors like Blink must co-manage applications and incentive paperwork to close deals and mitigate buyer bargaining power.
- Host-routed subsidies increase buyer leverage
- NEVI $5B and IRA $7,500 amplify discount demands
- Funding windows = timing leverage
- Vendor success requires co-managing applications
Buyers wield leverage: interoperability, NEVI $5B and up to $7,500 IRA credits pressure margins
Customers wield strong leverage via competitive RFPs and volume deals—Blink reported $87M revenue in 2023, so large tenders materially affect results. OCPP and NACS/CCS interoperability lower switching costs, enabling host migration and tougher renewals. Hosts demand 99%+ uptime, revenue shares and subsidies, shifting risk and compressing vendor margins. NEVI $5B and IRA credits (up to $7,500) amplify buyer bargaining power.
| Metric | Value |
|---|---|
| Blink revenue (2023) | $87M |
| Host uptime target (2024) | 99%+ |
| NEVI funding | $5B |
| IRA EV tax credit | Up to $7,500 |
Preview Before You Purchase
Blink Charging Porter's Five Forces Analysis
This preview shows the complete Porter’s Five Forces analysis of Blink Charging and is the exact document you will receive upon purchase. It contains porter-specific evaluation of competitive rivalry, supplier and buyer power, threat of entrants and substitutes. The file is fully formatted and ready for immediate download—no placeholders, no samples.











