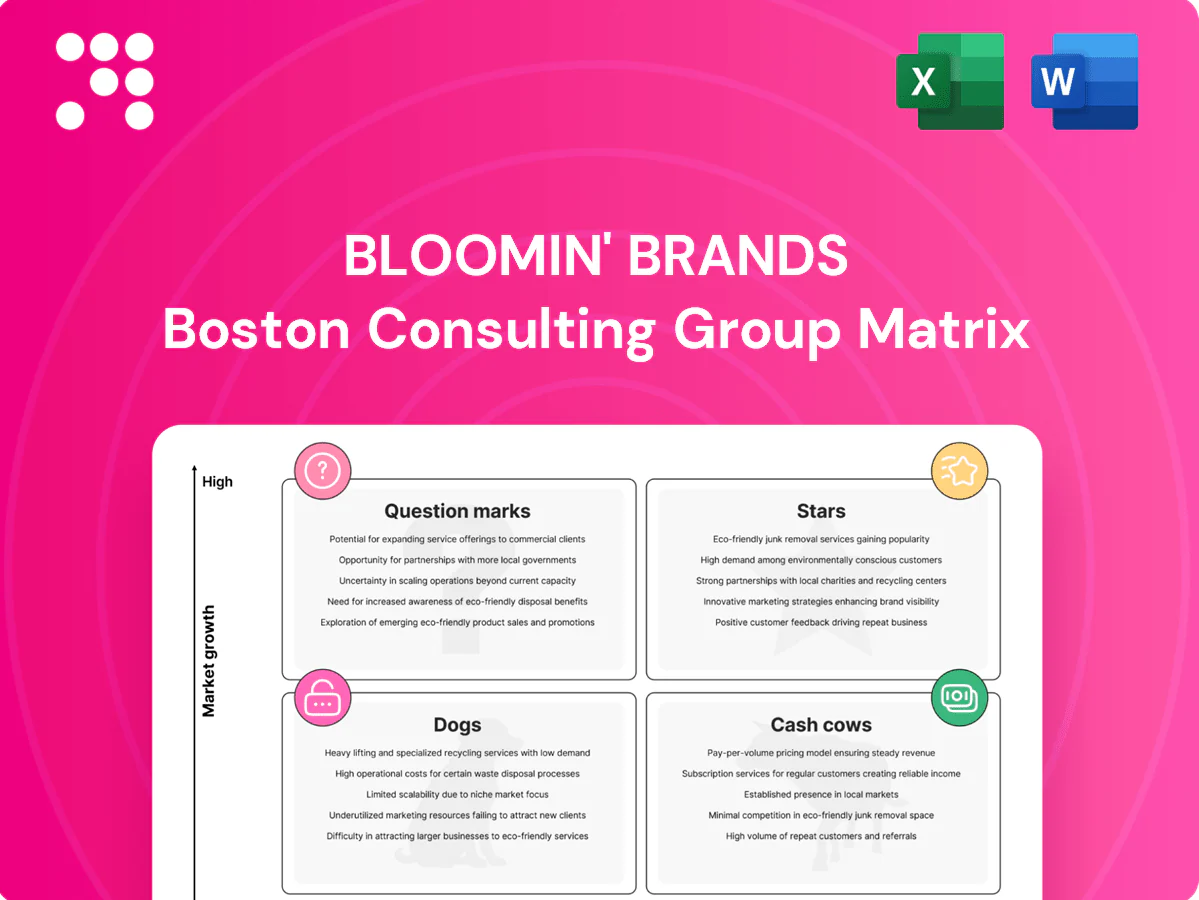
Bloomin' Brands Boston Consulting Group Matrix

Unlock Strategic Clarity
Quick snapshot: Bloomin' Brands’ BCG Matrix highlights which restaurant concepts are pulling market share and which are bleeding cash—useful, but limited. Buy the full BCG Matrix for quadrant-by-quadrant placements, data-backed recommendations, and a ready-to-present Word + Excel pack. Skip the guesswork—get strategic clarity and an action plan you can use right away.
Stars

Outback international growth
Outback holds strong brand recognition and is expanding in faster-growing international markets, operating in 23 countries and leveraging Bloomin' Brands' global platform. This mix positions Outback as a leader where demand is expanding, driving unit growth and market share gains. It requires capital for new stores, marketing, and supply chain investments. Continued investment can allow Outback to mature into a broad cash engine as growth normalizes.
Digital ordering + off‑premise
Off‑premise is outpacing dine‑in industrywide, now representing over half of occasions, and Bloomin' Brands' ~1,300‑unit scale gives Outback a distribution edge. High adoption, frequency, and improving unit economics are pushing share higher, but UX, delivery partnerships and ops still require spend. Fund it — it drives immediate volume and can mature into a stable cash cow.

Loyalty and CRM flywheel
Repeat diners compound quickly in casual dining when you personalize offers at scale; Bloomin' Brands leverages a loyalty base of about 28 million members and reported roughly 31% digital mix in recent trading updates, pushing share in a growing digital market. It consumes roughly $150m–$200m annually in tech and rewards to scale personalization and retention. Worth it — defend the lead and widen the moat.

Catering and group occasions
Catering and group occasions are rebounding from a small base, and Bloomin' Brands—with ~1,400 restaurants—can capture share where kitchen capacity and brand trust matter most; success requires targeted sales activation and dedicated packaging investment to convert enterprise accounts. Lean in now to lock long-term contracts before competitors scale.
Fleming’s in growth corridors
Fleming’s premium-steak concept is outperforming in select Sunbelt and affluent nodes, driven by strong brand equity and average checks near $95 in 2024, capturing outsized share where demand is rising.
Scaling requires targeted capex and specialized service training; selective investment can convert these growth boxes into durable cash generators for Bloomin' Brands.
- Locations: ~63 (2024)
- Avg check: ~$95 (2024)
- Strategy: selective capex + service training
Casual-dining leader: ~1,300 units, 23 countries, 28M loyalty, off-premise >50%
Outback and Off‑premise are Stars: Outback (23 countries, ~1,300 units) and off‑premise (>50% occasions) drive share gains; loyalty (28M) and 31% digital mix propel frequency. Investment needs: $150–200m tech/rewards, capex for new stores and packaging; Fleming’s (~63 locations, $95 avg check) is a niche star needing selective capex to scale.
| Metric | Value (2024) |
|---|---|
| Outback units | ~1,300 |
| Countries | 23 |
| Loyalty | 28M |
| Digital mix | 31% |
| Tech/rewards spend | $150–200m |
| Fleming’s locations | ~63 |
| Fleming’s avg check | $95 |
What is included in the product
 Detailed Word Document
Bloomin' Brands BCG Matrix: quadrant breakdown with strategic moves—invest, hold or divest—plus risks and growth cues.

 Customizable Excel Spreadsheet
One-page BCG matrix mapping Bloomin' Brands units to quadrants—clear, print-ready and exportable for fast C-level decisions.
Cash Cows

Core Outback U.S. dine‑in
Core Outback U.S. dine‑in is a cash cow with a large footprint—roughly 1,300 U.S. locations and high brand awareness driving steady traffic, reflecting mature market leadership. It generates more cash than it needs, with Bloomin' Brands reporting approximately $3.7 billion in 2024 revenue to fund operations. Keep capex tight, prioritize operational and menu discipline, and milk the business to fund growth initiatives and protect margins.
Carrabba’s core suburban trade areas
Italian casual is a mature category, yet Carrabba’s retains meaningful share in legacy suburban trade areas with stable revenue generation, a favorable alcohol mix and predictable labor costs. Minimal promotional spend beyond maintenance keeps margins resilient. Excess cash flow from these hubs should be redeployed to fund higher‑growth concepts and digital/drive‑through investments.

Alcohol program across brands
Alcohol program across Bloomin' Brands is a classic cash cow: beverage alcohol typically delivers gross margins above 60% (2024 industry benchmark), with strong attach rates that drive high incremental profit per check. Scale purchasing, centralized training and low incremental spend mean the program leverages existing ops and drives reliable, repeatable cash generation meal after meal. Maintain consistency and compliance to bank that margin.

Gift cards and seasonal promos
Holiday gift cards and seasonal promos are a mature, repeatable profit stream for Bloomin' Brands, supporting its $4.5B+ annual revenue base (FY2023 reported ~4.5 billion). Distribution is wide with efficient marketing spend; cash arrives upfront while redemption costs are recognized over time, improving short-term liquidity. This engine prints working capital and reduces financing needs.
- Upfront cash inflow: improves cash conversion
- Breakage/float: industry breakage ~3% aids margins
- Low incremental marketing cost vs. lifetime value
- Seasonal spike concentrates Q4 sales and cash
Franchise and royalty streams
Franchise and royalty streams in mature markets deliver steady, high-margin fees with low incremental support costs; franchisor royalty rates typically range from 4 to 6% and franchise EBITDA margins often exceed 20%, making this a dependable cash cow rather than a hyper-growth lane. Preserve operator relationships, tighten brand and operational standards, and focus on timely royalty collection to sustain recurring cash flow.
- steady fees
- low support cost
- 4–6% royalty rates
- dependable cash flow
- prioritize relationships & standards
Suburban steakhouses, >60% alcohol margins and royalties drive steady cash flow
Core Outback, Carrabba’s suburban hubs, alcohol program, gift cards and franchise royalties are Bloomin' Brands cash cows—driving steady cash (company ~$3.7B revenue in 2024; FY2023 ~$4.5B), alcohol gross margins >60% (2024 benchmark), franchise royalties 4–6% and breakage ~3%; prioritize tight capex, ops discipline and redeploy excess cash to growth.
| Asset | 2024 Metric |
|---|---|
| Company revenue | $3.7B |
| Alcohol margin | >60% |
| Franchise royalty | 4–6% |
| Gift card breakage | ~3% |
What You’re Viewing Is Included
Bloomin' Brands BCG Matrix
The file you're previewing is the exact Bloomin' Brands BCG Matrix you'll receive after purchase — no watermarks, no placeholders, no surprises. It's the final, fully formatted report crafted for strategic clarity and quick decision-making. Once bought, the same editable file is yours to download, print, or present immediately. Built by strategy pros, it's ready to plug into your planning or investor decks.

Unlock Strategic Clarity
Quick snapshot: Bloomin' Brands’ BCG Matrix highlights which restaurant concepts are pulling market share and which are bleeding cash—useful, but limited. Buy the full BCG Matrix for quadrant-by-quadrant placements, data-backed recommendations, and a ready-to-present Word + Excel pack. Skip the guesswork—get strategic clarity and an action plan you can use right away.
Stars
Outback international growth
Outback holds strong brand recognition and is expanding in faster-growing international markets, operating in 23 countries and leveraging Bloomin' Brands' global platform. This mix positions Outback as a leader where demand is expanding, driving unit growth and market share gains. It requires capital for new stores, marketing, and supply chain investments. Continued investment can allow Outback to mature into a broad cash engine as growth normalizes.
Digital ordering + off‑premise
Off‑premise is outpacing dine‑in industrywide, now representing over half of occasions, and Bloomin' Brands' ~1,300‑unit scale gives Outback a distribution edge. High adoption, frequency, and improving unit economics are pushing share higher, but UX, delivery partnerships and ops still require spend. Fund it — it drives immediate volume and can mature into a stable cash cow.
Loyalty and CRM flywheel
Repeat diners compound quickly in casual dining when you personalize offers at scale; Bloomin' Brands leverages a loyalty base of about 28 million members and reported roughly 31% digital mix in recent trading updates, pushing share in a growing digital market. It consumes roughly $150m–$200m annually in tech and rewards to scale personalization and retention. Worth it — defend the lead and widen the moat.
Catering and group occasions
Catering and group occasions are rebounding from a small base, and Bloomin' Brands—with ~1,400 restaurants—can capture share where kitchen capacity and brand trust matter most; success requires targeted sales activation and dedicated packaging investment to convert enterprise accounts. Lean in now to lock long-term contracts before competitors scale.
Fleming’s in growth corridors
Fleming’s premium-steak concept is outperforming in select Sunbelt and affluent nodes, driven by strong brand equity and average checks near $95 in 2024, capturing outsized share where demand is rising.
Scaling requires targeted capex and specialized service training; selective investment can convert these growth boxes into durable cash generators for Bloomin' Brands.
- Locations: ~63 (2024)
- Avg check: ~$95 (2024)
- Strategy: selective capex + service training
Casual-dining leader: ~1,300 units, 23 countries, 28M loyalty, off-premise >50%
Outback and Off‑premise are Stars: Outback (23 countries, ~1,300 units) and off‑premise (>50% occasions) drive share gains; loyalty (28M) and 31% digital mix propel frequency. Investment needs: $150–200m tech/rewards, capex for new stores and packaging; Fleming’s (~63 locations, $95 avg check) is a niche star needing selective capex to scale.
| Metric | Value (2024) |
|---|---|
| Outback units | ~1,300 |
| Countries | 23 |
| Loyalty | 28M |
| Digital mix | 31% |
| Tech/rewards spend | $150–200m |
| Fleming’s locations | ~63 |
| Fleming’s avg check | $95 |
What is included in the product
Detailed Word Document
Bloomin' Brands BCG Matrix: quadrant breakdown with strategic moves—invest, hold or divest—plus risks and growth cues.
Customizable Excel Spreadsheet
One-page BCG matrix mapping Bloomin' Brands units to quadrants—clear, print-ready and exportable for fast C-level decisions.
Cash Cows
Core Outback U.S. dine‑in
Core Outback U.S. dine‑in is a cash cow with a large footprint—roughly 1,300 U.S. locations and high brand awareness driving steady traffic, reflecting mature market leadership. It generates more cash than it needs, with Bloomin' Brands reporting approximately $3.7 billion in 2024 revenue to fund operations. Keep capex tight, prioritize operational and menu discipline, and milk the business to fund growth initiatives and protect margins.
Carrabba’s core suburban trade areas
Italian casual is a mature category, yet Carrabba’s retains meaningful share in legacy suburban trade areas with stable revenue generation, a favorable alcohol mix and predictable labor costs. Minimal promotional spend beyond maintenance keeps margins resilient. Excess cash flow from these hubs should be redeployed to fund higher‑growth concepts and digital/drive‑through investments.
Alcohol program across brands
Alcohol program across Bloomin' Brands is a classic cash cow: beverage alcohol typically delivers gross margins above 60% (2024 industry benchmark), with strong attach rates that drive high incremental profit per check. Scale purchasing, centralized training and low incremental spend mean the program leverages existing ops and drives reliable, repeatable cash generation meal after meal. Maintain consistency and compliance to bank that margin.
Gift cards and seasonal promos
Holiday gift cards and seasonal promos are a mature, repeatable profit stream for Bloomin' Brands, supporting its $4.5B+ annual revenue base (FY2023 reported ~4.5 billion). Distribution is wide with efficient marketing spend; cash arrives upfront while redemption costs are recognized over time, improving short-term liquidity. This engine prints working capital and reduces financing needs.
- Upfront cash inflow: improves cash conversion
- Breakage/float: industry breakage ~3% aids margins
- Low incremental marketing cost vs. lifetime value
- Seasonal spike concentrates Q4 sales and cash
Franchise and royalty streams
Franchise and royalty streams in mature markets deliver steady, high-margin fees with low incremental support costs; franchisor royalty rates typically range from 4 to 6% and franchise EBITDA margins often exceed 20%, making this a dependable cash cow rather than a hyper-growth lane. Preserve operator relationships, tighten brand and operational standards, and focus on timely royalty collection to sustain recurring cash flow.
- steady fees
- low support cost
- 4–6% royalty rates
- dependable cash flow
- prioritize relationships & standards
Suburban steakhouses, >60% alcohol margins and royalties drive steady cash flow
Core Outback, Carrabba’s suburban hubs, alcohol program, gift cards and franchise royalties are Bloomin' Brands cash cows—driving steady cash (company ~$3.7B revenue in 2024; FY2023 ~$4.5B), alcohol gross margins >60% (2024 benchmark), franchise royalties 4–6% and breakage ~3%; prioritize tight capex, ops discipline and redeploy excess cash to growth.
| Asset | 2024 Metric |
|---|---|
| Company revenue | $3.7B |
| Alcohol margin | >60% |
| Franchise royalty | 4–6% |
| Gift card breakage | ~3% |
What You’re Viewing Is Included
Bloomin' Brands BCG Matrix
The file you're previewing is the exact Bloomin' Brands BCG Matrix you'll receive after purchase — no watermarks, no placeholders, no surprises. It's the final, fully formatted report crafted for strategic clarity and quick decision-making. Once bought, the same editable file is yours to download, print, or present immediately. Built by strategy pros, it's ready to plug into your planning or investor decks.
Original: $10.00
-65%$10.00
$3.50Description
Unlock Strategic Clarity
Quick snapshot: Bloomin' Brands’ BCG Matrix highlights which restaurant concepts are pulling market share and which are bleeding cash—useful, but limited. Buy the full BCG Matrix for quadrant-by-quadrant placements, data-backed recommendations, and a ready-to-present Word + Excel pack. Skip the guesswork—get strategic clarity and an action plan you can use right away.
Stars
Outback international growth
Outback holds strong brand recognition and is expanding in faster-growing international markets, operating in 23 countries and leveraging Bloomin' Brands' global platform. This mix positions Outback as a leader where demand is expanding, driving unit growth and market share gains. It requires capital for new stores, marketing, and supply chain investments. Continued investment can allow Outback to mature into a broad cash engine as growth normalizes.
Digital ordering + off‑premise
Off‑premise is outpacing dine‑in industrywide, now representing over half of occasions, and Bloomin' Brands' ~1,300‑unit scale gives Outback a distribution edge. High adoption, frequency, and improving unit economics are pushing share higher, but UX, delivery partnerships and ops still require spend. Fund it — it drives immediate volume and can mature into a stable cash cow.
Loyalty and CRM flywheel
Repeat diners compound quickly in casual dining when you personalize offers at scale; Bloomin' Brands leverages a loyalty base of about 28 million members and reported roughly 31% digital mix in recent trading updates, pushing share in a growing digital market. It consumes roughly $150m–$200m annually in tech and rewards to scale personalization and retention. Worth it — defend the lead and widen the moat.
Catering and group occasions
Catering and group occasions are rebounding from a small base, and Bloomin' Brands—with ~1,400 restaurants—can capture share where kitchen capacity and brand trust matter most; success requires targeted sales activation and dedicated packaging investment to convert enterprise accounts. Lean in now to lock long-term contracts before competitors scale.
Fleming’s in growth corridors
Fleming’s premium-steak concept is outperforming in select Sunbelt and affluent nodes, driven by strong brand equity and average checks near $95 in 2024, capturing outsized share where demand is rising.
Scaling requires targeted capex and specialized service training; selective investment can convert these growth boxes into durable cash generators for Bloomin' Brands.
- Locations: ~63 (2024)
- Avg check: ~$95 (2024)
- Strategy: selective capex + service training
Casual-dining leader: ~1,300 units, 23 countries, 28M loyalty, off-premise >50%
Outback and Off‑premise are Stars: Outback (23 countries, ~1,300 units) and off‑premise (>50% occasions) drive share gains; loyalty (28M) and 31% digital mix propel frequency. Investment needs: $150–200m tech/rewards, capex for new stores and packaging; Fleming’s (~63 locations, $95 avg check) is a niche star needing selective capex to scale.
| Metric | Value (2024) |
|---|---|
| Outback units | ~1,300 |
| Countries | 23 |
| Loyalty | 28M |
| Digital mix | 31% |
| Tech/rewards spend | $150–200m |
| Fleming’s locations | ~63 |
| Fleming’s avg check | $95 |
What is included in the product
Detailed Word Document
Bloomin' Brands BCG Matrix: quadrant breakdown with strategic moves—invest, hold or divest—plus risks and growth cues.
Customizable Excel Spreadsheet
One-page BCG matrix mapping Bloomin' Brands units to quadrants—clear, print-ready and exportable for fast C-level decisions.
Cash Cows
Core Outback U.S. dine‑in
Core Outback U.S. dine‑in is a cash cow with a large footprint—roughly 1,300 U.S. locations and high brand awareness driving steady traffic, reflecting mature market leadership. It generates more cash than it needs, with Bloomin' Brands reporting approximately $3.7 billion in 2024 revenue to fund operations. Keep capex tight, prioritize operational and menu discipline, and milk the business to fund growth initiatives and protect margins.
Carrabba’s core suburban trade areas
Italian casual is a mature category, yet Carrabba’s retains meaningful share in legacy suburban trade areas with stable revenue generation, a favorable alcohol mix and predictable labor costs. Minimal promotional spend beyond maintenance keeps margins resilient. Excess cash flow from these hubs should be redeployed to fund higher‑growth concepts and digital/drive‑through investments.
Alcohol program across brands
Alcohol program across Bloomin' Brands is a classic cash cow: beverage alcohol typically delivers gross margins above 60% (2024 industry benchmark), with strong attach rates that drive high incremental profit per check. Scale purchasing, centralized training and low incremental spend mean the program leverages existing ops and drives reliable, repeatable cash generation meal after meal. Maintain consistency and compliance to bank that margin.
Gift cards and seasonal promos
Holiday gift cards and seasonal promos are a mature, repeatable profit stream for Bloomin' Brands, supporting its $4.5B+ annual revenue base (FY2023 reported ~4.5 billion). Distribution is wide with efficient marketing spend; cash arrives upfront while redemption costs are recognized over time, improving short-term liquidity. This engine prints working capital and reduces financing needs.
- Upfront cash inflow: improves cash conversion
- Breakage/float: industry breakage ~3% aids margins
- Low incremental marketing cost vs. lifetime value
- Seasonal spike concentrates Q4 sales and cash
Franchise and royalty streams
Franchise and royalty streams in mature markets deliver steady, high-margin fees with low incremental support costs; franchisor royalty rates typically range from 4 to 6% and franchise EBITDA margins often exceed 20%, making this a dependable cash cow rather than a hyper-growth lane. Preserve operator relationships, tighten brand and operational standards, and focus on timely royalty collection to sustain recurring cash flow.
- steady fees
- low support cost
- 4–6% royalty rates
- dependable cash flow
- prioritize relationships & standards
Suburban steakhouses, >60% alcohol margins and royalties drive steady cash flow
Core Outback, Carrabba’s suburban hubs, alcohol program, gift cards and franchise royalties are Bloomin' Brands cash cows—driving steady cash (company ~$3.7B revenue in 2024; FY2023 ~$4.5B), alcohol gross margins >60% (2024 benchmark), franchise royalties 4–6% and breakage ~3%; prioritize tight capex, ops discipline and redeploy excess cash to growth.
| Asset | 2024 Metric |
|---|---|
| Company revenue | $3.7B |
| Alcohol margin | >60% |
| Franchise royalty | 4–6% |
| Gift card breakage | ~3% |
What You’re Viewing Is Included
Bloomin' Brands BCG Matrix
The file you're previewing is the exact Bloomin' Brands BCG Matrix you'll receive after purchase — no watermarks, no placeholders, no surprises. It's the final, fully formatted report crafted for strategic clarity and quick decision-making. Once bought, the same editable file is yours to download, print, or present immediately. Built by strategy pros, it's ready to plug into your planning or investor decks.











