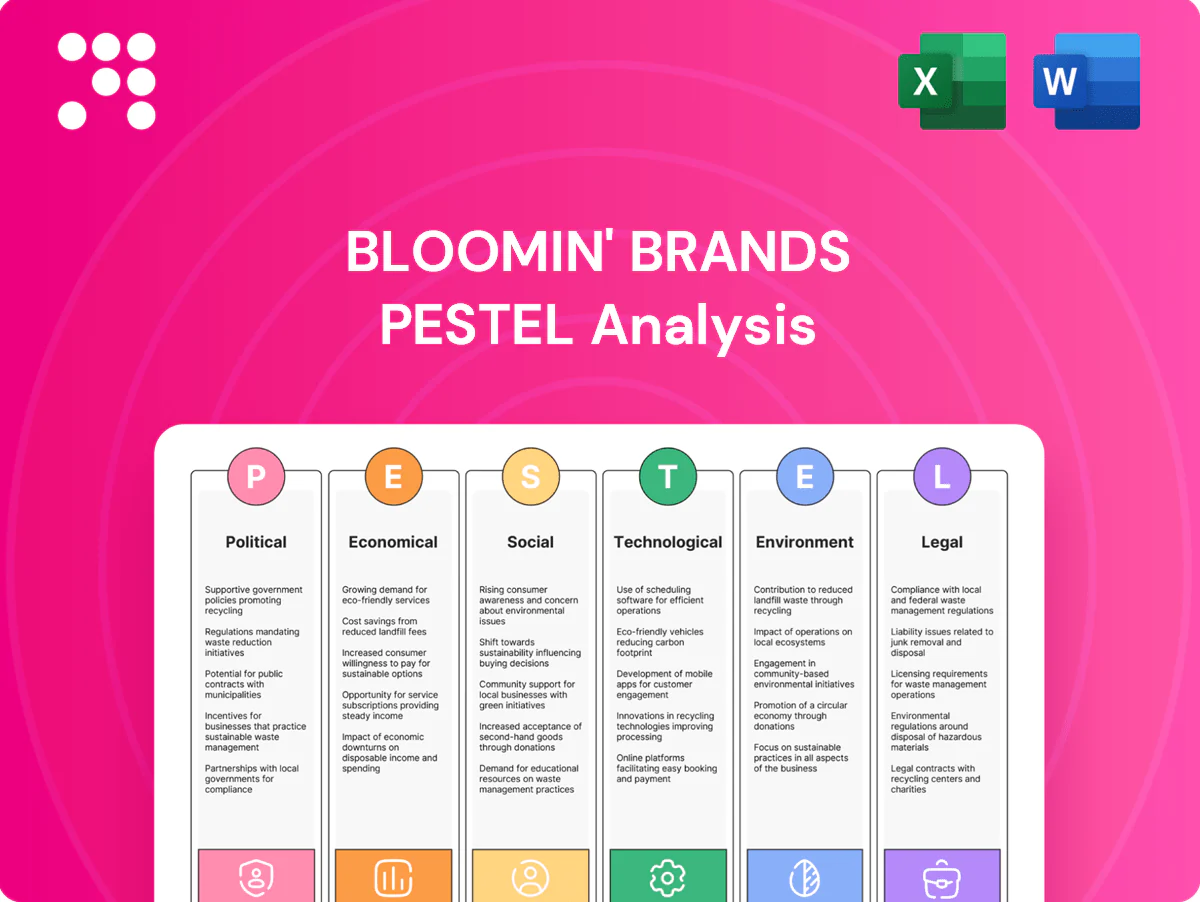
Bloomin' Brands PESTLE Analysis

Make Smarter Strategic Decisions with a Complete PESTEL View
Quickly grasp how political, economic, social, technological, legal and environmental forces are shaping Bloomin' Brands' outlook with our concise PESTLE snapshot. Ideal for investors, strategists, and consultants, this analysis highlights key risks and growth levers. Buy the full, editable PESTLE now to get the complete, actionable report and stay ahead.
Political factors

Minimum wage and labor policy shifts
Changes in federal and state wage floors—federal minimum remains $7.25 while more than 25 states now set minimums above $12—directly raise restaurant labor costs and constrain pricing power. Tip credit reforms and local scheduling ordinances force staffing model changes in dining rooms and kitchens. Bloomin' Brands must adjust compensation across jurisdictions and use lobbying and workforce planning to limit margin erosion.
Trade policies on beef and seafood
Tariffs, quotas and import rules materially affect input costs for beef, fish and wine, with seafood supply chains particularly exposed—about 84% of US seafood consumption is imported per NOAA—raising risk of sudden cost swings. Food cost pressures (restaurant COGS commonly 30–35% of sales) mean duties or disruptions can compress Outback Steakhouse and Bonefish Grill margins. Strategic sourcing diversification, commodity hedging and active government relations help reduce volatility and anticipate regulatory shifts.

Local permitting and alcohol licensing
Local city and county decisions on liquor licenses, patio dining and operating hours materially affect Bloomin' Brands, which operated approximately 1,300 restaurants as of 2024. Delays or restrictions can push remodels and new-unit openings out by 3–6 months, raising development costs. Robust compliance programs accelerate approvals and renewals, and proactive community engagement builds political goodwill.

Health and food safety oversight
Public health departments enforce restaurant inspections, grading and outbreak responses, with the CDC estimating about 48 million foodborne illnesses annually in the U.S., increasing regulatory focus on chains. Heightened scrutiny after incidents raises compliance costs and reputational risk for Bloomin' Brands, so centralized protocols and recurrent training are used to ensure consistency across concepts. Rapid, transparent incident communication preserves customer trust and limits legal exposure.
- Inspections & grading enforced by local health agencies
- Post-incident scrutiny → higher compliance costs & reputational risk
- Centralized protocols + training ensure consistency
- Rapid communication protects brand trust
International political risk exposure
Bloomin' Brands' operations in markets like Brazil face currency, tax and regulatory shifts that have real effects on margins; the Brazilian real depreciated roughly 15% vs USD from 2022–2024, increasing import and royalty costs. Election cycles and policy changes alter consumer demand and labor/tax burdens, affecting store-level economics. Localized sourcing and dynamic pricing have cushioned volatility, while scenario planning directs capital allocation for overseas expansion and capex.
- Exposure: Brazil operations
- Currency move: ~15% BRL vs USD (2022–24)
- Mitigants: localized sourcing, pricing
- Action: scenario-driven capital allocation
Labor, tariff and FX shocks compress margins; $7.25 min, ~84% imports
Federal/state wage hikes (federal $7.25; 25+ states >$12) and tip-credit reforms increase labor costs and compress margins across ~1,300 restaurants (2024). Tariffs and seafood import dependence (~84% imported per NOAA) raise COGS volatility; duties can hit 30–35% restaurant COGS. Local licensing, health inspections (CDC: ~48M foodborne illnesses/yr) and Brazil currency swings (~15% BRL↓ 2022–24) add regulatory and FX risk.
| Factor | Key stat |
|---|---|
| Wages | Federal $7.25; 25+ states >$12 |
| Seafood imports | ~84% imported |
| Foodborne illness | ~48M/yr |
| Brazil FX | ~15% BRL decline (2022–24) |
What is included in the product
 Detailed Word Document
Explores how macro-environmental factors—Political, Economic, Social, Technological, Environmental, and Legal—uniquely affect Bloomin' Brands, with data-backed trends and forward-looking insights tailored to the restaurant industry's regional and regulatory dynamics to inform strategy, risk mitigation, and investor decision-making.

 Customizable Excel Spreadsheet
A concise, visually segmented PESTLE summary for Bloomin' Brands that highlights external risks and market drivers for quick reference in meetings or presentations. Easily shared and editable for regional or business-line notes, it supports rapid alignment across teams and fuels strategic planning and client reports.
Economic factors

Consumer spending and real wages
Demand for casual and fine dining closely tracks disposable income and consumer confidence; higher real wages typically lift traffic and check averages while downturns push guests toward value and promotions.
Food inflation and commodity volatility
Beef, seafood, dairy and produce costs remain cyclical and weather-sensitive, driving short-term spikes that squeeze restaurant margins when menu pricing lags.
Inflationary pressure in 2024–25 increased input volatility, making contracting and commodity hedging critical to stabilize COGS across Bloomin' Brands concepts.
Active menu engineering and dynamic pricing—shifting mix toward higher-margin items and limited-time offers—help offset cost spikes and protect operating margins.

Labor market tightness
High restaurant turnover—above 70% industry-wide in 2023—keeps Bloomin' Brands incurring higher wages and training costs, with average food‑service hourly pay rising to roughly $17 in 2024. Tight local labor markets make staffing peak periods harder and risk service quality degradation. Investment in clear career pathways and scheduling technology has improved retention metrics. Balanced labor models protect the guest experience.

Interest rates and capital costs
Rising interest rates (Federal funds target ~5.25–5.50% mid‑2025) increase lease, remodel and debt servicing costs for Bloomin' Brands, pushing required returns on new units and renovations higher and tightening project economics. Management must prioritize disciplined capital allocation toward high‑ROI projects while using cash flow to cover buybacks and debt service.
- Higher funding costs raise capex hurdle rates
- Leases and remodels more expensive, slowing rollout
- Focus on high‑ROI projects, preserve cash flow
- Operating cash prioritized for debt service and buybacks
Foreign exchange and international demand
Foreign exchange swings affect Bloomin' Brands reported results and increase input costs for imported items, while Brazil and other international markets drive revenue growth but add volatility to margins. The company mitigates exposure via natural hedges, local procurement and pricing strategies, and provides FX risk discussion in SEC filings to help investors assess impact.
- FX impacts reported revenue and COGS
- Brazil/intl growth adds volatility
- Natural hedges/local sourcing limit risk
- SEC/10-K disclosure improves transparency
Labor, tariff and FX shocks compress margins; $7.25 min, ~84% imports
Demand tracks disposable income and consumer confidence; higher real wages lift traffic while downturns push guests to value. Inflationary pressure in 2024–25 raised input volatility, making contracting and hedging critical. Rising rates (Fed funds ~5.25–5.50% mid‑2025) and high turnover elevate capex and labor costs, with average food‑service hourly pay ≈ $17 in 2024.
| Metric | Value/Year |
|---|---|
| Fed funds target | ~5.25–5.50% (mid‑2025) |
| Avg food‑service hourly pay | ≈ $17 (2024) |
| Industry turnover | >70% (2023) |
Full Version Awaits
Bloomin' Brands PESTLE Analysis
The Bloomin' Brands PESTLE Analysis shown here is the exact, fully formatted document you’ll receive after purchase. This preview reflects the real file—no placeholders or teasers—and is ready to use for strategy and decision-making. The content, layout, and structure are identical to the downloadable final version.

Make Smarter Strategic Decisions with a Complete PESTEL View
Quickly grasp how political, economic, social, technological, legal and environmental forces are shaping Bloomin' Brands' outlook with our concise PESTLE snapshot. Ideal for investors, strategists, and consultants, this analysis highlights key risks and growth levers. Buy the full, editable PESTLE now to get the complete, actionable report and stay ahead.
Political factors
Minimum wage and labor policy shifts
Changes in federal and state wage floors—federal minimum remains $7.25 while more than 25 states now set minimums above $12—directly raise restaurant labor costs and constrain pricing power. Tip credit reforms and local scheduling ordinances force staffing model changes in dining rooms and kitchens. Bloomin' Brands must adjust compensation across jurisdictions and use lobbying and workforce planning to limit margin erosion.
Trade policies on beef and seafood
Tariffs, quotas and import rules materially affect input costs for beef, fish and wine, with seafood supply chains particularly exposed—about 84% of US seafood consumption is imported per NOAA—raising risk of sudden cost swings. Food cost pressures (restaurant COGS commonly 30–35% of sales) mean duties or disruptions can compress Outback Steakhouse and Bonefish Grill margins. Strategic sourcing diversification, commodity hedging and active government relations help reduce volatility and anticipate regulatory shifts.
Local permitting and alcohol licensing
Local city and county decisions on liquor licenses, patio dining and operating hours materially affect Bloomin' Brands, which operated approximately 1,300 restaurants as of 2024. Delays or restrictions can push remodels and new-unit openings out by 3–6 months, raising development costs. Robust compliance programs accelerate approvals and renewals, and proactive community engagement builds political goodwill.
Health and food safety oversight
Public health departments enforce restaurant inspections, grading and outbreak responses, with the CDC estimating about 48 million foodborne illnesses annually in the U.S., increasing regulatory focus on chains. Heightened scrutiny after incidents raises compliance costs and reputational risk for Bloomin' Brands, so centralized protocols and recurrent training are used to ensure consistency across concepts. Rapid, transparent incident communication preserves customer trust and limits legal exposure.
- Inspections & grading enforced by local health agencies
- Post-incident scrutiny → higher compliance costs & reputational risk
- Centralized protocols + training ensure consistency
- Rapid communication protects brand trust
International political risk exposure
Bloomin' Brands' operations in markets like Brazil face currency, tax and regulatory shifts that have real effects on margins; the Brazilian real depreciated roughly 15% vs USD from 2022–2024, increasing import and royalty costs. Election cycles and policy changes alter consumer demand and labor/tax burdens, affecting store-level economics. Localized sourcing and dynamic pricing have cushioned volatility, while scenario planning directs capital allocation for overseas expansion and capex.
- Exposure: Brazil operations
- Currency move: ~15% BRL vs USD (2022–24)
- Mitigants: localized sourcing, pricing
- Action: scenario-driven capital allocation
Labor, tariff and FX shocks compress margins; $7.25 min, ~84% imports
Federal/state wage hikes (federal $7.25; 25+ states >$12) and tip-credit reforms increase labor costs and compress margins across ~1,300 restaurants (2024). Tariffs and seafood import dependence (~84% imported per NOAA) raise COGS volatility; duties can hit 30–35% restaurant COGS. Local licensing, health inspections (CDC: ~48M foodborne illnesses/yr) and Brazil currency swings (~15% BRL↓ 2022–24) add regulatory and FX risk.
| Factor | Key stat |
|---|---|
| Wages | Federal $7.25; 25+ states >$12 |
| Seafood imports | ~84% imported |
| Foodborne illness | ~48M/yr |
| Brazil FX | ~15% BRL decline (2022–24) |
What is included in the product
Detailed Word Document
Explores how macro-environmental factors—Political, Economic, Social, Technological, Environmental, and Legal—uniquely affect Bloomin' Brands, with data-backed trends and forward-looking insights tailored to the restaurant industry's regional and regulatory dynamics to inform strategy, risk mitigation, and investor decision-making.
Customizable Excel Spreadsheet
A concise, visually segmented PESTLE summary for Bloomin' Brands that highlights external risks and market drivers for quick reference in meetings or presentations. Easily shared and editable for regional or business-line notes, it supports rapid alignment across teams and fuels strategic planning and client reports.
Economic factors
Consumer spending and real wages
Demand for casual and fine dining closely tracks disposable income and consumer confidence; higher real wages typically lift traffic and check averages while downturns push guests toward value and promotions.
Food inflation and commodity volatility
Beef, seafood, dairy and produce costs remain cyclical and weather-sensitive, driving short-term spikes that squeeze restaurant margins when menu pricing lags.
Inflationary pressure in 2024–25 increased input volatility, making contracting and commodity hedging critical to stabilize COGS across Bloomin' Brands concepts.
Active menu engineering and dynamic pricing—shifting mix toward higher-margin items and limited-time offers—help offset cost spikes and protect operating margins.
Labor market tightness
High restaurant turnover—above 70% industry-wide in 2023—keeps Bloomin' Brands incurring higher wages and training costs, with average food‑service hourly pay rising to roughly $17 in 2024. Tight local labor markets make staffing peak periods harder and risk service quality degradation. Investment in clear career pathways and scheduling technology has improved retention metrics. Balanced labor models protect the guest experience.
Interest rates and capital costs
Rising interest rates (Federal funds target ~5.25–5.50% mid‑2025) increase lease, remodel and debt servicing costs for Bloomin' Brands, pushing required returns on new units and renovations higher and tightening project economics. Management must prioritize disciplined capital allocation toward high‑ROI projects while using cash flow to cover buybacks and debt service.
- Higher funding costs raise capex hurdle rates
- Leases and remodels more expensive, slowing rollout
- Focus on high‑ROI projects, preserve cash flow
- Operating cash prioritized for debt service and buybacks
Foreign exchange and international demand
Foreign exchange swings affect Bloomin' Brands reported results and increase input costs for imported items, while Brazil and other international markets drive revenue growth but add volatility to margins. The company mitigates exposure via natural hedges, local procurement and pricing strategies, and provides FX risk discussion in SEC filings to help investors assess impact.
- FX impacts reported revenue and COGS
- Brazil/intl growth adds volatility
- Natural hedges/local sourcing limit risk
- SEC/10-K disclosure improves transparency
Labor, tariff and FX shocks compress margins; $7.25 min, ~84% imports
Demand tracks disposable income and consumer confidence; higher real wages lift traffic while downturns push guests to value. Inflationary pressure in 2024–25 raised input volatility, making contracting and hedging critical. Rising rates (Fed funds ~5.25–5.50% mid‑2025) and high turnover elevate capex and labor costs, with average food‑service hourly pay ≈ $17 in 2024.
| Metric | Value/Year |
|---|---|
| Fed funds target | ~5.25–5.50% (mid‑2025) |
| Avg food‑service hourly pay | ≈ $17 (2024) |
| Industry turnover | >70% (2023) |
Full Version Awaits
Bloomin' Brands PESTLE Analysis
The Bloomin' Brands PESTLE Analysis shown here is the exact, fully formatted document you’ll receive after purchase. This preview reflects the real file—no placeholders or teasers—and is ready to use for strategy and decision-making. The content, layout, and structure are identical to the downloadable final version.
Original: $10.00
-65%$10.00
$3.50Description
Make Smarter Strategic Decisions with a Complete PESTEL View
Quickly grasp how political, economic, social, technological, legal and environmental forces are shaping Bloomin' Brands' outlook with our concise PESTLE snapshot. Ideal for investors, strategists, and consultants, this analysis highlights key risks and growth levers. Buy the full, editable PESTLE now to get the complete, actionable report and stay ahead.
Political factors
Minimum wage and labor policy shifts
Changes in federal and state wage floors—federal minimum remains $7.25 while more than 25 states now set minimums above $12—directly raise restaurant labor costs and constrain pricing power. Tip credit reforms and local scheduling ordinances force staffing model changes in dining rooms and kitchens. Bloomin' Brands must adjust compensation across jurisdictions and use lobbying and workforce planning to limit margin erosion.
Trade policies on beef and seafood
Tariffs, quotas and import rules materially affect input costs for beef, fish and wine, with seafood supply chains particularly exposed—about 84% of US seafood consumption is imported per NOAA—raising risk of sudden cost swings. Food cost pressures (restaurant COGS commonly 30–35% of sales) mean duties or disruptions can compress Outback Steakhouse and Bonefish Grill margins. Strategic sourcing diversification, commodity hedging and active government relations help reduce volatility and anticipate regulatory shifts.
Local permitting and alcohol licensing
Local city and county decisions on liquor licenses, patio dining and operating hours materially affect Bloomin' Brands, which operated approximately 1,300 restaurants as of 2024. Delays or restrictions can push remodels and new-unit openings out by 3–6 months, raising development costs. Robust compliance programs accelerate approvals and renewals, and proactive community engagement builds political goodwill.
Health and food safety oversight
Public health departments enforce restaurant inspections, grading and outbreak responses, with the CDC estimating about 48 million foodborne illnesses annually in the U.S., increasing regulatory focus on chains. Heightened scrutiny after incidents raises compliance costs and reputational risk for Bloomin' Brands, so centralized protocols and recurrent training are used to ensure consistency across concepts. Rapid, transparent incident communication preserves customer trust and limits legal exposure.
- Inspections & grading enforced by local health agencies
- Post-incident scrutiny → higher compliance costs & reputational risk
- Centralized protocols + training ensure consistency
- Rapid communication protects brand trust
International political risk exposure
Bloomin' Brands' operations in markets like Brazil face currency, tax and regulatory shifts that have real effects on margins; the Brazilian real depreciated roughly 15% vs USD from 2022–2024, increasing import and royalty costs. Election cycles and policy changes alter consumer demand and labor/tax burdens, affecting store-level economics. Localized sourcing and dynamic pricing have cushioned volatility, while scenario planning directs capital allocation for overseas expansion and capex.
- Exposure: Brazil operations
- Currency move: ~15% BRL vs USD (2022–24)
- Mitigants: localized sourcing, pricing
- Action: scenario-driven capital allocation
Labor, tariff and FX shocks compress margins; $7.25 min, ~84% imports
Federal/state wage hikes (federal $7.25; 25+ states >$12) and tip-credit reforms increase labor costs and compress margins across ~1,300 restaurants (2024). Tariffs and seafood import dependence (~84% imported per NOAA) raise COGS volatility; duties can hit 30–35% restaurant COGS. Local licensing, health inspections (CDC: ~48M foodborne illnesses/yr) and Brazil currency swings (~15% BRL↓ 2022–24) add regulatory and FX risk.
| Factor | Key stat |
|---|---|
| Wages | Federal $7.25; 25+ states >$12 |
| Seafood imports | ~84% imported |
| Foodborne illness | ~48M/yr |
| Brazil FX | ~15% BRL decline (2022–24) |
What is included in the product
Detailed Word Document
Explores how macro-environmental factors—Political, Economic, Social, Technological, Environmental, and Legal—uniquely affect Bloomin' Brands, with data-backed trends and forward-looking insights tailored to the restaurant industry's regional and regulatory dynamics to inform strategy, risk mitigation, and investor decision-making.
Customizable Excel Spreadsheet
A concise, visually segmented PESTLE summary for Bloomin' Brands that highlights external risks and market drivers for quick reference in meetings or presentations. Easily shared and editable for regional or business-line notes, it supports rapid alignment across teams and fuels strategic planning and client reports.
Economic factors
Consumer spending and real wages
Demand for casual and fine dining closely tracks disposable income and consumer confidence; higher real wages typically lift traffic and check averages while downturns push guests toward value and promotions.
Food inflation and commodity volatility
Beef, seafood, dairy and produce costs remain cyclical and weather-sensitive, driving short-term spikes that squeeze restaurant margins when menu pricing lags.
Inflationary pressure in 2024–25 increased input volatility, making contracting and commodity hedging critical to stabilize COGS across Bloomin' Brands concepts.
Active menu engineering and dynamic pricing—shifting mix toward higher-margin items and limited-time offers—help offset cost spikes and protect operating margins.
Labor market tightness
High restaurant turnover—above 70% industry-wide in 2023—keeps Bloomin' Brands incurring higher wages and training costs, with average food‑service hourly pay rising to roughly $17 in 2024. Tight local labor markets make staffing peak periods harder and risk service quality degradation. Investment in clear career pathways and scheduling technology has improved retention metrics. Balanced labor models protect the guest experience.
Interest rates and capital costs
Rising interest rates (Federal funds target ~5.25–5.50% mid‑2025) increase lease, remodel and debt servicing costs for Bloomin' Brands, pushing required returns on new units and renovations higher and tightening project economics. Management must prioritize disciplined capital allocation toward high‑ROI projects while using cash flow to cover buybacks and debt service.
- Higher funding costs raise capex hurdle rates
- Leases and remodels more expensive, slowing rollout
- Focus on high‑ROI projects, preserve cash flow
- Operating cash prioritized for debt service and buybacks
Foreign exchange and international demand
Foreign exchange swings affect Bloomin' Brands reported results and increase input costs for imported items, while Brazil and other international markets drive revenue growth but add volatility to margins. The company mitigates exposure via natural hedges, local procurement and pricing strategies, and provides FX risk discussion in SEC filings to help investors assess impact.
- FX impacts reported revenue and COGS
- Brazil/intl growth adds volatility
- Natural hedges/local sourcing limit risk
- SEC/10-K disclosure improves transparency
Labor, tariff and FX shocks compress margins; $7.25 min, ~84% imports
Demand tracks disposable income and consumer confidence; higher real wages lift traffic while downturns push guests to value. Inflationary pressure in 2024–25 raised input volatility, making contracting and hedging critical. Rising rates (Fed funds ~5.25–5.50% mid‑2025) and high turnover elevate capex and labor costs, with average food‑service hourly pay ≈ $17 in 2024.
| Metric | Value/Year |
|---|---|
| Fed funds target | ~5.25–5.50% (mid‑2025) |
| Avg food‑service hourly pay | ≈ $17 (2024) |
| Industry turnover | >70% (2023) |
Full Version Awaits
Bloomin' Brands PESTLE Analysis
The Bloomin' Brands PESTLE Analysis shown here is the exact, fully formatted document you’ll receive after purchase. This preview reflects the real file—no placeholders or teasers—and is ready to use for strategy and decision-making. The content, layout, and structure are identical to the downloadable final version.











