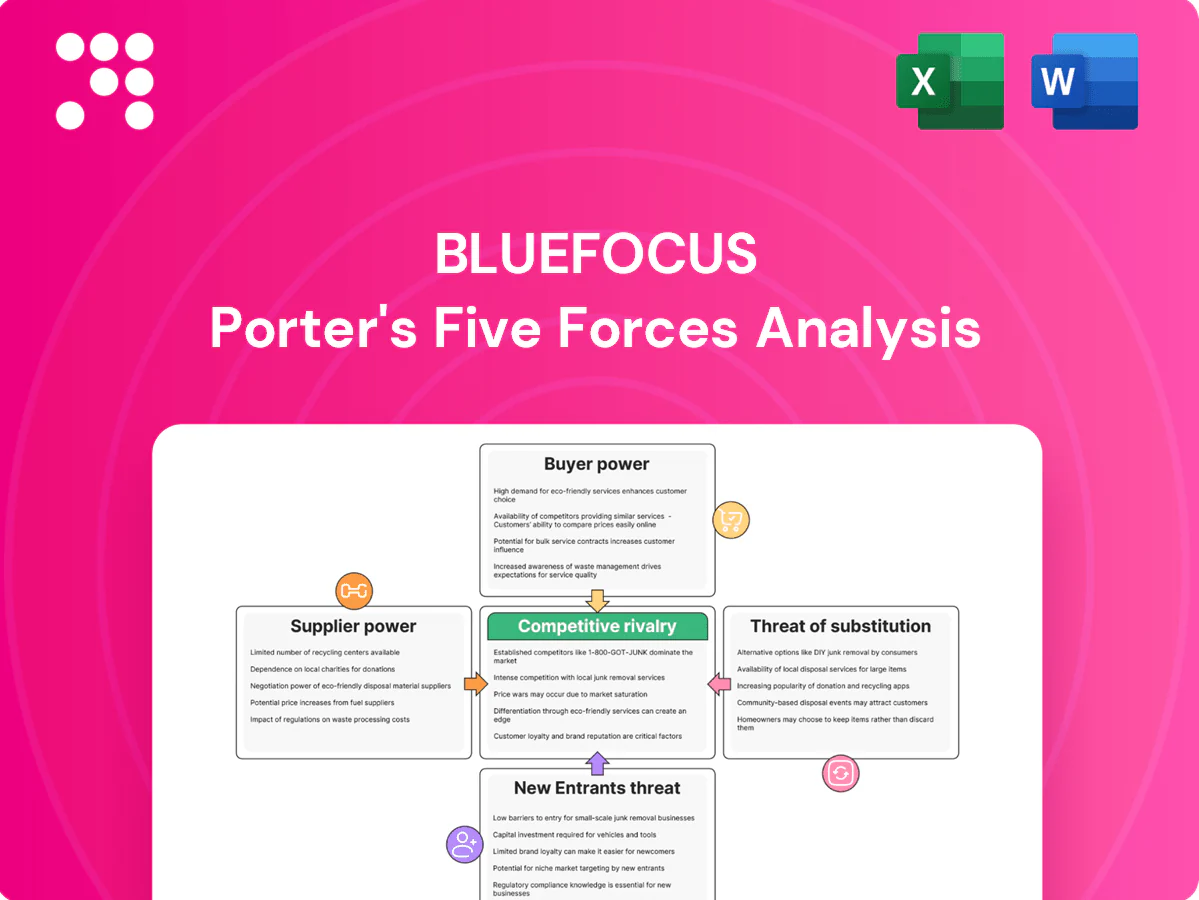
BlueFocus Porter's Five Forces Analysis

Go Beyond the Preview—Access the Full Strategic Report
Discover a concise Porter's Five Forces snapshot for BlueFocus revealing competitive intensity, supplier and buyer pressures, and substitute risks. This brief highlights key dynamics but leaves deeper implications unexplored. Unlock the full Porter's Five Forces Analysis to access force-by-force ratings, visuals, and actionable strategy insights.
Suppliers Bargaining Power

Dominance of media and digital platforms
Major platforms such as ByteDance, Meta, Tencent and Alibaba control ad inventory and audience data, with over 60% of China s digital ad inventory concentrated among the top three platforms and global digital ad spend topping $600 billion in 2024, giving them pricing and access leverage. BlueFocus depends on these channels for reach and performance; platform policy changes can alter campaign economics overnight. Preferred partner status and volume commitments can reduce but not remove this power asymmetry.
Martech, data, and adtech vendors
As of 2024, specialized analytics, CDP, DSP and attribution capabilities remain concentrated among a handful of providers, giving suppliers outsized leverage. Multi-year contracts and integrations commonly take 6–12 months, raising switching costs and training budgets. Vendors can therefore increase fees or limit data portability, but negotiating enterprise bundles and building proprietary stacks materially reduces dependence.

High-demand creative and strategic talent
Senior creatives, planners and data scientists are scarce and mobile, driving wage pressure with hiring premiums of 15–30% in 2024 for key roles. Talent markets in Beijing, Shanghai and Shenzhen intensify bidding among agencies and consultancies, raising recruiting costs and bench spend. Attrition rates above 25% risk disrupting client delivery and IP continuity. Strong employer brand and internal academies at BlueFocus help offset supply-side pressure.

Influencers, KOLs, and content creators
Top-tier creators command premium pricing and selective access, boosting supplier power; the global influencer market was about $24.1B in 2024 and mega creators commonly charge $100k–$1M per campaign. Their audience ownership and higher engagement rates increase negotiation leverage, while exclusivity clauses and availability conflicts constrain campaign flexibility. Building long-tail creator networks and first-party communities can dilute concentration risk.
- Market size 2024: $24.1B
- Mega rates: $100k–$1M/campaign
- Engagement advantage: micro 3–8%
- Mitigation: long-tail + first-party communities
IT infrastructure and cloud services
Reliance on major cloud providers (AWS ~32%, Microsoft Azure ~22%, Google Cloud ~11% — combined ~65% of market in 2024) and extensive API ecosystems creates embedded dependencies that raise switching costs. Usage-based pricing and data egress fees can escalate costs as workloads scale, while security and compliance requirements further lock in vendors. Multicloud strategies and open-source components (Kubernetes, Linux) provide negotiation leverage.
- Concentration: 65% market share (2024)
- Cost risk: usage/egress fees escalate with scale
- Lock-in: compliance/security amplify stickiness
- Leverage: multicloud + open-source reduce dependence
Platform & cloud concentration squeeze margins in $600B ad market
Major platforms (top three >60% China ad inventory) and $600B global digital ad spend (2024) give suppliers pricing and access leverage over BlueFocus. Specialized analytics/CDP/DSP concentration, 6–12 month integrations and 15–30% hiring premiums raise switching costs. Influencer market $24.1B (2024) with mega rates $100k–$1M/campaign concentrates creative supply. Cloud concentration (AWS 32%/Azure 22%/GCP 11% =65%) adds vendor lock-in risk.
| Metric | 2024 |
|---|---|
| Global digital ad spend | $600B |
| China top3 ad inventory | >60% |
| Influencer market | $24.1B |
| Mega creator rates | $100k–$1M |
| Cloud share (AWS/Azure/GCP) | 32/22/11 (65% total) |
| Hiring premium | 15–30% |
| Attrition | >25% |
What is included in the product
 Detailed Word Document
Tailored Porter’s Five Forces analysis for BlueFocus, uncovering competitive drivers, buyer and supplier power, threats from substitutes and new entrants, and strategic barriers that protect incumbents; includes insights on disruptive forces and market dynamics to inform pricing, positioning, and growth strategies.

 Customizable Excel Spreadsheet
A clear one-sheet summary of all five forces—instantly exposing BlueFocus’s competitive pain points and strategic levers for fast, confident decision-making.
Customers Bargaining Power

Large global and Chinese brand advertisers
Large global and Chinese brand advertisers control significant budgets and can demand custom terms, with agency relationships often driven by clients representing over 50% of retained revenue in 2024. Their scale enables rate benchmarking and multi‑year pricing pressure, and they increasingly require measurable ROI and coordinated cross‑market campaigns. Strategic partnerships with agencies can pivot negotiations from price to integrated value offerings.
Frequent multi-agency competitive pitches
Clients rebid scopes frequently, with enterprise accounts moving to formal pitches every 12–24 months in 2024, eroding agency pricing power and forcing fee discounts. Extended pitch cycles raise cost-to-serve and compress margins, with agencies reporting up to 8–12% higher acquisition costs per new brief. Incumbency is less protective as procurement formalizes scorecards, while differentiated case studies and proprietary data assets can lift win rates by ~15% in 2024.

Data transparency and performance accountability
Buyers demand granular reporting, brand safety and clear attribution, and with global ad spend forecast at about $885bn in 2024 buyers exercise fee scrutiny and push outcome-based contracts that shift risk to agencies. Underperformance often leads to rapid scope reductions or termination within quarters, while fee renegotiations rise—outcome clauses reported up ~20% in 2024 RFPs. Robust MMM/MTA capabilities defend pricing and limit churn.

Low switching costs across commoditized services
Low switching costs persist as media buying and basic creative are easily swapped; programmatic channels accounted for over 75% of global display ad buying in 2024, lowering client lock-in. Standardized platforms and APIs compress differentiation, while knowledge-transfer clauses further smooth transitions. Conversely, embedded teams and martech integration raise switching barriers by deepening operational ties.
- Media commoditization — programmatic >75% (2024)
- Low technical lock-in — standardized tools/APIs
- Contractual ease — knowledge-transfer clauses
- Higher barrier — embedded teams + martech integration
Insourcing and hybrid operating models
Clients increasingly insource strategy, data, or creative pods to cut agency fees, shifting bargaining power toward buyers and compressing traditional retainers while creating demand for targeted, high-value engagements.
Hybrid models reallocate scope to specialized agency tasks, enabling agencies like BlueFocus to win project-based work but face margin pressure on long-term contracts.
Co-location, capability-building services, and embedded teams help maintain relevance by offering integration that pure insourcing lacks.
- insourcing reduces retainer revenue
- hybrid models increase project-work share
- co-location preserves agency stickiness
Buyers leverage: top clients >50%, ad spend $885bn
Buyers hold strong leverage: top clients account for >50% of retained revenue and global ad spend hit $885bn in 2024. Rebids occur every 12–24 months, outcome clauses rose ~20% and acquisition costs rose 8–12%, while programmatic >75% lowers lock-in; insourcing and embedded teams shift power to buyers but martech integration raises switching costs.
| Metric | 2024 |
|---|---|
| Global ad spend | $885bn |
| Programmatic share | >75% |
| Outcome clauses | +20% |
| Acquisition cost | +8–12% |
Same Document Delivered
BlueFocus Porter's Five Forces Analysis
This preview shows the exact BlueFocus Porter’s Five Forces analysis you’ll receive immediately after purchase—fully formatted, professionally written, and ready for use. No placeholders or mockups: the document displayed is the deliverable you’ll download instantly upon payment. It contains the complete competitive assessment and actionable insights for strategic decision-making.

Go Beyond the Preview—Access the Full Strategic Report
Discover a concise Porter's Five Forces snapshot for BlueFocus revealing competitive intensity, supplier and buyer pressures, and substitute risks. This brief highlights key dynamics but leaves deeper implications unexplored. Unlock the full Porter's Five Forces Analysis to access force-by-force ratings, visuals, and actionable strategy insights.
Suppliers Bargaining Power
Dominance of media and digital platforms
Major platforms such as ByteDance, Meta, Tencent and Alibaba control ad inventory and audience data, with over 60% of China s digital ad inventory concentrated among the top three platforms and global digital ad spend topping $600 billion in 2024, giving them pricing and access leverage. BlueFocus depends on these channels for reach and performance; platform policy changes can alter campaign economics overnight. Preferred partner status and volume commitments can reduce but not remove this power asymmetry.
Martech, data, and adtech vendors
As of 2024, specialized analytics, CDP, DSP and attribution capabilities remain concentrated among a handful of providers, giving suppliers outsized leverage. Multi-year contracts and integrations commonly take 6–12 months, raising switching costs and training budgets. Vendors can therefore increase fees or limit data portability, but negotiating enterprise bundles and building proprietary stacks materially reduces dependence.
High-demand creative and strategic talent
Senior creatives, planners and data scientists are scarce and mobile, driving wage pressure with hiring premiums of 15–30% in 2024 for key roles. Talent markets in Beijing, Shanghai and Shenzhen intensify bidding among agencies and consultancies, raising recruiting costs and bench spend. Attrition rates above 25% risk disrupting client delivery and IP continuity. Strong employer brand and internal academies at BlueFocus help offset supply-side pressure.
Influencers, KOLs, and content creators
Top-tier creators command premium pricing and selective access, boosting supplier power; the global influencer market was about $24.1B in 2024 and mega creators commonly charge $100k–$1M per campaign. Their audience ownership and higher engagement rates increase negotiation leverage, while exclusivity clauses and availability conflicts constrain campaign flexibility. Building long-tail creator networks and first-party communities can dilute concentration risk.
- Market size 2024: $24.1B
- Mega rates: $100k–$1M/campaign
- Engagement advantage: micro 3–8%
- Mitigation: long-tail + first-party communities
IT infrastructure and cloud services
Reliance on major cloud providers (AWS ~32%, Microsoft Azure ~22%, Google Cloud ~11% — combined ~65% of market in 2024) and extensive API ecosystems creates embedded dependencies that raise switching costs. Usage-based pricing and data egress fees can escalate costs as workloads scale, while security and compliance requirements further lock in vendors. Multicloud strategies and open-source components (Kubernetes, Linux) provide negotiation leverage.
- Concentration: 65% market share (2024)
- Cost risk: usage/egress fees escalate with scale
- Lock-in: compliance/security amplify stickiness
- Leverage: multicloud + open-source reduce dependence
Platform & cloud concentration squeeze margins in $600B ad market
Major platforms (top three >60% China ad inventory) and $600B global digital ad spend (2024) give suppliers pricing and access leverage over BlueFocus. Specialized analytics/CDP/DSP concentration, 6–12 month integrations and 15–30% hiring premiums raise switching costs. Influencer market $24.1B (2024) with mega rates $100k–$1M/campaign concentrates creative supply. Cloud concentration (AWS 32%/Azure 22%/GCP 11% =65%) adds vendor lock-in risk.
| Metric | 2024 |
|---|---|
| Global digital ad spend | $600B |
| China top3 ad inventory | >60% |
| Influencer market | $24.1B |
| Mega creator rates | $100k–$1M |
| Cloud share (AWS/Azure/GCP) | 32/22/11 (65% total) |
| Hiring premium | 15–30% |
| Attrition | >25% |
What is included in the product
Detailed Word Document
Tailored Porter’s Five Forces analysis for BlueFocus, uncovering competitive drivers, buyer and supplier power, threats from substitutes and new entrants, and strategic barriers that protect incumbents; includes insights on disruptive forces and market dynamics to inform pricing, positioning, and growth strategies.
Customizable Excel Spreadsheet
A clear one-sheet summary of all five forces—instantly exposing BlueFocus’s competitive pain points and strategic levers for fast, confident decision-making.
Customers Bargaining Power
Large global and Chinese brand advertisers
Large global and Chinese brand advertisers control significant budgets and can demand custom terms, with agency relationships often driven by clients representing over 50% of retained revenue in 2024. Their scale enables rate benchmarking and multi‑year pricing pressure, and they increasingly require measurable ROI and coordinated cross‑market campaigns. Strategic partnerships with agencies can pivot negotiations from price to integrated value offerings.
Frequent multi-agency competitive pitches
Clients rebid scopes frequently, with enterprise accounts moving to formal pitches every 12–24 months in 2024, eroding agency pricing power and forcing fee discounts. Extended pitch cycles raise cost-to-serve and compress margins, with agencies reporting up to 8–12% higher acquisition costs per new brief. Incumbency is less protective as procurement formalizes scorecards, while differentiated case studies and proprietary data assets can lift win rates by ~15% in 2024.
Data transparency and performance accountability
Buyers demand granular reporting, brand safety and clear attribution, and with global ad spend forecast at about $885bn in 2024 buyers exercise fee scrutiny and push outcome-based contracts that shift risk to agencies. Underperformance often leads to rapid scope reductions or termination within quarters, while fee renegotiations rise—outcome clauses reported up ~20% in 2024 RFPs. Robust MMM/MTA capabilities defend pricing and limit churn.
Low switching costs across commoditized services
Low switching costs persist as media buying and basic creative are easily swapped; programmatic channels accounted for over 75% of global display ad buying in 2024, lowering client lock-in. Standardized platforms and APIs compress differentiation, while knowledge-transfer clauses further smooth transitions. Conversely, embedded teams and martech integration raise switching barriers by deepening operational ties.
- Media commoditization — programmatic >75% (2024)
- Low technical lock-in — standardized tools/APIs
- Contractual ease — knowledge-transfer clauses
- Higher barrier — embedded teams + martech integration
Insourcing and hybrid operating models
Clients increasingly insource strategy, data, or creative pods to cut agency fees, shifting bargaining power toward buyers and compressing traditional retainers while creating demand for targeted, high-value engagements.
Hybrid models reallocate scope to specialized agency tasks, enabling agencies like BlueFocus to win project-based work but face margin pressure on long-term contracts.
Co-location, capability-building services, and embedded teams help maintain relevance by offering integration that pure insourcing lacks.
- insourcing reduces retainer revenue
- hybrid models increase project-work share
- co-location preserves agency stickiness
Buyers leverage: top clients >50%, ad spend $885bn
Buyers hold strong leverage: top clients account for >50% of retained revenue and global ad spend hit $885bn in 2024. Rebids occur every 12–24 months, outcome clauses rose ~20% and acquisition costs rose 8–12%, while programmatic >75% lowers lock-in; insourcing and embedded teams shift power to buyers but martech integration raises switching costs.
| Metric | 2024 |
|---|---|
| Global ad spend | $885bn |
| Programmatic share | >75% |
| Outcome clauses | +20% |
| Acquisition cost | +8–12% |
Same Document Delivered
BlueFocus Porter's Five Forces Analysis
This preview shows the exact BlueFocus Porter’s Five Forces analysis you’ll receive immediately after purchase—fully formatted, professionally written, and ready for use. No placeholders or mockups: the document displayed is the deliverable you’ll download instantly upon payment. It contains the complete competitive assessment and actionable insights for strategic decision-making.
Original: $10.00
-65%$10.00
$3.50Description
Go Beyond the Preview—Access the Full Strategic Report
Discover a concise Porter's Five Forces snapshot for BlueFocus revealing competitive intensity, supplier and buyer pressures, and substitute risks. This brief highlights key dynamics but leaves deeper implications unexplored. Unlock the full Porter's Five Forces Analysis to access force-by-force ratings, visuals, and actionable strategy insights.
Suppliers Bargaining Power
Dominance of media and digital platforms
Major platforms such as ByteDance, Meta, Tencent and Alibaba control ad inventory and audience data, with over 60% of China s digital ad inventory concentrated among the top three platforms and global digital ad spend topping $600 billion in 2024, giving them pricing and access leverage. BlueFocus depends on these channels for reach and performance; platform policy changes can alter campaign economics overnight. Preferred partner status and volume commitments can reduce but not remove this power asymmetry.
Martech, data, and adtech vendors
As of 2024, specialized analytics, CDP, DSP and attribution capabilities remain concentrated among a handful of providers, giving suppliers outsized leverage. Multi-year contracts and integrations commonly take 6–12 months, raising switching costs and training budgets. Vendors can therefore increase fees or limit data portability, but negotiating enterprise bundles and building proprietary stacks materially reduces dependence.
High-demand creative and strategic talent
Senior creatives, planners and data scientists are scarce and mobile, driving wage pressure with hiring premiums of 15–30% in 2024 for key roles. Talent markets in Beijing, Shanghai and Shenzhen intensify bidding among agencies and consultancies, raising recruiting costs and bench spend. Attrition rates above 25% risk disrupting client delivery and IP continuity. Strong employer brand and internal academies at BlueFocus help offset supply-side pressure.
Influencers, KOLs, and content creators
Top-tier creators command premium pricing and selective access, boosting supplier power; the global influencer market was about $24.1B in 2024 and mega creators commonly charge $100k–$1M per campaign. Their audience ownership and higher engagement rates increase negotiation leverage, while exclusivity clauses and availability conflicts constrain campaign flexibility. Building long-tail creator networks and first-party communities can dilute concentration risk.
- Market size 2024: $24.1B
- Mega rates: $100k–$1M/campaign
- Engagement advantage: micro 3–8%
- Mitigation: long-tail + first-party communities
IT infrastructure and cloud services
Reliance on major cloud providers (AWS ~32%, Microsoft Azure ~22%, Google Cloud ~11% — combined ~65% of market in 2024) and extensive API ecosystems creates embedded dependencies that raise switching costs. Usage-based pricing and data egress fees can escalate costs as workloads scale, while security and compliance requirements further lock in vendors. Multicloud strategies and open-source components (Kubernetes, Linux) provide negotiation leverage.
- Concentration: 65% market share (2024)
- Cost risk: usage/egress fees escalate with scale
- Lock-in: compliance/security amplify stickiness
- Leverage: multicloud + open-source reduce dependence
Platform & cloud concentration squeeze margins in $600B ad market
Major platforms (top three >60% China ad inventory) and $600B global digital ad spend (2024) give suppliers pricing and access leverage over BlueFocus. Specialized analytics/CDP/DSP concentration, 6–12 month integrations and 15–30% hiring premiums raise switching costs. Influencer market $24.1B (2024) with mega rates $100k–$1M/campaign concentrates creative supply. Cloud concentration (AWS 32%/Azure 22%/GCP 11% =65%) adds vendor lock-in risk.
| Metric | 2024 |
|---|---|
| Global digital ad spend | $600B |
| China top3 ad inventory | >60% |
| Influencer market | $24.1B |
| Mega creator rates | $100k–$1M |
| Cloud share (AWS/Azure/GCP) | 32/22/11 (65% total) |
| Hiring premium | 15–30% |
| Attrition | >25% |
What is included in the product
Detailed Word Document
Tailored Porter’s Five Forces analysis for BlueFocus, uncovering competitive drivers, buyer and supplier power, threats from substitutes and new entrants, and strategic barriers that protect incumbents; includes insights on disruptive forces and market dynamics to inform pricing, positioning, and growth strategies.
Customizable Excel Spreadsheet
A clear one-sheet summary of all five forces—instantly exposing BlueFocus’s competitive pain points and strategic levers for fast, confident decision-making.
Customers Bargaining Power
Large global and Chinese brand advertisers
Large global and Chinese brand advertisers control significant budgets and can demand custom terms, with agency relationships often driven by clients representing over 50% of retained revenue in 2024. Their scale enables rate benchmarking and multi‑year pricing pressure, and they increasingly require measurable ROI and coordinated cross‑market campaigns. Strategic partnerships with agencies can pivot negotiations from price to integrated value offerings.
Frequent multi-agency competitive pitches
Clients rebid scopes frequently, with enterprise accounts moving to formal pitches every 12–24 months in 2024, eroding agency pricing power and forcing fee discounts. Extended pitch cycles raise cost-to-serve and compress margins, with agencies reporting up to 8–12% higher acquisition costs per new brief. Incumbency is less protective as procurement formalizes scorecards, while differentiated case studies and proprietary data assets can lift win rates by ~15% in 2024.
Data transparency and performance accountability
Buyers demand granular reporting, brand safety and clear attribution, and with global ad spend forecast at about $885bn in 2024 buyers exercise fee scrutiny and push outcome-based contracts that shift risk to agencies. Underperformance often leads to rapid scope reductions or termination within quarters, while fee renegotiations rise—outcome clauses reported up ~20% in 2024 RFPs. Robust MMM/MTA capabilities defend pricing and limit churn.
Low switching costs across commoditized services
Low switching costs persist as media buying and basic creative are easily swapped; programmatic channels accounted for over 75% of global display ad buying in 2024, lowering client lock-in. Standardized platforms and APIs compress differentiation, while knowledge-transfer clauses further smooth transitions. Conversely, embedded teams and martech integration raise switching barriers by deepening operational ties.
- Media commoditization — programmatic >75% (2024)
- Low technical lock-in — standardized tools/APIs
- Contractual ease — knowledge-transfer clauses
- Higher barrier — embedded teams + martech integration
Insourcing and hybrid operating models
Clients increasingly insource strategy, data, or creative pods to cut agency fees, shifting bargaining power toward buyers and compressing traditional retainers while creating demand for targeted, high-value engagements.
Hybrid models reallocate scope to specialized agency tasks, enabling agencies like BlueFocus to win project-based work but face margin pressure on long-term contracts.
Co-location, capability-building services, and embedded teams help maintain relevance by offering integration that pure insourcing lacks.
- insourcing reduces retainer revenue
- hybrid models increase project-work share
- co-location preserves agency stickiness
Buyers leverage: top clients >50%, ad spend $885bn
Buyers hold strong leverage: top clients account for >50% of retained revenue and global ad spend hit $885bn in 2024. Rebids occur every 12–24 months, outcome clauses rose ~20% and acquisition costs rose 8–12%, while programmatic >75% lowers lock-in; insourcing and embedded teams shift power to buyers but martech integration raises switching costs.
| Metric | 2024 |
|---|---|
| Global ad spend | $885bn |
| Programmatic share | >75% |
| Outcome clauses | +20% |
| Acquisition cost | +8–12% |
Same Document Delivered
BlueFocus Porter's Five Forces Analysis
This preview shows the exact BlueFocus Porter’s Five Forces analysis you’ll receive immediately after purchase—fully formatted, professionally written, and ready for use. No placeholders or mockups: the document displayed is the deliverable you’ll download instantly upon payment. It contains the complete competitive assessment and actionable insights for strategic decision-making.











