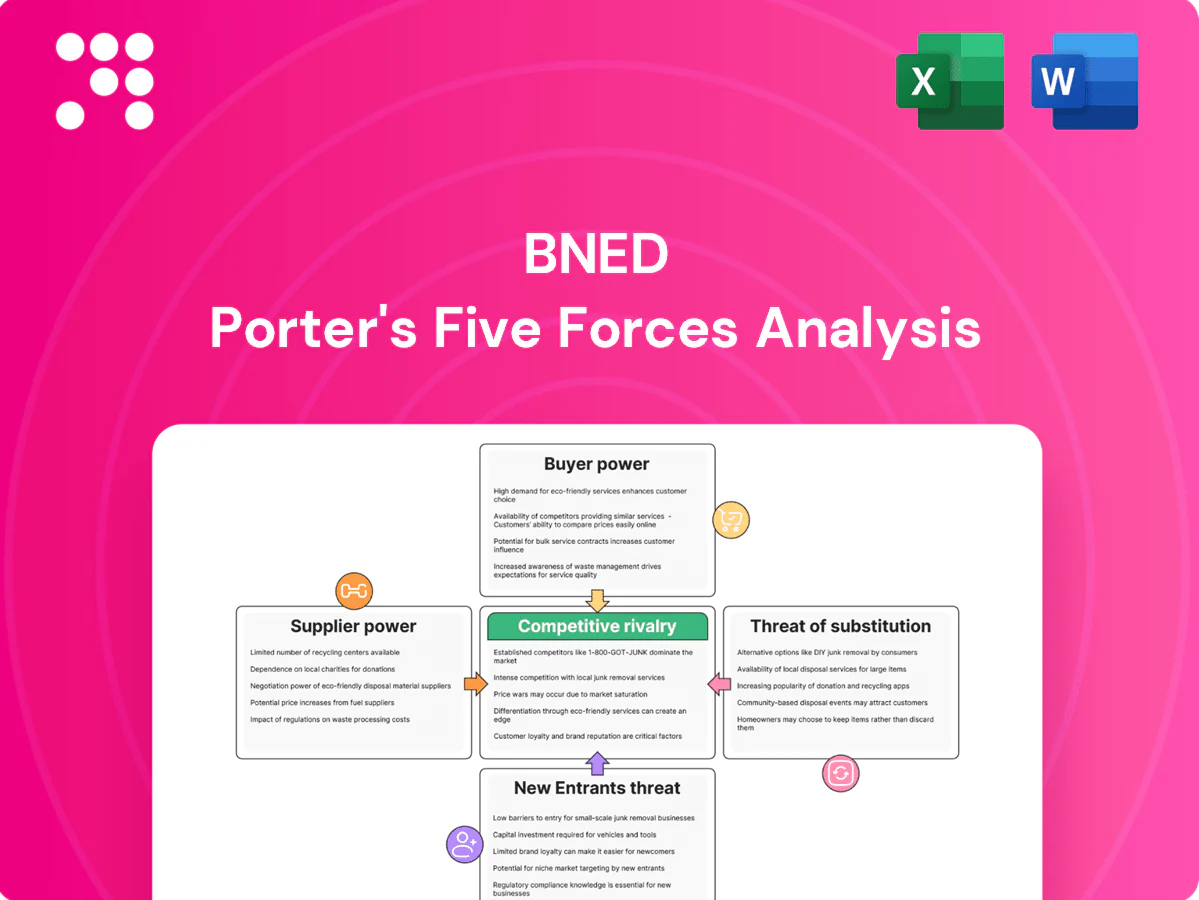
BNED Porter's Five Forces Analysis

Go Beyond the Preview—Access the Full Strategic Report
This snapshot highlights BNED’s competitive pressures—supplier leverage, buyer power, rivalry intensity and substitute risks—but only scratches the surface. Unlock the full Porter’s Five Forces Analysis to get force-by-force ratings, visuals, and strategic implications tailored to BNED. Purchase the complete report for actionable insights to inform investment or strategy decisions.
Suppliers Bargaining Power

Concentrated textbook publishers
Core course content is concentrated in a few large publishers—Pearson, Cengage and McGraw Hill—which together control roughly 70% of the higher-education market, giving them outsized leverage on pricing, access and contract terms. Digital licensing and DRM tie availability and release timing to publisher platforms, limiting BNED’s ability to substitute titles. BNED must negotiate volume discounts but faces few alternatives for flagship texts, which can compress margins and constrain pricing flexibility.
Digital platform and tech vendors
Learning platforms, e-commerce tech and payment providers can exert power through integration lock-in and switching frictions, with payment fees typically 1.5–3.5% and uptime SLAs commonly set at 99.9%+, making API access and data portability key negotiation levers. Vendor consolidation in edtech raises pricing pressure and limits customization. BNED mitigates risk via multi-vendor architectures and growing internal engineering capabilities.

Branded merchandise suppliers
Branded logo apparel and general merchandise depend on apparel brands and licensed manufacturers, with seasonality and fast fashion giving suppliers of hot SKUs outsized leverage during back-to-school peaks. University licensing fees typically run in the mid-single digits to low-teens percent (commonly 8–12%), adding compliance cost and narrowing vendor choice. BNED mitigates supplier power via private-label assortments and multi-year sourcing agreements to lower concentration risk.

Distribution and logistics partners
Distribution and logistics partners shape BNEDs cost-to-serve: freight, last-mile, and campus delivery capacity drive delivery costs and service levels, while fuel surcharges and tight carrier capacity raise supplier clout and volatility. Time-sensitive academic calendars magnify delivery risks and penalties around term starts. BNED mitigates exposure via scale contracts and diversified carrier networks.
- Freight and last-mile capacity affect costs
- Fuel surcharges increase supplier leverage
- Academic peaks raise delivery risk
- Scale contracts and carrier diversification reduce exposure
University licensors and landlords
Campus store operations hinge on exclusive contracts, fees and space terms set by institutions, with universities able to dictate revenue shares, service standards and data reporting; BNED reported approximately $1.09 billion in net revenue for fiscal 2024, underscoring exposure to licensor terms. Renewal risk gives licensors bargaining leverage at contract end, while strong performance and inclusive access programs help BNED retain favorable terms.
- Institutions set revenue share and fees
- Data/reporting mandates affect margins
- Contract renewal risk concentrates leverage
- Inclusive access boosts retention and negotiating power
Publishers control ~70% of market; licensing and fees compress academic seller margins
Large publishers (Pearson/Cengage/McGraw Hill ~70% share) and DRM-linked digital licensing give suppliers strong leverage, constraining BNED pricing and margins; payment fees run ~1.5–3.5% and logistics surcharges spike at academic peaks. Universities set revenue shares/fees (commonly 8–12%) and renewal risk concentrates bargaining power; BNED reported $1.09B net revenue FY2024.
| Metric | Value |
|---|---|
| Top publishers share | ~70% |
| BNED net revenue | $1.09B (FY2024) |
| Payment fees | 1.5–3.5% |
| University licensing fees | 8–12% |
What is included in the product
 Detailed Word Document
Porter’s Five Forces analysis tailored for BNED uncovers competitive intensity, buyer and supplier leverage, threats from substitutes and new entrants, and strategic barriers protecting its market position, highlighting disruptive trends and pricing pressures that shape profitability.

 Customizable Excel Spreadsheet
A compact BNED Porter's Five Forces one-sheet that instantly maps competitive pressure with an editable spider chart—customize force levels, swap in your data and notes, and drop directly into pitch decks or Excel dashboards without macros for quick strategic decisions.
Customers Bargaining Power

Price-sensitive students
Students exhibit high price elasticity for course materials, shopping aggressively across marketplaces and favoring rentals, used books, and digital options that intensify price pressure. Transparent online pricing and marketplace aggregators erode BNED’s ability to sustain premiums. Loyalty now depends on convenience, speed, and bundled savings like inclusive access or bundled shipping discounts.
Faculty adoption authority
Faculty determine required materials and thus directly drive student purchases, giving them high bargaining power. In 2024 OER and custom courseware adoption accelerated, displacing traditional texts and pressuring list-price sales. Building faculty relationships is critical to steer adoptions toward BNED-supported formats. Department-wide adoptions can move substantial volume, affecting revenue per term for campus retail and digital channels.

Institutional procurement and admins
Universities, among roughly 4,000 US colleges and universities, negotiate store contracts, inclusive access and affordability programs to lower total cost of ownership while demanding data insights and equitable access outcomes. Contractual KPIs on adoption, cost-per-student and service levels give buyers strong leverage over pricing. By aligning to institutional objectives and KPIs, BNED can secure multi-year contracts that lock in recurring revenue.

Multi-channel comparison shopping
Buyers can compare Amazon, publishers, and peer-to-peer options, with Amazon estimated at ~39% of US e-commerce in 2024 (eMarketer). Frictionless returns and 2-day delivery expectations raise service baselines. Transparency compresses BNED margins on commoditized SKUs, forcing differentiation via convenience, guaranteed availability, and campus integration.
- Amazon ~39% US e-commerce (2024)
- Returns/fast ship raise customer expectations
- Margins compressed on commoditized SKUs
- Differentiate: convenience, availability, campus ties
Group buying and aid-linked purchasing
Group buying and aid-linked purchasing concentrate demand during financial aid disbursement windows and inclusive access cohorts, increasing institutional bargaining power over program pricing. Integration into student billing and LMS reduces end-user switching and boosts retention. BNED can trade steeper discounts for predictable scale and cash-flow.
- Concentrated volume raises negotiation leverage
- Billing/LMS integration limits switching
- Discounts can buy scale and predictability
Students favor rentals/digital; college inclusive access and LMS billing squeeze margins
Students highly price-sensitive, favor rentals/used/digital; Amazon ~39% US e‑commerce (2024) and fast shipping/returns compress BNED margins. Faculty and OER drive adoptions, reducing list-price sales; ~4,000 US colleges negotiate KPIs and inclusive access. Billing/LMS integration concentrates aid-window volume, raising institutional leverage while enabling multi-year predictable revenue.
| Metric | 2024 |
|---|---|
| Amazon US e‑commerce share | ~39% |
| US colleges | ~4,000 |
| Key buyer levers | Inclusive access, KPIs, billing/LMS |
What You See Is What You Get
BNED Porter's Five Forces Analysis
This BNED Porter's Five Forces Analysis preview is the exact, fully formatted document you’ll receive after purchase. It contains the complete strategic assessment—no placeholders or mockups—and is ready for immediate download and use. Purchase grants instant access to this same file, prepared for presentation or decision-making.

Go Beyond the Preview—Access the Full Strategic Report
This snapshot highlights BNED’s competitive pressures—supplier leverage, buyer power, rivalry intensity and substitute risks—but only scratches the surface. Unlock the full Porter’s Five Forces Analysis to get force-by-force ratings, visuals, and strategic implications tailored to BNED. Purchase the complete report for actionable insights to inform investment or strategy decisions.
Suppliers Bargaining Power
Concentrated textbook publishers
Core course content is concentrated in a few large publishers—Pearson, Cengage and McGraw Hill—which together control roughly 70% of the higher-education market, giving them outsized leverage on pricing, access and contract terms. Digital licensing and DRM tie availability and release timing to publisher platforms, limiting BNED’s ability to substitute titles. BNED must negotiate volume discounts but faces few alternatives for flagship texts, which can compress margins and constrain pricing flexibility.
Digital platform and tech vendors
Learning platforms, e-commerce tech and payment providers can exert power through integration lock-in and switching frictions, with payment fees typically 1.5–3.5% and uptime SLAs commonly set at 99.9%+, making API access and data portability key negotiation levers. Vendor consolidation in edtech raises pricing pressure and limits customization. BNED mitigates risk via multi-vendor architectures and growing internal engineering capabilities.
Branded merchandise suppliers
Branded logo apparel and general merchandise depend on apparel brands and licensed manufacturers, with seasonality and fast fashion giving suppliers of hot SKUs outsized leverage during back-to-school peaks. University licensing fees typically run in the mid-single digits to low-teens percent (commonly 8–12%), adding compliance cost and narrowing vendor choice. BNED mitigates supplier power via private-label assortments and multi-year sourcing agreements to lower concentration risk.
Distribution and logistics partners
Distribution and logistics partners shape BNEDs cost-to-serve: freight, last-mile, and campus delivery capacity drive delivery costs and service levels, while fuel surcharges and tight carrier capacity raise supplier clout and volatility. Time-sensitive academic calendars magnify delivery risks and penalties around term starts. BNED mitigates exposure via scale contracts and diversified carrier networks.
- Freight and last-mile capacity affect costs
- Fuel surcharges increase supplier leverage
- Academic peaks raise delivery risk
- Scale contracts and carrier diversification reduce exposure
University licensors and landlords
Campus store operations hinge on exclusive contracts, fees and space terms set by institutions, with universities able to dictate revenue shares, service standards and data reporting; BNED reported approximately $1.09 billion in net revenue for fiscal 2024, underscoring exposure to licensor terms. Renewal risk gives licensors bargaining leverage at contract end, while strong performance and inclusive access programs help BNED retain favorable terms.
- Institutions set revenue share and fees
- Data/reporting mandates affect margins
- Contract renewal risk concentrates leverage
- Inclusive access boosts retention and negotiating power
Publishers control ~70% of market; licensing and fees compress academic seller margins
Large publishers (Pearson/Cengage/McGraw Hill ~70% share) and DRM-linked digital licensing give suppliers strong leverage, constraining BNED pricing and margins; payment fees run ~1.5–3.5% and logistics surcharges spike at academic peaks. Universities set revenue shares/fees (commonly 8–12%) and renewal risk concentrates bargaining power; BNED reported $1.09B net revenue FY2024.
| Metric | Value |
|---|---|
| Top publishers share | ~70% |
| BNED net revenue | $1.09B (FY2024) |
| Payment fees | 1.5–3.5% |
| University licensing fees | 8–12% |
What is included in the product
Detailed Word Document
Porter’s Five Forces analysis tailored for BNED uncovers competitive intensity, buyer and supplier leverage, threats from substitutes and new entrants, and strategic barriers protecting its market position, highlighting disruptive trends and pricing pressures that shape profitability.
Customizable Excel Spreadsheet
A compact BNED Porter's Five Forces one-sheet that instantly maps competitive pressure with an editable spider chart—customize force levels, swap in your data and notes, and drop directly into pitch decks or Excel dashboards without macros for quick strategic decisions.
Customers Bargaining Power
Price-sensitive students
Students exhibit high price elasticity for course materials, shopping aggressively across marketplaces and favoring rentals, used books, and digital options that intensify price pressure. Transparent online pricing and marketplace aggregators erode BNED’s ability to sustain premiums. Loyalty now depends on convenience, speed, and bundled savings like inclusive access or bundled shipping discounts.
Faculty adoption authority
Faculty determine required materials and thus directly drive student purchases, giving them high bargaining power. In 2024 OER and custom courseware adoption accelerated, displacing traditional texts and pressuring list-price sales. Building faculty relationships is critical to steer adoptions toward BNED-supported formats. Department-wide adoptions can move substantial volume, affecting revenue per term for campus retail and digital channels.
Institutional procurement and admins
Universities, among roughly 4,000 US colleges and universities, negotiate store contracts, inclusive access and affordability programs to lower total cost of ownership while demanding data insights and equitable access outcomes. Contractual KPIs on adoption, cost-per-student and service levels give buyers strong leverage over pricing. By aligning to institutional objectives and KPIs, BNED can secure multi-year contracts that lock in recurring revenue.
Multi-channel comparison shopping
Buyers can compare Amazon, publishers, and peer-to-peer options, with Amazon estimated at ~39% of US e-commerce in 2024 (eMarketer). Frictionless returns and 2-day delivery expectations raise service baselines. Transparency compresses BNED margins on commoditized SKUs, forcing differentiation via convenience, guaranteed availability, and campus integration.
- Amazon ~39% US e-commerce (2024)
- Returns/fast ship raise customer expectations
- Margins compressed on commoditized SKUs
- Differentiate: convenience, availability, campus ties
Group buying and aid-linked purchasing
Group buying and aid-linked purchasing concentrate demand during financial aid disbursement windows and inclusive access cohorts, increasing institutional bargaining power over program pricing. Integration into student billing and LMS reduces end-user switching and boosts retention. BNED can trade steeper discounts for predictable scale and cash-flow.
- Concentrated volume raises negotiation leverage
- Billing/LMS integration limits switching
- Discounts can buy scale and predictability
Students favor rentals/digital; college inclusive access and LMS billing squeeze margins
Students highly price-sensitive, favor rentals/used/digital; Amazon ~39% US e‑commerce (2024) and fast shipping/returns compress BNED margins. Faculty and OER drive adoptions, reducing list-price sales; ~4,000 US colleges negotiate KPIs and inclusive access. Billing/LMS integration concentrates aid-window volume, raising institutional leverage while enabling multi-year predictable revenue.
| Metric | 2024 |
|---|---|
| Amazon US e‑commerce share | ~39% |
| US colleges | ~4,000 |
| Key buyer levers | Inclusive access, KPIs, billing/LMS |
What You See Is What You Get
BNED Porter's Five Forces Analysis
This BNED Porter's Five Forces Analysis preview is the exact, fully formatted document you’ll receive after purchase. It contains the complete strategic assessment—no placeholders or mockups—and is ready for immediate download and use. Purchase grants instant access to this same file, prepared for presentation or decision-making.
Description
Go Beyond the Preview—Access the Full Strategic Report
This snapshot highlights BNED’s competitive pressures—supplier leverage, buyer power, rivalry intensity and substitute risks—but only scratches the surface. Unlock the full Porter’s Five Forces Analysis to get force-by-force ratings, visuals, and strategic implications tailored to BNED. Purchase the complete report for actionable insights to inform investment or strategy decisions.
Suppliers Bargaining Power
Concentrated textbook publishers
Core course content is concentrated in a few large publishers—Pearson, Cengage and McGraw Hill—which together control roughly 70% of the higher-education market, giving them outsized leverage on pricing, access and contract terms. Digital licensing and DRM tie availability and release timing to publisher platforms, limiting BNED’s ability to substitute titles. BNED must negotiate volume discounts but faces few alternatives for flagship texts, which can compress margins and constrain pricing flexibility.
Digital platform and tech vendors
Learning platforms, e-commerce tech and payment providers can exert power through integration lock-in and switching frictions, with payment fees typically 1.5–3.5% and uptime SLAs commonly set at 99.9%+, making API access and data portability key negotiation levers. Vendor consolidation in edtech raises pricing pressure and limits customization. BNED mitigates risk via multi-vendor architectures and growing internal engineering capabilities.
Branded merchandise suppliers
Branded logo apparel and general merchandise depend on apparel brands and licensed manufacturers, with seasonality and fast fashion giving suppliers of hot SKUs outsized leverage during back-to-school peaks. University licensing fees typically run in the mid-single digits to low-teens percent (commonly 8–12%), adding compliance cost and narrowing vendor choice. BNED mitigates supplier power via private-label assortments and multi-year sourcing agreements to lower concentration risk.
Distribution and logistics partners
Distribution and logistics partners shape BNEDs cost-to-serve: freight, last-mile, and campus delivery capacity drive delivery costs and service levels, while fuel surcharges and tight carrier capacity raise supplier clout and volatility. Time-sensitive academic calendars magnify delivery risks and penalties around term starts. BNED mitigates exposure via scale contracts and diversified carrier networks.
- Freight and last-mile capacity affect costs
- Fuel surcharges increase supplier leverage
- Academic peaks raise delivery risk
- Scale contracts and carrier diversification reduce exposure
University licensors and landlords
Campus store operations hinge on exclusive contracts, fees and space terms set by institutions, with universities able to dictate revenue shares, service standards and data reporting; BNED reported approximately $1.09 billion in net revenue for fiscal 2024, underscoring exposure to licensor terms. Renewal risk gives licensors bargaining leverage at contract end, while strong performance and inclusive access programs help BNED retain favorable terms.
- Institutions set revenue share and fees
- Data/reporting mandates affect margins
- Contract renewal risk concentrates leverage
- Inclusive access boosts retention and negotiating power
Publishers control ~70% of market; licensing and fees compress academic seller margins
Large publishers (Pearson/Cengage/McGraw Hill ~70% share) and DRM-linked digital licensing give suppliers strong leverage, constraining BNED pricing and margins; payment fees run ~1.5–3.5% and logistics surcharges spike at academic peaks. Universities set revenue shares/fees (commonly 8–12%) and renewal risk concentrates bargaining power; BNED reported $1.09B net revenue FY2024.
| Metric | Value |
|---|---|
| Top publishers share | ~70% |
| BNED net revenue | $1.09B (FY2024) |
| Payment fees | 1.5–3.5% |
| University licensing fees | 8–12% |
What is included in the product
Detailed Word Document
Porter’s Five Forces analysis tailored for BNED uncovers competitive intensity, buyer and supplier leverage, threats from substitutes and new entrants, and strategic barriers protecting its market position, highlighting disruptive trends and pricing pressures that shape profitability.
Customizable Excel Spreadsheet
A compact BNED Porter's Five Forces one-sheet that instantly maps competitive pressure with an editable spider chart—customize force levels, swap in your data and notes, and drop directly into pitch decks or Excel dashboards without macros for quick strategic decisions.
Customers Bargaining Power
Price-sensitive students
Students exhibit high price elasticity for course materials, shopping aggressively across marketplaces and favoring rentals, used books, and digital options that intensify price pressure. Transparent online pricing and marketplace aggregators erode BNED’s ability to sustain premiums. Loyalty now depends on convenience, speed, and bundled savings like inclusive access or bundled shipping discounts.
Faculty adoption authority
Faculty determine required materials and thus directly drive student purchases, giving them high bargaining power. In 2024 OER and custom courseware adoption accelerated, displacing traditional texts and pressuring list-price sales. Building faculty relationships is critical to steer adoptions toward BNED-supported formats. Department-wide adoptions can move substantial volume, affecting revenue per term for campus retail and digital channels.
Institutional procurement and admins
Universities, among roughly 4,000 US colleges and universities, negotiate store contracts, inclusive access and affordability programs to lower total cost of ownership while demanding data insights and equitable access outcomes. Contractual KPIs on adoption, cost-per-student and service levels give buyers strong leverage over pricing. By aligning to institutional objectives and KPIs, BNED can secure multi-year contracts that lock in recurring revenue.
Multi-channel comparison shopping
Buyers can compare Amazon, publishers, and peer-to-peer options, with Amazon estimated at ~39% of US e-commerce in 2024 (eMarketer). Frictionless returns and 2-day delivery expectations raise service baselines. Transparency compresses BNED margins on commoditized SKUs, forcing differentiation via convenience, guaranteed availability, and campus integration.
- Amazon ~39% US e-commerce (2024)
- Returns/fast ship raise customer expectations
- Margins compressed on commoditized SKUs
- Differentiate: convenience, availability, campus ties
Group buying and aid-linked purchasing
Group buying and aid-linked purchasing concentrate demand during financial aid disbursement windows and inclusive access cohorts, increasing institutional bargaining power over program pricing. Integration into student billing and LMS reduces end-user switching and boosts retention. BNED can trade steeper discounts for predictable scale and cash-flow.
- Concentrated volume raises negotiation leverage
- Billing/LMS integration limits switching
- Discounts can buy scale and predictability
Students favor rentals/digital; college inclusive access and LMS billing squeeze margins
Students highly price-sensitive, favor rentals/used/digital; Amazon ~39% US e‑commerce (2024) and fast shipping/returns compress BNED margins. Faculty and OER drive adoptions, reducing list-price sales; ~4,000 US colleges negotiate KPIs and inclusive access. Billing/LMS integration concentrates aid-window volume, raising institutional leverage while enabling multi-year predictable revenue.
| Metric | 2024 |
|---|---|
| Amazon US e‑commerce share | ~39% |
| US colleges | ~4,000 |
| Key buyer levers | Inclusive access, KPIs, billing/LMS |
What You See Is What You Get
BNED Porter's Five Forces Analysis
This BNED Porter's Five Forces Analysis preview is the exact, fully formatted document you’ll receive after purchase. It contains the complete strategic assessment—no placeholders or mockups—and is ready for immediate download and use. Purchase grants instant access to this same file, prepared for presentation or decision-making.











