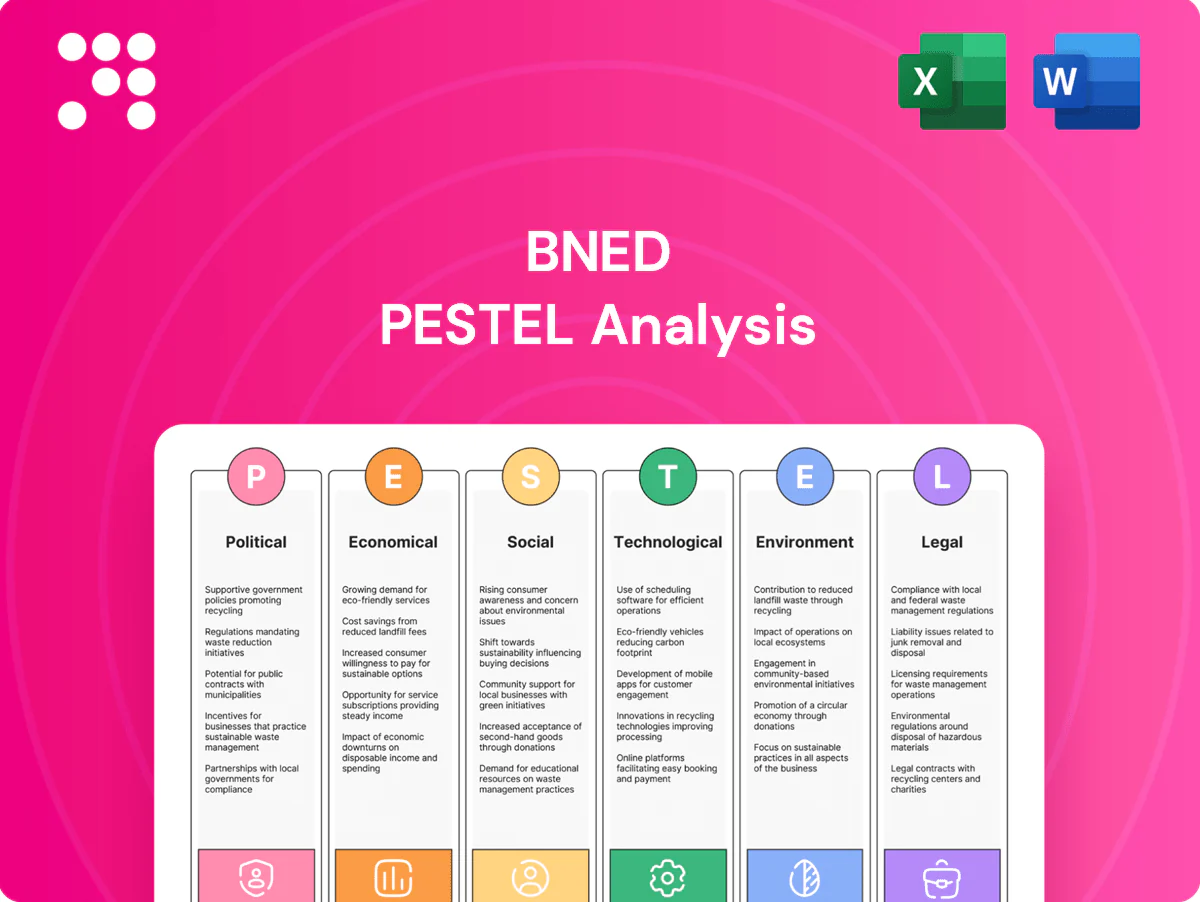
BNED PESTLE Analysis

Make Smarter Strategic Decisions with a Complete PESTEL View
Discover how political, economic, and technological forces are shaping BNED’s strategy and market position. Our PESTLE distills external risks and growth opportunities into clear, actionable insights for investors and strategic planners. Purchase the full, editable analysis for the complete report and instant download.
Political factors

Federal and state education funding
Appropriations shape student purchasing power and institutional budgets that determine bookstore contracts; Congress set the 2024-25 maximum Pell Grant at $7,395, and roughly 38% of undergraduates receive Pell, directly affecting demand for course materials. Shifts in federal and state aid change affordability programs and can push institutions toward cost-containment policies that accelerate inclusive access models. BNED must align pricing, digital offerings and institutional agreements with these evolving funding priorities to protect margins and enrollment-based revenues.
Public procurement and campus partnerships
University governance and procurement rules determine competitive bids for campus bookstore and digital services, affecting access and pricing; BNED reported roughly $1.9B revenue in FY2024, highlighting its exposure to RFP outcomes. Recent RFP updates increasingly mandate affordability and DEI goals—about 60% of institutions now weight social criteria in vendor selection—while political leadership turnover can reset priorities mid-contract. BNED needs agile, compliance-ready proposals and rapid contract-response capabilities.

Trade policy and import costs
Tariffs on paper, apparel, electronics and accessories—including U.S. Section 301 duties reaching up to 25% on many China-origin goods—compress BNED merchandise margins and force SKU repricing. Geopolitical tensions raise supply disruptions and lead times, increasing inventory holding risk. Diversifying suppliers cuts concentration risk but typically increases unit costs. BNED must hedge input-cost swings and reprice dynamically to protect margins.

Labor policy and minimum wage trends
- State/local wage hikes: rising pressure
- Federal $7.25 baseline
- Unionization ~10% (2024)
- Retail labor ~12% of sales
- Action: flexible staffing, productivity tech
Education policy on textbook affordability
Legislative pushes toward affordable course materials favor inclusive and OER options, while federal and state disclosure rules (increasingly required since 2020s) boost transparency; College Board (2023–24) estimates average annual books and supplies at $1,240, underscoring savings demand. Mandates can compress margins but drive volume through programmatic adoption; BNED should position as a compliance and savings partner.
- OER-first policy alignment
- Pricing disclosure = transparency
- Margin pressure vs volume growth
- BNED = compliance + cost-savings partner
Aid shifts and tariffs squeeze campus retail margins as procurement favors social criteria
Federal/state aid shifts (Pell max $7,395; ~38% undergrads on Pell) alter student purchasing power and drive institutions toward inclusive access; BNED must align pricing and institutional deals. Procurement and RFPs (social criteria ~60% of schools) and BNED FY2024 revenue ~$1.9B tie outcomes to contract wins. Tariffs (up to 25% on China goods), labor (~12% of sales) and unionization (~10%) squeeze margins.
| Metric | Value |
|---|---|
| Pell max (2024-25) | $7,395 |
| % undergrads on Pell | ~38% |
| BNED FY2024 revenue | ~$1.9B |
| Tariff rate (Section 301) | up to 25% |
| Retail labor (% sales) | ~12% |
| Unionization rate (2024) | ~10% |
| Avg books & supplies | $1,240 (2023–24) |
What is included in the product
 Detailed Word Document
Explores how external macro-environmental factors uniquely affect BNED across Political, Economic, Social, Technological, Environmental, and Legal dimensions, with each category expanded into detailed sub-points and firm-specific examples. Every section is data-backed, forward-looking, and formatted for executives, investors, and strategists to identify risks, opportunities, and actions tied to BNED’s market and regulatory context.

 Customizable Excel Spreadsheet
A condensed, visually segmented PESTLE summary for BNED that’s editable for region or business-line notes, easily dropped into presentations or planning sessions, and written in clear language to speed team alignment, support risk/market-position discussions, and simplify client reporting.
Economic factors

Enrollment cycles and demographics
Undergraduate and graduate enrollment directly drives demand for BNED course materials and merchandise, with BNED serving about 785 campus partners as of 2024. Regional enrollment softness can damp same-store sales, lowering on-campus revenue streams. Counter-cyclical enrollments in economic downturns can partially stabilize textbook and digital materials sales. BNED must align inventory and merchandising to cohort timing and course mix to protect margin.
Inflation and consumer spending
Input-cost inflation in paper, freight and wages has compressed BNED margins after FY2024 net sales of about $1.1B, while US core inflation remained elevated into 2024 (~3–4%), pressuring gross margins. Students’ discretionary budgets have tightened, reducing general-merchandise and tech-accessory spend and increasing substitution to rentals, used books and digital. Price sensitivity makes dynamic pricing and product-mix management critical to protect margin and revenue.

Shift to digital and subscriptions
Shift to digital and subscriptions drives recurring revenue for BNED—company reported FY2024 revenue of $1.76 billion—while inclusive access programs smooth cash flow but shift timing from upfront textbook sales to periodic license payments. Print declines have reduced high-margin impulse sales, pressuring gross margins as campus store traffic falls. Bundled pricing must prove savings versus loose digital rentals; BNED’s expansion hinges on penetration and retention rates for inclusive access and courseware.

OER and textbook deflation
Open Educational Resources (OER) increasingly displace paid textbooks in high-adoption disciplines, with OpenStax reporting over 4 million student users and >$1B in estimated savings by 2023–24; faculty adoption varies widely (≈20–30% regular use in 2024 surveys), producing uneven campus impact. BNED can monetize through services, curation, ancillary content and LMS integrations to offset textbook price compression and protect gross margins.
- OER reach: >4M students, >$1B saved (OpenStax, 2023–24)
- Faculty adoption: ≈20–30% (2024)
- Revenue levers: curation, licensing, platform services, embedded assessment
- Strategic need: value-added layers to counter deflation
Interest rates and liquidity
Higher policy rates (federal funds roughly 5.25–5.50% as of mid‑2025) lift borrowing costs for BNED, squeezing working capital and delaying discretionary tech investment; retail seasonality around campus fall terms forces precise cash planning for peak payables and receivables. Credit conditions influence supplier financing and competitiveness on campus contract bids, so BNED must sharpen inventory turns and maintain covenant headroom.
- Rate backdrop: Fed funds ~5.25–5.50% (mid‑2025)
- Seasonality: fall campus peak requires cash buffers
- Action: prioritize inventory turns and covenant headroom
Aid shifts and tariffs squeeze campus retail margins as procurement favors social criteria
Enrollment drives demand (≈785 campus partners, 2024); regional softness hits on‑campus sales. Input-cost inflation compressed margins after FY2024 net sales ≈$1.1B while FY2024 revenue was $1.76B. Digital/subscriptions and OER (>4M students, >$1B saved) shift mix and pressure print margins. Fed funds ~5.25–5.50% (mid‑2025) raises borrowing costs—prioritize inventory turns and covenant headroom.
| Metric | Value |
|---|---|
| Campus partners (2024) | ≈785 |
| FY2024 revenue | $1.76B |
| FY2024 net sales | ≈$1.1B |
| OER reach (OpenStax) | >4M students; >$1B saved |
| Fed funds (mid‑2025) | ≈5.25–5.50% |
What You See Is What You Get
BNED PESTLE Analysis
The preview shown here of the BNED PESTLE Analysis is the exact document you’ll receive after purchase—fully formatted and ready to use. No placeholders or teasers: the content, layout, and structure visible are the final file available for immediate download. Purchase delivers this same professionally structured report.

Make Smarter Strategic Decisions with a Complete PESTEL View
Discover how political, economic, and technological forces are shaping BNED’s strategy and market position. Our PESTLE distills external risks and growth opportunities into clear, actionable insights for investors and strategic planners. Purchase the full, editable analysis for the complete report and instant download.
Political factors
Federal and state education funding
Appropriations shape student purchasing power and institutional budgets that determine bookstore contracts; Congress set the 2024-25 maximum Pell Grant at $7,395, and roughly 38% of undergraduates receive Pell, directly affecting demand for course materials. Shifts in federal and state aid change affordability programs and can push institutions toward cost-containment policies that accelerate inclusive access models. BNED must align pricing, digital offerings and institutional agreements with these evolving funding priorities to protect margins and enrollment-based revenues.
Public procurement and campus partnerships
University governance and procurement rules determine competitive bids for campus bookstore and digital services, affecting access and pricing; BNED reported roughly $1.9B revenue in FY2024, highlighting its exposure to RFP outcomes. Recent RFP updates increasingly mandate affordability and DEI goals—about 60% of institutions now weight social criteria in vendor selection—while political leadership turnover can reset priorities mid-contract. BNED needs agile, compliance-ready proposals and rapid contract-response capabilities.
Trade policy and import costs
Tariffs on paper, apparel, electronics and accessories—including U.S. Section 301 duties reaching up to 25% on many China-origin goods—compress BNED merchandise margins and force SKU repricing. Geopolitical tensions raise supply disruptions and lead times, increasing inventory holding risk. Diversifying suppliers cuts concentration risk but typically increases unit costs. BNED must hedge input-cost swings and reprice dynamically to protect margins.
Labor policy and minimum wage trends
- State/local wage hikes: rising pressure
- Federal $7.25 baseline
- Unionization ~10% (2024)
- Retail labor ~12% of sales
- Action: flexible staffing, productivity tech
Education policy on textbook affordability
Legislative pushes toward affordable course materials favor inclusive and OER options, while federal and state disclosure rules (increasingly required since 2020s) boost transparency; College Board (2023–24) estimates average annual books and supplies at $1,240, underscoring savings demand. Mandates can compress margins but drive volume through programmatic adoption; BNED should position as a compliance and savings partner.
- OER-first policy alignment
- Pricing disclosure = transparency
- Margin pressure vs volume growth
- BNED = compliance + cost-savings partner
Aid shifts and tariffs squeeze campus retail margins as procurement favors social criteria
Federal/state aid shifts (Pell max $7,395; ~38% undergrads on Pell) alter student purchasing power and drive institutions toward inclusive access; BNED must align pricing and institutional deals. Procurement and RFPs (social criteria ~60% of schools) and BNED FY2024 revenue ~$1.9B tie outcomes to contract wins. Tariffs (up to 25% on China goods), labor (~12% of sales) and unionization (~10%) squeeze margins.
| Metric | Value |
|---|---|
| Pell max (2024-25) | $7,395 |
| % undergrads on Pell | ~38% |
| BNED FY2024 revenue | ~$1.9B |
| Tariff rate (Section 301) | up to 25% |
| Retail labor (% sales) | ~12% |
| Unionization rate (2024) | ~10% |
| Avg books & supplies | $1,240 (2023–24) |
What is included in the product
Detailed Word Document
Explores how external macro-environmental factors uniquely affect BNED across Political, Economic, Social, Technological, Environmental, and Legal dimensions, with each category expanded into detailed sub-points and firm-specific examples. Every section is data-backed, forward-looking, and formatted for executives, investors, and strategists to identify risks, opportunities, and actions tied to BNED’s market and regulatory context.
Customizable Excel Spreadsheet
A condensed, visually segmented PESTLE summary for BNED that’s editable for region or business-line notes, easily dropped into presentations or planning sessions, and written in clear language to speed team alignment, support risk/market-position discussions, and simplify client reporting.
Economic factors
Enrollment cycles and demographics
Undergraduate and graduate enrollment directly drives demand for BNED course materials and merchandise, with BNED serving about 785 campus partners as of 2024. Regional enrollment softness can damp same-store sales, lowering on-campus revenue streams. Counter-cyclical enrollments in economic downturns can partially stabilize textbook and digital materials sales. BNED must align inventory and merchandising to cohort timing and course mix to protect margin.
Inflation and consumer spending
Input-cost inflation in paper, freight and wages has compressed BNED margins after FY2024 net sales of about $1.1B, while US core inflation remained elevated into 2024 (~3–4%), pressuring gross margins. Students’ discretionary budgets have tightened, reducing general-merchandise and tech-accessory spend and increasing substitution to rentals, used books and digital. Price sensitivity makes dynamic pricing and product-mix management critical to protect margin and revenue.
Shift to digital and subscriptions
Shift to digital and subscriptions drives recurring revenue for BNED—company reported FY2024 revenue of $1.76 billion—while inclusive access programs smooth cash flow but shift timing from upfront textbook sales to periodic license payments. Print declines have reduced high-margin impulse sales, pressuring gross margins as campus store traffic falls. Bundled pricing must prove savings versus loose digital rentals; BNED’s expansion hinges on penetration and retention rates for inclusive access and courseware.
OER and textbook deflation
Open Educational Resources (OER) increasingly displace paid textbooks in high-adoption disciplines, with OpenStax reporting over 4 million student users and >$1B in estimated savings by 2023–24; faculty adoption varies widely (≈20–30% regular use in 2024 surveys), producing uneven campus impact. BNED can monetize through services, curation, ancillary content and LMS integrations to offset textbook price compression and protect gross margins.
- OER reach: >4M students, >$1B saved (OpenStax, 2023–24)
- Faculty adoption: ≈20–30% (2024)
- Revenue levers: curation, licensing, platform services, embedded assessment
- Strategic need: value-added layers to counter deflation
Interest rates and liquidity
Higher policy rates (federal funds roughly 5.25–5.50% as of mid‑2025) lift borrowing costs for BNED, squeezing working capital and delaying discretionary tech investment; retail seasonality around campus fall terms forces precise cash planning for peak payables and receivables. Credit conditions influence supplier financing and competitiveness on campus contract bids, so BNED must sharpen inventory turns and maintain covenant headroom.
- Rate backdrop: Fed funds ~5.25–5.50% (mid‑2025)
- Seasonality: fall campus peak requires cash buffers
- Action: prioritize inventory turns and covenant headroom
Aid shifts and tariffs squeeze campus retail margins as procurement favors social criteria
Enrollment drives demand (≈785 campus partners, 2024); regional softness hits on‑campus sales. Input-cost inflation compressed margins after FY2024 net sales ≈$1.1B while FY2024 revenue was $1.76B. Digital/subscriptions and OER (>4M students, >$1B saved) shift mix and pressure print margins. Fed funds ~5.25–5.50% (mid‑2025) raises borrowing costs—prioritize inventory turns and covenant headroom.
| Metric | Value |
|---|---|
| Campus partners (2024) | ≈785 |
| FY2024 revenue | $1.76B |
| FY2024 net sales | ≈$1.1B |
| OER reach (OpenStax) | >4M students; >$1B saved |
| Fed funds (mid‑2025) | ≈5.25–5.50% |
What You See Is What You Get
BNED PESTLE Analysis
The preview shown here of the BNED PESTLE Analysis is the exact document you’ll receive after purchase—fully formatted and ready to use. No placeholders or teasers: the content, layout, and structure visible are the final file available for immediate download. Purchase delivers this same professionally structured report.
Original: $10.00
-65%$10.00
$3.50Description
Make Smarter Strategic Decisions with a Complete PESTEL View
Discover how political, economic, and technological forces are shaping BNED’s strategy and market position. Our PESTLE distills external risks and growth opportunities into clear, actionable insights for investors and strategic planners. Purchase the full, editable analysis for the complete report and instant download.
Political factors
Federal and state education funding
Appropriations shape student purchasing power and institutional budgets that determine bookstore contracts; Congress set the 2024-25 maximum Pell Grant at $7,395, and roughly 38% of undergraduates receive Pell, directly affecting demand for course materials. Shifts in federal and state aid change affordability programs and can push institutions toward cost-containment policies that accelerate inclusive access models. BNED must align pricing, digital offerings and institutional agreements with these evolving funding priorities to protect margins and enrollment-based revenues.
Public procurement and campus partnerships
University governance and procurement rules determine competitive bids for campus bookstore and digital services, affecting access and pricing; BNED reported roughly $1.9B revenue in FY2024, highlighting its exposure to RFP outcomes. Recent RFP updates increasingly mandate affordability and DEI goals—about 60% of institutions now weight social criteria in vendor selection—while political leadership turnover can reset priorities mid-contract. BNED needs agile, compliance-ready proposals and rapid contract-response capabilities.
Trade policy and import costs
Tariffs on paper, apparel, electronics and accessories—including U.S. Section 301 duties reaching up to 25% on many China-origin goods—compress BNED merchandise margins and force SKU repricing. Geopolitical tensions raise supply disruptions and lead times, increasing inventory holding risk. Diversifying suppliers cuts concentration risk but typically increases unit costs. BNED must hedge input-cost swings and reprice dynamically to protect margins.
Labor policy and minimum wage trends
- State/local wage hikes: rising pressure
- Federal $7.25 baseline
- Unionization ~10% (2024)
- Retail labor ~12% of sales
- Action: flexible staffing, productivity tech
Education policy on textbook affordability
Legislative pushes toward affordable course materials favor inclusive and OER options, while federal and state disclosure rules (increasingly required since 2020s) boost transparency; College Board (2023–24) estimates average annual books and supplies at $1,240, underscoring savings demand. Mandates can compress margins but drive volume through programmatic adoption; BNED should position as a compliance and savings partner.
- OER-first policy alignment
- Pricing disclosure = transparency
- Margin pressure vs volume growth
- BNED = compliance + cost-savings partner
Aid shifts and tariffs squeeze campus retail margins as procurement favors social criteria
Federal/state aid shifts (Pell max $7,395; ~38% undergrads on Pell) alter student purchasing power and drive institutions toward inclusive access; BNED must align pricing and institutional deals. Procurement and RFPs (social criteria ~60% of schools) and BNED FY2024 revenue ~$1.9B tie outcomes to contract wins. Tariffs (up to 25% on China goods), labor (~12% of sales) and unionization (~10%) squeeze margins.
| Metric | Value |
|---|---|
| Pell max (2024-25) | $7,395 |
| % undergrads on Pell | ~38% |
| BNED FY2024 revenue | ~$1.9B |
| Tariff rate (Section 301) | up to 25% |
| Retail labor (% sales) | ~12% |
| Unionization rate (2024) | ~10% |
| Avg books & supplies | $1,240 (2023–24) |
What is included in the product
Detailed Word Document
Explores how external macro-environmental factors uniquely affect BNED across Political, Economic, Social, Technological, Environmental, and Legal dimensions, with each category expanded into detailed sub-points and firm-specific examples. Every section is data-backed, forward-looking, and formatted for executives, investors, and strategists to identify risks, opportunities, and actions tied to BNED’s market and regulatory context.
Customizable Excel Spreadsheet
A condensed, visually segmented PESTLE summary for BNED that’s editable for region or business-line notes, easily dropped into presentations or planning sessions, and written in clear language to speed team alignment, support risk/market-position discussions, and simplify client reporting.
Economic factors
Enrollment cycles and demographics
Undergraduate and graduate enrollment directly drives demand for BNED course materials and merchandise, with BNED serving about 785 campus partners as of 2024. Regional enrollment softness can damp same-store sales, lowering on-campus revenue streams. Counter-cyclical enrollments in economic downturns can partially stabilize textbook and digital materials sales. BNED must align inventory and merchandising to cohort timing and course mix to protect margin.
Inflation and consumer spending
Input-cost inflation in paper, freight and wages has compressed BNED margins after FY2024 net sales of about $1.1B, while US core inflation remained elevated into 2024 (~3–4%), pressuring gross margins. Students’ discretionary budgets have tightened, reducing general-merchandise and tech-accessory spend and increasing substitution to rentals, used books and digital. Price sensitivity makes dynamic pricing and product-mix management critical to protect margin and revenue.
Shift to digital and subscriptions
Shift to digital and subscriptions drives recurring revenue for BNED—company reported FY2024 revenue of $1.76 billion—while inclusive access programs smooth cash flow but shift timing from upfront textbook sales to periodic license payments. Print declines have reduced high-margin impulse sales, pressuring gross margins as campus store traffic falls. Bundled pricing must prove savings versus loose digital rentals; BNED’s expansion hinges on penetration and retention rates for inclusive access and courseware.
OER and textbook deflation
Open Educational Resources (OER) increasingly displace paid textbooks in high-adoption disciplines, with OpenStax reporting over 4 million student users and >$1B in estimated savings by 2023–24; faculty adoption varies widely (≈20–30% regular use in 2024 surveys), producing uneven campus impact. BNED can monetize through services, curation, ancillary content and LMS integrations to offset textbook price compression and protect gross margins.
- OER reach: >4M students, >$1B saved (OpenStax, 2023–24)
- Faculty adoption: ≈20–30% (2024)
- Revenue levers: curation, licensing, platform services, embedded assessment
- Strategic need: value-added layers to counter deflation
Interest rates and liquidity
Higher policy rates (federal funds roughly 5.25–5.50% as of mid‑2025) lift borrowing costs for BNED, squeezing working capital and delaying discretionary tech investment; retail seasonality around campus fall terms forces precise cash planning for peak payables and receivables. Credit conditions influence supplier financing and competitiveness on campus contract bids, so BNED must sharpen inventory turns and maintain covenant headroom.
- Rate backdrop: Fed funds ~5.25–5.50% (mid‑2025)
- Seasonality: fall campus peak requires cash buffers
- Action: prioritize inventory turns and covenant headroom
Aid shifts and tariffs squeeze campus retail margins as procurement favors social criteria
Enrollment drives demand (≈785 campus partners, 2024); regional softness hits on‑campus sales. Input-cost inflation compressed margins after FY2024 net sales ≈$1.1B while FY2024 revenue was $1.76B. Digital/subscriptions and OER (>4M students, >$1B saved) shift mix and pressure print margins. Fed funds ~5.25–5.50% (mid‑2025) raises borrowing costs—prioritize inventory turns and covenant headroom.
| Metric | Value |
|---|---|
| Campus partners (2024) | ≈785 |
| FY2024 revenue | $1.76B |
| FY2024 net sales | ≈$1.1B |
| OER reach (OpenStax) | >4M students; >$1B saved |
| Fed funds (mid‑2025) | ≈5.25–5.50% |
What You See Is What You Get
BNED PESTLE Analysis
The preview shown here of the BNED PESTLE Analysis is the exact document you’ll receive after purchase—fully formatted and ready to use. No placeholders or teasers: the content, layout, and structure visible are the final file available for immediate download. Purchase delivers this same professionally structured report.











