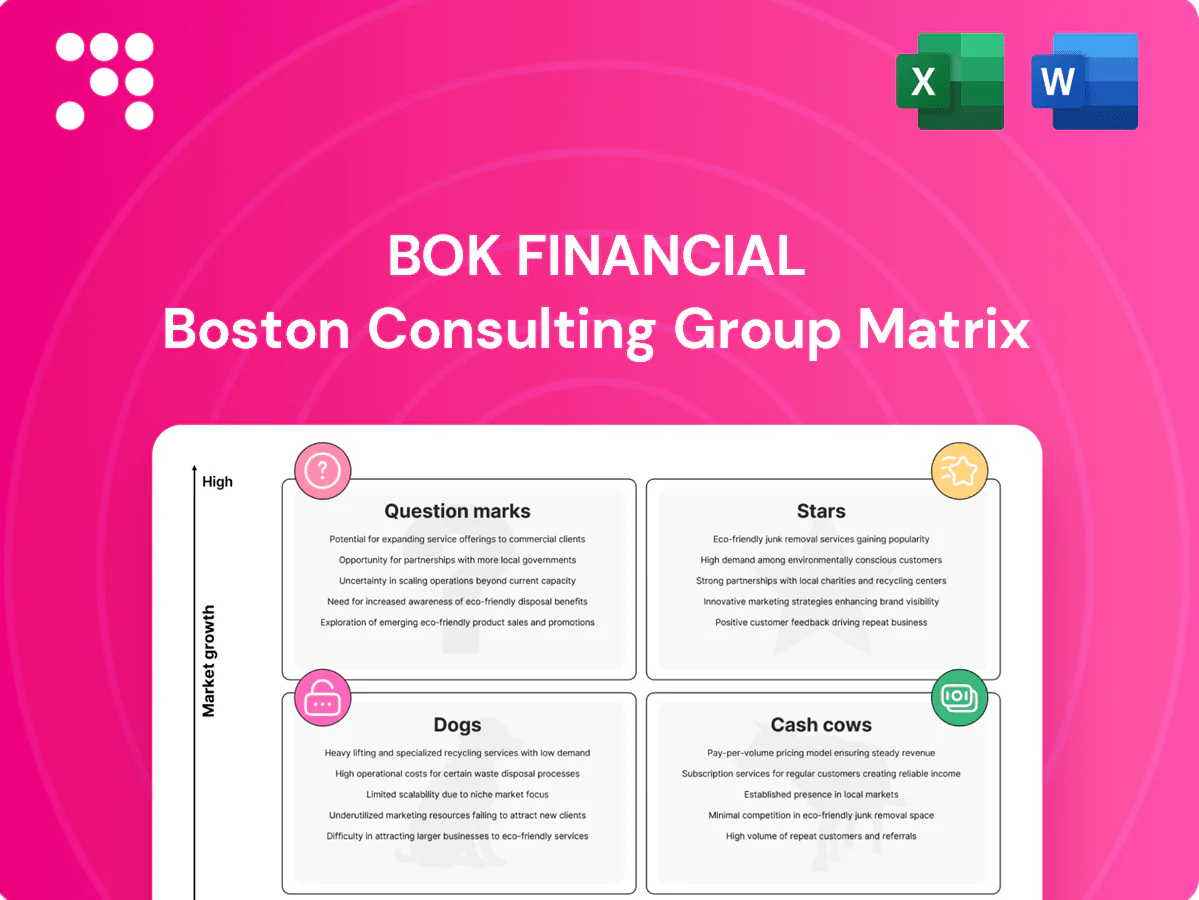
BOK Financial Boston Consulting Group Matrix

Unlock Strategic Clarity
BOK Financial’s BCG Matrix snapshot shows where its business lines sit—who’s pulling market share and who’s costing you cash—so you can stop guessing and start deciding. This preview tees up the big moves; buy the full BCG Matrix for quadrant-by-quadrant placement, data-backed recommendations, and a strategic playbook tailored to BOK’s reality. Get instant access in Word and Excel formats and a ready-to-use roadmap for reallocating capital, prioritizing growth, and trimming underperformers.
Stars

Core commercial banking in growth metros
High-growth Southwestern and Midwestern hubs—driven by metro payroll and business expansion—support BOK Financial’s core commercial banking growth, with the bank operating across roughly 15 states and about $55 billion in assets in 2024. BOKF’s middle‑market lending and deposit franchises capture that tailwind through close relationships and pricing power, lifting yields and fee income. Continued sales coverage and brand presence remain essential to stay top‑of‑wallet in competitive metros. With sustained feed, these portfolios typically graduate to higher margins as markets mature.
Treasury management and payments
Treasury management and payments—cash management, ACH, wires and merchant—scale with client growth, driving recurring fees and sticky integrations; ACH volumes topped 30 billion in 2024 (Nacha), underscoring demand. Expanding RTP rails and rising adoption make BOK a category leader where deployed, despite front‑loaded tech and onboarding spend. Payback is quick; continued investment is needed to harden share before national incumbents intensify competition.

Energy and specialized C&I niches
Deep sector expertise draws sponsors and operators to BOK Financial’s energy and specialized C&I teams because bankers who know the asset win mandates and referrals. When cycles run, balances and fee income ramp quickly; disciplined capital allocation and vigilant underwriting offset the capital intensity. With tight pricing power and repeat sponsor flows, this vertical can remain a headline growth engine for the bank.

Wealth management for business owners
Wealth management for business owners: the commercial book feeds high‑net‑worth planning, trust, and lending, with strong cross‑sell and wallet share expansion as liquidity events drive deposit and AUM inflows. 2024 performance showed double‑digit wealth AUM growth versus low‑single‑digit legacy retail peer gains. Ongoing advisor hiring and tool add‑ons compound client capture and fee income.
- Commercial book → HNW pipelines
- Cross‑sell increases at liquidity events
- Double‑digit wealth growth (2024) vs 4–6% peers
- Hire advisors + bolt on tech = compounding scale
Mortgage servicing scale
Mortgage servicing scale is a Stars position: servicing revenue holds when originations wobble, and portfolios can grow via MSR purchases; with the Fed pausing hikes in 2024, runoff slowed and cashflow steadied. It requires tech and compliance spend, but operating leverage improves with scale—keep adding clean MSRs and defend the platform.
- Hold servicing; buy accretive MSRs
- Invest in tech/compliance
- Leverage improves with size
Southwest/Midwest metros fuel commercial growth across ~15 states and $55B assets
High‑growth Southwestern/Midwestern metros fuel BOK Financials core commercial growth across ~15 states and $55B assets (2024), lifting middle‑market lending yields and deposits. Payments and treasury scale drove ACH volumes >30B (2024), boosting sticky fee income despite tech spend. Wealth AUM grew double‑digit in 2024 vs 4–6% peers; MSR scale steadies cashflow as originations wobble.
| Metric | 2024 |
|---|---|
| Assets | $55B |
| States | ~15 |
| ACH Volumes | >30B |
| Wealth AUM Growth | Double‑digit |
What is included in the product
 Detailed Word Document
BCG Matrix breakdown of BOK Financial’s units with clear strategic moves—invest, hold or divest—per quadrant and trend context.

 Customizable Excel Spreadsheet
One-page BOK Financial BCG Matrix that clears portfolio clutter—quadrant view for fast decisions and board-ready sharing.
Cash Cows

Low‑cost core deposits
Relationship checking and operational deposits fund BOK Financial cheaply, comprising about 72% of total deposits and supporting a 2024 cost of funds near 0.35%, keeping NIM resilient. In mature markets churn is low and pricing discipline held through 2024, reducing need for promotional rates. Minimal promo spend—service-driven stickiness—lets management milk the spread while investing selectively in client experience upgrades.
Trust and custody services
Trust and custody services generate steady recurring fee income for BOK Financial, with the bank reporting roughly $61.6 billion in total assets in 2024 supporting institutional and personal mandates. Switching costs are high once assets are on platform, underpinning retention and modest mid-single-digit growth. Margins are tidy versus lending lines, so optimize processes and maintain tight client reviews to protect and slightly expand share.

Retail banking in stable legacy markets
Retail banking in stable legacy markets remains a reliable cash cow for BOK Financial: foot traffic is flat while core deposit and payment flows generate steady income, with US debit interchange averaging about $0.24 per transaction (Nilson Report 2023) and branch counts down roughly 11% since 2019 (FDIC) supporting branch pruning.
Simple consumer loans, debit fees, and account maintenance charges compound into predictable net interest and noninterest income; prior digitization keeps capex low (banking IT spend often <1% of assets), so harvest strategies can fund growth elsewhere.

Brokerage and annuity distribution
Plain-vanilla brokerage and annuity distribution monetize existing client relationships, delivering predictable trail/placement revenue with industry trail rates typically in the 0.25–1.0% annual range (2024 industry guidance). The business is mature and competitive; retention drives steady cash flow while new-sales growth is limited. Main costs are training and compliance, so BOK should maintain focus rather than chase shiny new products.
- Revenue type: recurring trails/placement
- 2024 trail range: 0.25–1.0% annually
- Cost drivers: training, compliance
- Strategy: maintain, optimize retention
Commercial real estate relationships
Commercial real estate relationships are cash cows for BOK Financial: seasoned sponsors and repeat deals sustain utilization even as 2024 U.S. CRE transaction volume remained about 30% below the 2019–21 peak, and steady fee income from swaps and hedges supplements margins. Risk‑weighted returns are well‑understood and manageable; maintain tight credit and prioritize top clients to protect franchise value.
- Seasoned sponsors
- Repeat deals
- Fee income: swaps & hedges
- 2024 CRE volume ≈30% below 2019–21 peak
- Tight credit; retain best clients
Low-cost deposits, $61.6B trust AUM, retain clients, tighten CRE credit
Low‑cost deposits (~72% of funding; 2024 cost of funds ≈0.35%) and stable retail/trail fees drive recurring cash flow; trust AUM ~$61.6B (2024) and CRE repeat sponsorships sustain margins despite CRE volume ~30% below peak; focus on retention, tight credit, selective CX investment.
| Segment | 2024 metric | Strategy |
|---|---|---|
| Deposits | 72% funding; CoF ≈0.35% | Harvest |
| Trust | $61.6B AUM | Protect/retain |
| CRE | Vol ≈-30% vs peak | Tight credit |
Delivered as Shown
BOK Financial BCG Matrix
The file you’re previewing here is the exact, final BOK Financial BCG Matrix you’ll receive after purchase. No watermarks, no demo text—just a fully formatted, ready-to-use report built for clarity and decision-making. It reflects the same analysis, layout, and charts you’ll download and edit right away. After purchase the clean file is delivered instantly to your inbox, ready for presentations, planning, or client meetings.

Unlock Strategic Clarity
BOK Financial’s BCG Matrix snapshot shows where its business lines sit—who’s pulling market share and who’s costing you cash—so you can stop guessing and start deciding. This preview tees up the big moves; buy the full BCG Matrix for quadrant-by-quadrant placement, data-backed recommendations, and a strategic playbook tailored to BOK’s reality. Get instant access in Word and Excel formats and a ready-to-use roadmap for reallocating capital, prioritizing growth, and trimming underperformers.
Stars
Core commercial banking in growth metros
High-growth Southwestern and Midwestern hubs—driven by metro payroll and business expansion—support BOK Financial’s core commercial banking growth, with the bank operating across roughly 15 states and about $55 billion in assets in 2024. BOKF’s middle‑market lending and deposit franchises capture that tailwind through close relationships and pricing power, lifting yields and fee income. Continued sales coverage and brand presence remain essential to stay top‑of‑wallet in competitive metros. With sustained feed, these portfolios typically graduate to higher margins as markets mature.
Treasury management and payments
Treasury management and payments—cash management, ACH, wires and merchant—scale with client growth, driving recurring fees and sticky integrations; ACH volumes topped 30 billion in 2024 (Nacha), underscoring demand. Expanding RTP rails and rising adoption make BOK a category leader where deployed, despite front‑loaded tech and onboarding spend. Payback is quick; continued investment is needed to harden share before national incumbents intensify competition.
Energy and specialized C&I niches
Deep sector expertise draws sponsors and operators to BOK Financial’s energy and specialized C&I teams because bankers who know the asset win mandates and referrals. When cycles run, balances and fee income ramp quickly; disciplined capital allocation and vigilant underwriting offset the capital intensity. With tight pricing power and repeat sponsor flows, this vertical can remain a headline growth engine for the bank.
Wealth management for business owners
Wealth management for business owners: the commercial book feeds high‑net‑worth planning, trust, and lending, with strong cross‑sell and wallet share expansion as liquidity events drive deposit and AUM inflows. 2024 performance showed double‑digit wealth AUM growth versus low‑single‑digit legacy retail peer gains. Ongoing advisor hiring and tool add‑ons compound client capture and fee income.
- Commercial book → HNW pipelines
- Cross‑sell increases at liquidity events
- Double‑digit wealth growth (2024) vs 4–6% peers
- Hire advisors + bolt on tech = compounding scale
Mortgage servicing scale
Mortgage servicing scale is a Stars position: servicing revenue holds when originations wobble, and portfolios can grow via MSR purchases; with the Fed pausing hikes in 2024, runoff slowed and cashflow steadied. It requires tech and compliance spend, but operating leverage improves with scale—keep adding clean MSRs and defend the platform.
- Hold servicing; buy accretive MSRs
- Invest in tech/compliance
- Leverage improves with size
Southwest/Midwest metros fuel commercial growth across ~15 states and $55B assets
High‑growth Southwestern/Midwestern metros fuel BOK Financials core commercial growth across ~15 states and $55B assets (2024), lifting middle‑market lending yields and deposits. Payments and treasury scale drove ACH volumes >30B (2024), boosting sticky fee income despite tech spend. Wealth AUM grew double‑digit in 2024 vs 4–6% peers; MSR scale steadies cashflow as originations wobble.
| Metric | 2024 |
|---|---|
| Assets | $55B |
| States | ~15 |
| ACH Volumes | >30B |
| Wealth AUM Growth | Double‑digit |
What is included in the product
Detailed Word Document
BCG Matrix breakdown of BOK Financial’s units with clear strategic moves—invest, hold or divest—per quadrant and trend context.
Customizable Excel Spreadsheet
One-page BOK Financial BCG Matrix that clears portfolio clutter—quadrant view for fast decisions and board-ready sharing.
Cash Cows
Low‑cost core deposits
Relationship checking and operational deposits fund BOK Financial cheaply, comprising about 72% of total deposits and supporting a 2024 cost of funds near 0.35%, keeping NIM resilient. In mature markets churn is low and pricing discipline held through 2024, reducing need for promotional rates. Minimal promo spend—service-driven stickiness—lets management milk the spread while investing selectively in client experience upgrades.
Trust and custody services
Trust and custody services generate steady recurring fee income for BOK Financial, with the bank reporting roughly $61.6 billion in total assets in 2024 supporting institutional and personal mandates. Switching costs are high once assets are on platform, underpinning retention and modest mid-single-digit growth. Margins are tidy versus lending lines, so optimize processes and maintain tight client reviews to protect and slightly expand share.
Retail banking in stable legacy markets
Retail banking in stable legacy markets remains a reliable cash cow for BOK Financial: foot traffic is flat while core deposit and payment flows generate steady income, with US debit interchange averaging about $0.24 per transaction (Nilson Report 2023) and branch counts down roughly 11% since 2019 (FDIC) supporting branch pruning.
Simple consumer loans, debit fees, and account maintenance charges compound into predictable net interest and noninterest income; prior digitization keeps capex low (banking IT spend often <1% of assets), so harvest strategies can fund growth elsewhere.
Brokerage and annuity distribution
Plain-vanilla brokerage and annuity distribution monetize existing client relationships, delivering predictable trail/placement revenue with industry trail rates typically in the 0.25–1.0% annual range (2024 industry guidance). The business is mature and competitive; retention drives steady cash flow while new-sales growth is limited. Main costs are training and compliance, so BOK should maintain focus rather than chase shiny new products.
- Revenue type: recurring trails/placement
- 2024 trail range: 0.25–1.0% annually
- Cost drivers: training, compliance
- Strategy: maintain, optimize retention
Commercial real estate relationships
Commercial real estate relationships are cash cows for BOK Financial: seasoned sponsors and repeat deals sustain utilization even as 2024 U.S. CRE transaction volume remained about 30% below the 2019–21 peak, and steady fee income from swaps and hedges supplements margins. Risk‑weighted returns are well‑understood and manageable; maintain tight credit and prioritize top clients to protect franchise value.
- Seasoned sponsors
- Repeat deals
- Fee income: swaps & hedges
- 2024 CRE volume ≈30% below 2019–21 peak
- Tight credit; retain best clients
Low-cost deposits, $61.6B trust AUM, retain clients, tighten CRE credit
Low‑cost deposits (~72% of funding; 2024 cost of funds ≈0.35%) and stable retail/trail fees drive recurring cash flow; trust AUM ~$61.6B (2024) and CRE repeat sponsorships sustain margins despite CRE volume ~30% below peak; focus on retention, tight credit, selective CX investment.
| Segment | 2024 metric | Strategy |
|---|---|---|
| Deposits | 72% funding; CoF ≈0.35% | Harvest |
| Trust | $61.6B AUM | Protect/retain |
| CRE | Vol ≈-30% vs peak | Tight credit |
Delivered as Shown
BOK Financial BCG Matrix
The file you’re previewing here is the exact, final BOK Financial BCG Matrix you’ll receive after purchase. No watermarks, no demo text—just a fully formatted, ready-to-use report built for clarity and decision-making. It reflects the same analysis, layout, and charts you’ll download and edit right away. After purchase the clean file is delivered instantly to your inbox, ready for presentations, planning, or client meetings.
Description
Unlock Strategic Clarity
BOK Financial’s BCG Matrix snapshot shows where its business lines sit—who’s pulling market share and who’s costing you cash—so you can stop guessing and start deciding. This preview tees up the big moves; buy the full BCG Matrix for quadrant-by-quadrant placement, data-backed recommendations, and a strategic playbook tailored to BOK’s reality. Get instant access in Word and Excel formats and a ready-to-use roadmap for reallocating capital, prioritizing growth, and trimming underperformers.
Stars
Core commercial banking in growth metros
High-growth Southwestern and Midwestern hubs—driven by metro payroll and business expansion—support BOK Financial’s core commercial banking growth, with the bank operating across roughly 15 states and about $55 billion in assets in 2024. BOKF’s middle‑market lending and deposit franchises capture that tailwind through close relationships and pricing power, lifting yields and fee income. Continued sales coverage and brand presence remain essential to stay top‑of‑wallet in competitive metros. With sustained feed, these portfolios typically graduate to higher margins as markets mature.
Treasury management and payments
Treasury management and payments—cash management, ACH, wires and merchant—scale with client growth, driving recurring fees and sticky integrations; ACH volumes topped 30 billion in 2024 (Nacha), underscoring demand. Expanding RTP rails and rising adoption make BOK a category leader where deployed, despite front‑loaded tech and onboarding spend. Payback is quick; continued investment is needed to harden share before national incumbents intensify competition.
Energy and specialized C&I niches
Deep sector expertise draws sponsors and operators to BOK Financial’s energy and specialized C&I teams because bankers who know the asset win mandates and referrals. When cycles run, balances and fee income ramp quickly; disciplined capital allocation and vigilant underwriting offset the capital intensity. With tight pricing power and repeat sponsor flows, this vertical can remain a headline growth engine for the bank.
Wealth management for business owners
Wealth management for business owners: the commercial book feeds high‑net‑worth planning, trust, and lending, with strong cross‑sell and wallet share expansion as liquidity events drive deposit and AUM inflows. 2024 performance showed double‑digit wealth AUM growth versus low‑single‑digit legacy retail peer gains. Ongoing advisor hiring and tool add‑ons compound client capture and fee income.
- Commercial book → HNW pipelines
- Cross‑sell increases at liquidity events
- Double‑digit wealth growth (2024) vs 4–6% peers
- Hire advisors + bolt on tech = compounding scale
Mortgage servicing scale
Mortgage servicing scale is a Stars position: servicing revenue holds when originations wobble, and portfolios can grow via MSR purchases; with the Fed pausing hikes in 2024, runoff slowed and cashflow steadied. It requires tech and compliance spend, but operating leverage improves with scale—keep adding clean MSRs and defend the platform.
- Hold servicing; buy accretive MSRs
- Invest in tech/compliance
- Leverage improves with size
Southwest/Midwest metros fuel commercial growth across ~15 states and $55B assets
High‑growth Southwestern/Midwestern metros fuel BOK Financials core commercial growth across ~15 states and $55B assets (2024), lifting middle‑market lending yields and deposits. Payments and treasury scale drove ACH volumes >30B (2024), boosting sticky fee income despite tech spend. Wealth AUM grew double‑digit in 2024 vs 4–6% peers; MSR scale steadies cashflow as originations wobble.
| Metric | 2024 |
|---|---|
| Assets | $55B |
| States | ~15 |
| ACH Volumes | >30B |
| Wealth AUM Growth | Double‑digit |
What is included in the product
Detailed Word Document
BCG Matrix breakdown of BOK Financial’s units with clear strategic moves—invest, hold or divest—per quadrant and trend context.
Customizable Excel Spreadsheet
One-page BOK Financial BCG Matrix that clears portfolio clutter—quadrant view for fast decisions and board-ready sharing.
Cash Cows
Low‑cost core deposits
Relationship checking and operational deposits fund BOK Financial cheaply, comprising about 72% of total deposits and supporting a 2024 cost of funds near 0.35%, keeping NIM resilient. In mature markets churn is low and pricing discipline held through 2024, reducing need for promotional rates. Minimal promo spend—service-driven stickiness—lets management milk the spread while investing selectively in client experience upgrades.
Trust and custody services
Trust and custody services generate steady recurring fee income for BOK Financial, with the bank reporting roughly $61.6 billion in total assets in 2024 supporting institutional and personal mandates. Switching costs are high once assets are on platform, underpinning retention and modest mid-single-digit growth. Margins are tidy versus lending lines, so optimize processes and maintain tight client reviews to protect and slightly expand share.
Retail banking in stable legacy markets
Retail banking in stable legacy markets remains a reliable cash cow for BOK Financial: foot traffic is flat while core deposit and payment flows generate steady income, with US debit interchange averaging about $0.24 per transaction (Nilson Report 2023) and branch counts down roughly 11% since 2019 (FDIC) supporting branch pruning.
Simple consumer loans, debit fees, and account maintenance charges compound into predictable net interest and noninterest income; prior digitization keeps capex low (banking IT spend often <1% of assets), so harvest strategies can fund growth elsewhere.
Brokerage and annuity distribution
Plain-vanilla brokerage and annuity distribution monetize existing client relationships, delivering predictable trail/placement revenue with industry trail rates typically in the 0.25–1.0% annual range (2024 industry guidance). The business is mature and competitive; retention drives steady cash flow while new-sales growth is limited. Main costs are training and compliance, so BOK should maintain focus rather than chase shiny new products.
- Revenue type: recurring trails/placement
- 2024 trail range: 0.25–1.0% annually
- Cost drivers: training, compliance
- Strategy: maintain, optimize retention
Commercial real estate relationships
Commercial real estate relationships are cash cows for BOK Financial: seasoned sponsors and repeat deals sustain utilization even as 2024 U.S. CRE transaction volume remained about 30% below the 2019–21 peak, and steady fee income from swaps and hedges supplements margins. Risk‑weighted returns are well‑understood and manageable; maintain tight credit and prioritize top clients to protect franchise value.
- Seasoned sponsors
- Repeat deals
- Fee income: swaps & hedges
- 2024 CRE volume ≈30% below 2019–21 peak
- Tight credit; retain best clients
Low-cost deposits, $61.6B trust AUM, retain clients, tighten CRE credit
Low‑cost deposits (~72% of funding; 2024 cost of funds ≈0.35%) and stable retail/trail fees drive recurring cash flow; trust AUM ~$61.6B (2024) and CRE repeat sponsorships sustain margins despite CRE volume ~30% below peak; focus on retention, tight credit, selective CX investment.
| Segment | 2024 metric | Strategy |
|---|---|---|
| Deposits | 72% funding; CoF ≈0.35% | Harvest |
| Trust | $61.6B AUM | Protect/retain |
| CRE | Vol ≈-30% vs peak | Tight credit |
Delivered as Shown
BOK Financial BCG Matrix
The file you’re previewing here is the exact, final BOK Financial BCG Matrix you’ll receive after purchase. No watermarks, no demo text—just a fully formatted, ready-to-use report built for clarity and decision-making. It reflects the same analysis, layout, and charts you’ll download and edit right away. After purchase the clean file is delivered instantly to your inbox, ready for presentations, planning, or client meetings.











