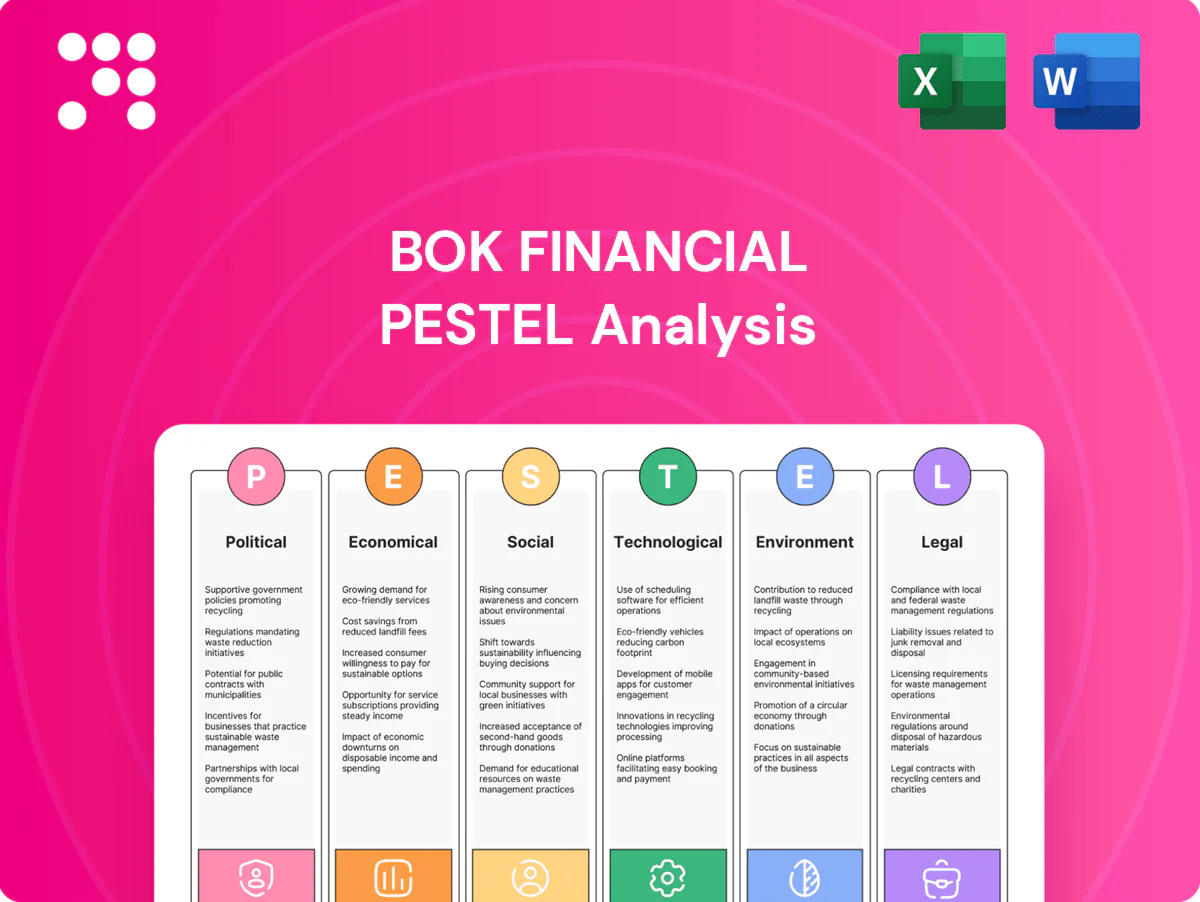
BOK Financial PESTLE Analysis

Your Shortcut to Market Insight Starts Here
Discover how political, economic, social, technological, legal and environmental forces are reshaping BOK Financial in our concise PESTLE snapshot. Use these insights to anticipate risks and spot growth opportunities. Buy the full analysis for the complete, actionable breakdown—instantly downloadable.
Political factors

Regulatory oversight dynamics
Shifts in priorities at the Federal Reserve (seven-member Board of Governors), FDIC (five-member Board) and the OCC (Comptroller) alter supervision intensity, affecting capital planning, liquidity buffers and governance expectations for regional banks. For BOK Financial, with about $55 billion in assets, changes can raise stress-testing and buffer requirements. Proactive regulatory engagement and scenario planning are required as political appointments can speed or slow rulemaking timelines.
Basel capital reforms
Basel III Endgame capital rule recalibrations—industry estimates put potential risk-weighted asset increases at roughly 10–25%—would boost required capital and could raise CET1 needs by several percentage points, pressuring BOK Financials lending appetite, pricing, and balance-sheet mix. Strategic responses include shifting to lower-RWA assets and growing fee-based income streams to defend returns. Political pushback in 2024–25 has kept final contours uncertain, complicating planning.

CRA modernization
The interagency CRA modernization final rule issued in December 2023 reshapes branch strategy, digital delivery, and community investment metrics, pushing BOK Financial (headquartered in Tulsa, OK) to align outreach and product design across Southwestern and Midwestern assessment areas; strong CRA performance supports growth and reputation, while the rule’s implementation complexity elevates compliance program demands.

State and local policy variability
State and local policy variability across Oklahoma, Texas, Colorado, Arizona and Midwest states alters taxation, incentives and sector support; Texas has no personal income tax, Colorado maintained a 4.4% flat rate in 2024, Arizona reduced rates to about 2.5% by 2024 and Oklahoma’s top rate was ~4.75%—shifts in energy, agriculture and manufacturing policy directly affect BOK Financial’s clients, requiring tailored credit and product strategies.
- Local tax/incentive divergence
- Energy/agriculture/manufacturing exposure
- Need for localized credit/product risk
- Public-private programs expand lending pipelines
Geopolitical and federal spending
Defense spending (FY2024 enacted ~$858B), the $1.2T Bipartisan Infrastructure Law and reshoring incentives such as the $52B CHIPS Act can boost regional GDP and deposit flows for BOK Financial; conversely, debt‑ceiling standoffs and shutdown risks compress lending and confidence, while Treasury market volatility pressures securities portfolios and OCI. Bank plans should model fiscal‑policy shock scenarios.
- Defense: FY2024 ~$858B
- Infrastructure: $1.2T law
- Reshoring: CHIPS $52B
- Risks: debt‑ceiling/shutdown volatility → OCI impact
Basel RWA +10-25% and fiscal programs reshape $55B bank risk
Political shifts in Fed/FDIC/OCC oversight and Basel III Endgame (RWA +10–25%) raise capital and stress-testing demands for BOK Financial (≈$55B assets). CRA modernization and state tax/reg policy across OK/TX/CO/AZ alter branch, credit and product strategies. Federal fiscal programs (FY24 defense ~$858B, Infra $1.2T, CHIPS $52B) support regional lending but debt‑ceiling risk raises market volatility.
| Item | 2024/25 Figure |
|---|---|
| Assets | $55B |
| Basel RWA impact | +10–25% |
| Defense FY24 | $858B |
| Infrastructure | $1.2T |
| CHIPS | $52B |
What is included in the product
 Detailed Word Document
Explores how Political, Economic, Social, Technological, Environmental and Legal forces uniquely shape BOK Financial, using current data and sector-specific trends to identify risks and opportunities; designed for executives, advisors and investors to support strategy, scenario planning and investor-ready materials.

 Customizable Excel Spreadsheet
A concise, visually segmented PESTLE summary of BOK Financial that’s easy to drop into presentations or share across teams, enabling quick alignment, note-taking for regional or business-line context, and focused discussion on external risks and market positioning during planning sessions.
Economic factors

Interest rate cycle sensitivity
Net interest margin at BOK Financial is highly sensitive to Federal Reserve policy (federal funds ~5.25%-5.50% in mid-2025), deposit betas (industry betas roughly 50%) and asset repricing lags; higher rates can widen NIM but increase unrealized securities losses on AFS portfolios. Falling rates may compress NIM while supporting loan growth and mortgage origination activity. Active balance-sheet hedging is therefore crucial.
Credit quality in core sectors
BOK Financials exposure to energy, CRE and agriculture links asset quality to commodity swings and cap‑rate moves; office CRE stress and tighter small‑business cash flows drove provision increases in 2024, with NPA ratio near 0.4% and reserves covering roughly 1.3% of loans, while diversified mix, disciplined underwriting and early‑warning analytics reduced loss severity.

Deposit competition and liquidity
Money market funds and fintechs have driven higher funding costs and deposit churn, with MMF assets topping about $5 trillion in 2024 and offering yields near 4–5%, pressuring banks' spreads. Stable operating deposits from commercial clients are strategic for BOK Financial as they lower volatility and funding expense. Liquidity coverage ratio requirements (LCR >=100%) and robust contingency funding plans remain essential, while deep client relationships and expanded treasury services help defend balances.

Regional growth and employment
Sun Belt metros saw stronger labor gains (~2% y/y in 2024) versus Midwest (~0.5% y/y), driving BOK Financial loan demand and merchant fee income as population inflows into Texas, Florida and Arizona fuel housing and small-business formation.
Economic slowdowns lift NPL risk and compress card, payments and wealth fees; managing local economic intelligence (market-level unemployment, payrolls, migration) refines branch and CRE market selection.
- Employment growth: Sun Belt ~2% y/y (2024)
- Midwest growth: ~0.5% y/y (2024)
- Migration: strong inflows to TX, FL, AZ (Census 2023–24)
- NPL sensitivity: higher in regional slowdowns
Housing and mortgage cycles
Mortgage origination and servicing remain cyclical as elevated rates and tight resale inventory suppress new volumes while servicing income cushions fee revenue but increases operational and credit exposure; homebuilder lending in high-growth Sun Belt metros is a durable source of loan growth. Rigorous pipeline hedging and disciplined MSR valuation are essential to manage rate volatility and capital volatility.
- Origination sensitivity to rates and inventory
- Servicing income offsets originations but adds ops risk
- Homebuilder lending growth in Sun Belt opportunities
- Pipeline hedging and strict MSR valuation
Basel RWA +10-25% and fiscal programs reshape $55B bank risk
Fed funds ~5.25–5.50% (mid‑2025) drives NIM sensitivity; higher rates widen NIM but raise AFS unrealized losses. NPA ~0.4% with reserves ~1.3% of loans after 2024 provisions; energy/CRE/agriculture exposure raises regional credit risk. MMFs ~$5tn (2024) and fintechs↑ pressure deposit beta (~50%) and funding costs. Sun Belt job growth ~2% y/y (2024) vs Midwest ~0.5%, supporting CRE and loan demand.
| Metric | Value |
|---|---|
| Fed funds (mid‑2025) | 5.25–5.50% |
| NPA ratio (2024) | ~0.4% |
| Loan reserves | ~1.3% of loans |
| MMF assets (2024) | ~$5tn |
| Sun Belt job growth (2024) | ~2% y/y |
Same Document Delivered
BOK Financial PESTLE Analysis
The BOK Financial PESTLE Analysis examines political, economic, social, technological, legal and environmental factors affecting the bank, highlighting key risks, regulatory impacts and strategic opportunities. The preview shown here is the exact document you’ll receive after purchase—fully formatted and ready to use.

Your Shortcut to Market Insight Starts Here
Discover how political, economic, social, technological, legal and environmental forces are reshaping BOK Financial in our concise PESTLE snapshot. Use these insights to anticipate risks and spot growth opportunities. Buy the full analysis for the complete, actionable breakdown—instantly downloadable.
Political factors
Regulatory oversight dynamics
Shifts in priorities at the Federal Reserve (seven-member Board of Governors), FDIC (five-member Board) and the OCC (Comptroller) alter supervision intensity, affecting capital planning, liquidity buffers and governance expectations for regional banks. For BOK Financial, with about $55 billion in assets, changes can raise stress-testing and buffer requirements. Proactive regulatory engagement and scenario planning are required as political appointments can speed or slow rulemaking timelines.
Basel capital reforms
Basel III Endgame capital rule recalibrations—industry estimates put potential risk-weighted asset increases at roughly 10–25%—would boost required capital and could raise CET1 needs by several percentage points, pressuring BOK Financials lending appetite, pricing, and balance-sheet mix. Strategic responses include shifting to lower-RWA assets and growing fee-based income streams to defend returns. Political pushback in 2024–25 has kept final contours uncertain, complicating planning.
CRA modernization
The interagency CRA modernization final rule issued in December 2023 reshapes branch strategy, digital delivery, and community investment metrics, pushing BOK Financial (headquartered in Tulsa, OK) to align outreach and product design across Southwestern and Midwestern assessment areas; strong CRA performance supports growth and reputation, while the rule’s implementation complexity elevates compliance program demands.
State and local policy variability
State and local policy variability across Oklahoma, Texas, Colorado, Arizona and Midwest states alters taxation, incentives and sector support; Texas has no personal income tax, Colorado maintained a 4.4% flat rate in 2024, Arizona reduced rates to about 2.5% by 2024 and Oklahoma’s top rate was ~4.75%—shifts in energy, agriculture and manufacturing policy directly affect BOK Financial’s clients, requiring tailored credit and product strategies.
- Local tax/incentive divergence
- Energy/agriculture/manufacturing exposure
- Need for localized credit/product risk
- Public-private programs expand lending pipelines
Geopolitical and federal spending
Defense spending (FY2024 enacted ~$858B), the $1.2T Bipartisan Infrastructure Law and reshoring incentives such as the $52B CHIPS Act can boost regional GDP and deposit flows for BOK Financial; conversely, debt‑ceiling standoffs and shutdown risks compress lending and confidence, while Treasury market volatility pressures securities portfolios and OCI. Bank plans should model fiscal‑policy shock scenarios.
- Defense: FY2024 ~$858B
- Infrastructure: $1.2T law
- Reshoring: CHIPS $52B
- Risks: debt‑ceiling/shutdown volatility → OCI impact
Basel RWA +10-25% and fiscal programs reshape $55B bank risk
Political shifts in Fed/FDIC/OCC oversight and Basel III Endgame (RWA +10–25%) raise capital and stress-testing demands for BOK Financial (≈$55B assets). CRA modernization and state tax/reg policy across OK/TX/CO/AZ alter branch, credit and product strategies. Federal fiscal programs (FY24 defense ~$858B, Infra $1.2T, CHIPS $52B) support regional lending but debt‑ceiling risk raises market volatility.
| Item | 2024/25 Figure |
|---|---|
| Assets | $55B |
| Basel RWA impact | +10–25% |
| Defense FY24 | $858B |
| Infrastructure | $1.2T |
| CHIPS | $52B |
What is included in the product
Detailed Word Document
Explores how Political, Economic, Social, Technological, Environmental and Legal forces uniquely shape BOK Financial, using current data and sector-specific trends to identify risks and opportunities; designed for executives, advisors and investors to support strategy, scenario planning and investor-ready materials.
Customizable Excel Spreadsheet
A concise, visually segmented PESTLE summary of BOK Financial that’s easy to drop into presentations or share across teams, enabling quick alignment, note-taking for regional or business-line context, and focused discussion on external risks and market positioning during planning sessions.
Economic factors
Interest rate cycle sensitivity
Net interest margin at BOK Financial is highly sensitive to Federal Reserve policy (federal funds ~5.25%-5.50% in mid-2025), deposit betas (industry betas roughly 50%) and asset repricing lags; higher rates can widen NIM but increase unrealized securities losses on AFS portfolios. Falling rates may compress NIM while supporting loan growth and mortgage origination activity. Active balance-sheet hedging is therefore crucial.
Credit quality in core sectors
BOK Financials exposure to energy, CRE and agriculture links asset quality to commodity swings and cap‑rate moves; office CRE stress and tighter small‑business cash flows drove provision increases in 2024, with NPA ratio near 0.4% and reserves covering roughly 1.3% of loans, while diversified mix, disciplined underwriting and early‑warning analytics reduced loss severity.
Deposit competition and liquidity
Money market funds and fintechs have driven higher funding costs and deposit churn, with MMF assets topping about $5 trillion in 2024 and offering yields near 4–5%, pressuring banks' spreads. Stable operating deposits from commercial clients are strategic for BOK Financial as they lower volatility and funding expense. Liquidity coverage ratio requirements (LCR >=100%) and robust contingency funding plans remain essential, while deep client relationships and expanded treasury services help defend balances.
Regional growth and employment
Sun Belt metros saw stronger labor gains (~2% y/y in 2024) versus Midwest (~0.5% y/y), driving BOK Financial loan demand and merchant fee income as population inflows into Texas, Florida and Arizona fuel housing and small-business formation.
Economic slowdowns lift NPL risk and compress card, payments and wealth fees; managing local economic intelligence (market-level unemployment, payrolls, migration) refines branch and CRE market selection.
- Employment growth: Sun Belt ~2% y/y (2024)
- Midwest growth: ~0.5% y/y (2024)
- Migration: strong inflows to TX, FL, AZ (Census 2023–24)
- NPL sensitivity: higher in regional slowdowns
Housing and mortgage cycles
Mortgage origination and servicing remain cyclical as elevated rates and tight resale inventory suppress new volumes while servicing income cushions fee revenue but increases operational and credit exposure; homebuilder lending in high-growth Sun Belt metros is a durable source of loan growth. Rigorous pipeline hedging and disciplined MSR valuation are essential to manage rate volatility and capital volatility.
- Origination sensitivity to rates and inventory
- Servicing income offsets originations but adds ops risk
- Homebuilder lending growth in Sun Belt opportunities
- Pipeline hedging and strict MSR valuation
Basel RWA +10-25% and fiscal programs reshape $55B bank risk
Fed funds ~5.25–5.50% (mid‑2025) drives NIM sensitivity; higher rates widen NIM but raise AFS unrealized losses. NPA ~0.4% with reserves ~1.3% of loans after 2024 provisions; energy/CRE/agriculture exposure raises regional credit risk. MMFs ~$5tn (2024) and fintechs↑ pressure deposit beta (~50%) and funding costs. Sun Belt job growth ~2% y/y (2024) vs Midwest ~0.5%, supporting CRE and loan demand.
| Metric | Value |
|---|---|
| Fed funds (mid‑2025) | 5.25–5.50% |
| NPA ratio (2024) | ~0.4% |
| Loan reserves | ~1.3% of loans |
| MMF assets (2024) | ~$5tn |
| Sun Belt job growth (2024) | ~2% y/y |
Same Document Delivered
BOK Financial PESTLE Analysis
The BOK Financial PESTLE Analysis examines political, economic, social, technological, legal and environmental factors affecting the bank, highlighting key risks, regulatory impacts and strategic opportunities. The preview shown here is the exact document you’ll receive after purchase—fully formatted and ready to use.
Original: $10.00
-65%$10.00
$3.50Description
Your Shortcut to Market Insight Starts Here
Discover how political, economic, social, technological, legal and environmental forces are reshaping BOK Financial in our concise PESTLE snapshot. Use these insights to anticipate risks and spot growth opportunities. Buy the full analysis for the complete, actionable breakdown—instantly downloadable.
Political factors
Regulatory oversight dynamics
Shifts in priorities at the Federal Reserve (seven-member Board of Governors), FDIC (five-member Board) and the OCC (Comptroller) alter supervision intensity, affecting capital planning, liquidity buffers and governance expectations for regional banks. For BOK Financial, with about $55 billion in assets, changes can raise stress-testing and buffer requirements. Proactive regulatory engagement and scenario planning are required as political appointments can speed or slow rulemaking timelines.
Basel capital reforms
Basel III Endgame capital rule recalibrations—industry estimates put potential risk-weighted asset increases at roughly 10–25%—would boost required capital and could raise CET1 needs by several percentage points, pressuring BOK Financials lending appetite, pricing, and balance-sheet mix. Strategic responses include shifting to lower-RWA assets and growing fee-based income streams to defend returns. Political pushback in 2024–25 has kept final contours uncertain, complicating planning.
CRA modernization
The interagency CRA modernization final rule issued in December 2023 reshapes branch strategy, digital delivery, and community investment metrics, pushing BOK Financial (headquartered in Tulsa, OK) to align outreach and product design across Southwestern and Midwestern assessment areas; strong CRA performance supports growth and reputation, while the rule’s implementation complexity elevates compliance program demands.
State and local policy variability
State and local policy variability across Oklahoma, Texas, Colorado, Arizona and Midwest states alters taxation, incentives and sector support; Texas has no personal income tax, Colorado maintained a 4.4% flat rate in 2024, Arizona reduced rates to about 2.5% by 2024 and Oklahoma’s top rate was ~4.75%—shifts in energy, agriculture and manufacturing policy directly affect BOK Financial’s clients, requiring tailored credit and product strategies.
- Local tax/incentive divergence
- Energy/agriculture/manufacturing exposure
- Need for localized credit/product risk
- Public-private programs expand lending pipelines
Geopolitical and federal spending
Defense spending (FY2024 enacted ~$858B), the $1.2T Bipartisan Infrastructure Law and reshoring incentives such as the $52B CHIPS Act can boost regional GDP and deposit flows for BOK Financial; conversely, debt‑ceiling standoffs and shutdown risks compress lending and confidence, while Treasury market volatility pressures securities portfolios and OCI. Bank plans should model fiscal‑policy shock scenarios.
- Defense: FY2024 ~$858B
- Infrastructure: $1.2T law
- Reshoring: CHIPS $52B
- Risks: debt‑ceiling/shutdown volatility → OCI impact
Basel RWA +10-25% and fiscal programs reshape $55B bank risk
Political shifts in Fed/FDIC/OCC oversight and Basel III Endgame (RWA +10–25%) raise capital and stress-testing demands for BOK Financial (≈$55B assets). CRA modernization and state tax/reg policy across OK/TX/CO/AZ alter branch, credit and product strategies. Federal fiscal programs (FY24 defense ~$858B, Infra $1.2T, CHIPS $52B) support regional lending but debt‑ceiling risk raises market volatility.
| Item | 2024/25 Figure |
|---|---|
| Assets | $55B |
| Basel RWA impact | +10–25% |
| Defense FY24 | $858B |
| Infrastructure | $1.2T |
| CHIPS | $52B |
What is included in the product
Detailed Word Document
Explores how Political, Economic, Social, Technological, Environmental and Legal forces uniquely shape BOK Financial, using current data and sector-specific trends to identify risks and opportunities; designed for executives, advisors and investors to support strategy, scenario planning and investor-ready materials.
Customizable Excel Spreadsheet
A concise, visually segmented PESTLE summary of BOK Financial that’s easy to drop into presentations or share across teams, enabling quick alignment, note-taking for regional or business-line context, and focused discussion on external risks and market positioning during planning sessions.
Economic factors
Interest rate cycle sensitivity
Net interest margin at BOK Financial is highly sensitive to Federal Reserve policy (federal funds ~5.25%-5.50% in mid-2025), deposit betas (industry betas roughly 50%) and asset repricing lags; higher rates can widen NIM but increase unrealized securities losses on AFS portfolios. Falling rates may compress NIM while supporting loan growth and mortgage origination activity. Active balance-sheet hedging is therefore crucial.
Credit quality in core sectors
BOK Financials exposure to energy, CRE and agriculture links asset quality to commodity swings and cap‑rate moves; office CRE stress and tighter small‑business cash flows drove provision increases in 2024, with NPA ratio near 0.4% and reserves covering roughly 1.3% of loans, while diversified mix, disciplined underwriting and early‑warning analytics reduced loss severity.
Deposit competition and liquidity
Money market funds and fintechs have driven higher funding costs and deposit churn, with MMF assets topping about $5 trillion in 2024 and offering yields near 4–5%, pressuring banks' spreads. Stable operating deposits from commercial clients are strategic for BOK Financial as they lower volatility and funding expense. Liquidity coverage ratio requirements (LCR >=100%) and robust contingency funding plans remain essential, while deep client relationships and expanded treasury services help defend balances.
Regional growth and employment
Sun Belt metros saw stronger labor gains (~2% y/y in 2024) versus Midwest (~0.5% y/y), driving BOK Financial loan demand and merchant fee income as population inflows into Texas, Florida and Arizona fuel housing and small-business formation.
Economic slowdowns lift NPL risk and compress card, payments and wealth fees; managing local economic intelligence (market-level unemployment, payrolls, migration) refines branch and CRE market selection.
- Employment growth: Sun Belt ~2% y/y (2024)
- Midwest growth: ~0.5% y/y (2024)
- Migration: strong inflows to TX, FL, AZ (Census 2023–24)
- NPL sensitivity: higher in regional slowdowns
Housing and mortgage cycles
Mortgage origination and servicing remain cyclical as elevated rates and tight resale inventory suppress new volumes while servicing income cushions fee revenue but increases operational and credit exposure; homebuilder lending in high-growth Sun Belt metros is a durable source of loan growth. Rigorous pipeline hedging and disciplined MSR valuation are essential to manage rate volatility and capital volatility.
- Origination sensitivity to rates and inventory
- Servicing income offsets originations but adds ops risk
- Homebuilder lending growth in Sun Belt opportunities
- Pipeline hedging and strict MSR valuation
Basel RWA +10-25% and fiscal programs reshape $55B bank risk
Fed funds ~5.25–5.50% (mid‑2025) drives NIM sensitivity; higher rates widen NIM but raise AFS unrealized losses. NPA ~0.4% with reserves ~1.3% of loans after 2024 provisions; energy/CRE/agriculture exposure raises regional credit risk. MMFs ~$5tn (2024) and fintechs↑ pressure deposit beta (~50%) and funding costs. Sun Belt job growth ~2% y/y (2024) vs Midwest ~0.5%, supporting CRE and loan demand.
| Metric | Value |
|---|---|
| Fed funds (mid‑2025) | 5.25–5.50% |
| NPA ratio (2024) | ~0.4% |
| Loan reserves | ~1.3% of loans |
| MMF assets (2024) | ~$5tn |
| Sun Belt job growth (2024) | ~2% y/y |
Same Document Delivered
BOK Financial PESTLE Analysis
The BOK Financial PESTLE Analysis examines political, economic, social, technological, legal and environmental factors affecting the bank, highlighting key risks, regulatory impacts and strategic opportunities. The preview shown here is the exact document you’ll receive after purchase—fully formatted and ready to use.











