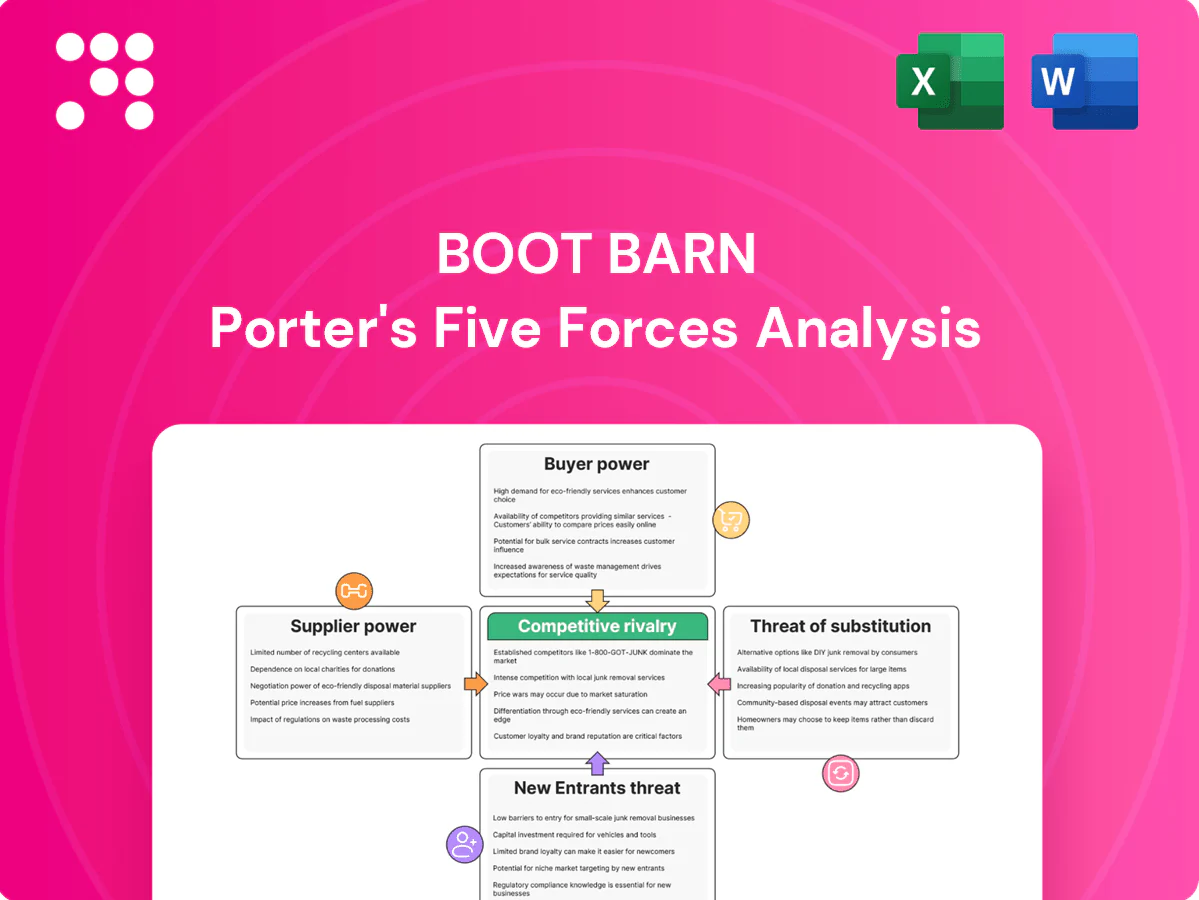
Boot Barn Porter's Five Forces Analysis

A Must-Have Tool for Decision-Makers
Boot Barn’s Porter's Five Forces snapshot highlights moderate buyer power, supplier concentration risks, rivalry from national retailers, limited substitutes for core products, and manageable barriers to entry. This brief overview outlines key competitive dynamics and market pressures. Unlock the full Porter's Five Forces Analysis to explore Boot Barn’s strategic advantages and threats in detail.
Suppliers Bargaining Power

Concentrated branded vendors
Boots and workwear depend on concentrated branded vendors—Ariat, Justin, Carhartt—creating supplier pockets of leverage across Boot Barn’s roughly 260-store footprint (2024). Limited alternatives for top SKUs can pressure wholesale pricing and allocation, while exclusive styles reduce that leverage only if retailers commit to higher volume buys. Vendor co-op marketing helps defray costs but aligns assortment with brand agendas, constraining merchandising flexibility.
Private label as counterweight
Boot Barn’s private-label push—about 40% of merchandise mix in 2024—cuts reliance on national labels and lifts margins, shifting negotiating leverage and assortment control to the retailer; however, design, QA and forecasting risks move in-house, and aggressive private-label growth risks cannibalizing branded sell-through and straining vendor relationships.

Switching costs and multi-sourcing
Most categories can be dual-sourced across multiple factories and brands, with industry data showing over 60% of footwear SKUs readily multi-sourced, which lowers switching costs and curbs supplier power. Specialized safety features, premium leathers and lasts reduce substitutability for key SKUs, concentrating supplier leverage on roughly core heritage styles. Long boot lead times (commonly 12+ weeks) still create planning rigidity and inventory risk.

Input cost pass-through
- leather/labor/freight: passed-through
- demand/brand: enables increases
- scale: negotiates timing/surcharges
- private label/forward buys: partial hedge
Capacity and allocation dynamics
Peak seasonal demand and constrained factory capacity trigger product allocations that favor retailers with scale and verified sell-through; Boot Barn reported net sales of $1.63 billion in FY2024, strengthening its priority with suppliers. Smaller vendors remain more flexible but exert less influence on allocation decisions. Diversifying sourcing geographies reduces disruption risk observed since recent global supply shocks.
- priority: scale and sell-through data
- impact: Boot Barn FY2024 net sales $1.63 billion
- small vendors: flexible but lower influence
- mitigation: geographic diversification lowers disruption risk
Moderate supplier power — $1.63B, ~40% private mix limits vendor leverage
Supplier power is moderate: concentrated branded vendors (Ariat, Justin, Carhartt) can pressure pricing on core SKUs, but Boot Barn’s $1.63B FY2024 scale and ~40% private-label mix shift leverage to the retailer. Over 60% of footwear SKUs are multi-sourced, lowering switching costs, yet 12+ week lead times and premium/leather SKUs sustain supplier leverage. Inflation (CPI ~3.4% in 2024) enabled pass-throughs, partially offset by forward buys.
| Metric | 2024 |
|---|---|
| Net sales | $1.63B |
| Private-label mix | ~40% |
| Footwear multi-source | >60% |
| Lead time | 12+ weeks |
| US CPI | ~3.4% |
What is included in the product
 Detailed Word Document
Uncovers competitive drivers, buyer and supplier power, threat of substitutes and new entrants for Boot Barn, highlighting disruptive trends, pricing pressures, and barriers that shape profitability to inform strategy and investor materials.

 Customizable Excel Spreadsheet
Clear, one-sheet Five Forces for Boot Barn—quickly spot competitive pressures and strategize pricing, supplier leverage, and new entrants to remove analysis bottlenecks and speed confident decisions.
Customers Bargaining Power

Fragmented end customers
Individual consumers and small businesses dominate Boot Barn’s mix, limiting collective negotiating power; the chain reported net sales of $1.43 billion (fiscal 2023) and sells through about 300 stores plus digital channels. Orders tend to be small-ticket and dispersed across in-store, online and wholesale, dampening buyer leverage. Price sensitivity varies—work-utility buys are less elastic than fashion buys—and loyalty programs and consistent fit reduce switching.
Omnichannel transparency
Online price comparison raises buyer leverage on commodity SKUs as omnichannel shoppers routinely shop for best price; Boot Barn reported roughly $1.2B in FY2024 net sales, highlighting scale where price sensitivity matters. In-store fit, boot shaping, and service retain customers by offsetting pure price shopping. BOPIS and real-time inventory visibility cut friction and cart abandonment. Dynamic promos must balance margin and conversion to protect profitability.

Workwear utility needs
Safety standards and job requirements make function primary over price, with compliance features (steel toe, flame resistance) in 2024 reducing willingness to trade down and preserving premium pricing. Replacement cycles for work boots average 6–18 months, creating recurring, predictable demand. Employer bulk purchases secure discounts but generally account for limited volume within retail channels.

Brand and fit loyalty
Boot fit is highly idiosyncratic, so customers who find a trusted last face high switching costs and strong brand loyalty; Boot Barn operated about 260 stores in 2024, reinforcing in-person fitting. Brand affinity for western lifestyle narrows the consideration set and exclusive styles increase retention. Online returns pose risk but are reduced by sizing tools and in-store try-ons.
- High switching cost
- Narrow consideration set
- Exclusive styles bind customers
- Returns mitigated by sizing tools and 260+ stores
Promotions and financing
Holiday discounting heightens buyer power as consumers expect markdowns; Boot Barn reported FY2024 net sales of $2.21 billion, so promo strategy materially affects margins. Clear pricing ladders and tiered good-better-best assortments protect margin mix, while financing on higher-ticket boots (average ticket roughly $240) and rising BNPL adoption (~34% of apparel transactions in 2024) reduce price pushback; excessive promo cadence trains deal-seeking behavior.
- Holiday discounts ↑ buyer power
- FY2024 net sales: $2.21B
- Avg ticket ≈ $240; financing lowers resistance
- BNPL adoption ~34% (2024)
- High promo cadence → deal-seeking
Specialty apparel retailer: $2.21B sales, ~260 stores, avg ticket $240
Customers are fragmented (individuals/small biz) with limited collective leverage; Boot Barn reported FY2024 net sales $2.21B and ~260 stores, supporting in-store fit and loyalty. Price sensitivity rises for commodity SKUs and holiday promos increase buyer power; avg ticket ≈ $240 and employer bulk buys lessen elasticity. BNPL adoption (~34% apparel 2024) and sizing tools lower returns.
| Metric | 2024 |
|---|---|
| Net sales | $2.21B |
| Stores | ~260 |
| Avg ticket | $240 |
| BNPL | ~34% |
Same Document Delivered
Boot Barn Porter's Five Forces Analysis
This Porter's Five Forces analysis of Boot Barn examines competitive rivalry, supplier and buyer power, threat of new entrants, and substitute pressures to clarify strategic risks and opportunities. The preview you see is the exact, fully formatted document you'll receive immediately after purchase—no placeholders or samples. You’ll get instant access to this ready-to-use file for download and implementation.

A Must-Have Tool for Decision-Makers
Boot Barn’s Porter's Five Forces snapshot highlights moderate buyer power, supplier concentration risks, rivalry from national retailers, limited substitutes for core products, and manageable barriers to entry. This brief overview outlines key competitive dynamics and market pressures. Unlock the full Porter's Five Forces Analysis to explore Boot Barn’s strategic advantages and threats in detail.
Suppliers Bargaining Power
Concentrated branded vendors
Boots and workwear depend on concentrated branded vendors—Ariat, Justin, Carhartt—creating supplier pockets of leverage across Boot Barn’s roughly 260-store footprint (2024). Limited alternatives for top SKUs can pressure wholesale pricing and allocation, while exclusive styles reduce that leverage only if retailers commit to higher volume buys. Vendor co-op marketing helps defray costs but aligns assortment with brand agendas, constraining merchandising flexibility.
Private label as counterweight
Boot Barn’s private-label push—about 40% of merchandise mix in 2024—cuts reliance on national labels and lifts margins, shifting negotiating leverage and assortment control to the retailer; however, design, QA and forecasting risks move in-house, and aggressive private-label growth risks cannibalizing branded sell-through and straining vendor relationships.
Switching costs and multi-sourcing
Most categories can be dual-sourced across multiple factories and brands, with industry data showing over 60% of footwear SKUs readily multi-sourced, which lowers switching costs and curbs supplier power. Specialized safety features, premium leathers and lasts reduce substitutability for key SKUs, concentrating supplier leverage on roughly core heritage styles. Long boot lead times (commonly 12+ weeks) still create planning rigidity and inventory risk.
Input cost pass-through
- leather/labor/freight: passed-through
- demand/brand: enables increases
- scale: negotiates timing/surcharges
- private label/forward buys: partial hedge
Capacity and allocation dynamics
Peak seasonal demand and constrained factory capacity trigger product allocations that favor retailers with scale and verified sell-through; Boot Barn reported net sales of $1.63 billion in FY2024, strengthening its priority with suppliers. Smaller vendors remain more flexible but exert less influence on allocation decisions. Diversifying sourcing geographies reduces disruption risk observed since recent global supply shocks.
- priority: scale and sell-through data
- impact: Boot Barn FY2024 net sales $1.63 billion
- small vendors: flexible but lower influence
- mitigation: geographic diversification lowers disruption risk
Moderate supplier power — $1.63B, ~40% private mix limits vendor leverage
Supplier power is moderate: concentrated branded vendors (Ariat, Justin, Carhartt) can pressure pricing on core SKUs, but Boot Barn’s $1.63B FY2024 scale and ~40% private-label mix shift leverage to the retailer. Over 60% of footwear SKUs are multi-sourced, lowering switching costs, yet 12+ week lead times and premium/leather SKUs sustain supplier leverage. Inflation (CPI ~3.4% in 2024) enabled pass-throughs, partially offset by forward buys.
| Metric | 2024 |
|---|---|
| Net sales | $1.63B |
| Private-label mix | ~40% |
| Footwear multi-source | >60% |
| Lead time | 12+ weeks |
| US CPI | ~3.4% |
What is included in the product
Detailed Word Document
Uncovers competitive drivers, buyer and supplier power, threat of substitutes and new entrants for Boot Barn, highlighting disruptive trends, pricing pressures, and barriers that shape profitability to inform strategy and investor materials.
Customizable Excel Spreadsheet
Clear, one-sheet Five Forces for Boot Barn—quickly spot competitive pressures and strategize pricing, supplier leverage, and new entrants to remove analysis bottlenecks and speed confident decisions.
Customers Bargaining Power
Fragmented end customers
Individual consumers and small businesses dominate Boot Barn’s mix, limiting collective negotiating power; the chain reported net sales of $1.43 billion (fiscal 2023) and sells through about 300 stores plus digital channels. Orders tend to be small-ticket and dispersed across in-store, online and wholesale, dampening buyer leverage. Price sensitivity varies—work-utility buys are less elastic than fashion buys—and loyalty programs and consistent fit reduce switching.
Omnichannel transparency
Online price comparison raises buyer leverage on commodity SKUs as omnichannel shoppers routinely shop for best price; Boot Barn reported roughly $1.2B in FY2024 net sales, highlighting scale where price sensitivity matters. In-store fit, boot shaping, and service retain customers by offsetting pure price shopping. BOPIS and real-time inventory visibility cut friction and cart abandonment. Dynamic promos must balance margin and conversion to protect profitability.
Workwear utility needs
Safety standards and job requirements make function primary over price, with compliance features (steel toe, flame resistance) in 2024 reducing willingness to trade down and preserving premium pricing. Replacement cycles for work boots average 6–18 months, creating recurring, predictable demand. Employer bulk purchases secure discounts but generally account for limited volume within retail channels.
Brand and fit loyalty
Boot fit is highly idiosyncratic, so customers who find a trusted last face high switching costs and strong brand loyalty; Boot Barn operated about 260 stores in 2024, reinforcing in-person fitting. Brand affinity for western lifestyle narrows the consideration set and exclusive styles increase retention. Online returns pose risk but are reduced by sizing tools and in-store try-ons.
- High switching cost
- Narrow consideration set
- Exclusive styles bind customers
- Returns mitigated by sizing tools and 260+ stores
Promotions and financing
Holiday discounting heightens buyer power as consumers expect markdowns; Boot Barn reported FY2024 net sales of $2.21 billion, so promo strategy materially affects margins. Clear pricing ladders and tiered good-better-best assortments protect margin mix, while financing on higher-ticket boots (average ticket roughly $240) and rising BNPL adoption (~34% of apparel transactions in 2024) reduce price pushback; excessive promo cadence trains deal-seeking behavior.
- Holiday discounts ↑ buyer power
- FY2024 net sales: $2.21B
- Avg ticket ≈ $240; financing lowers resistance
- BNPL adoption ~34% (2024)
- High promo cadence → deal-seeking
Specialty apparel retailer: $2.21B sales, ~260 stores, avg ticket $240
Customers are fragmented (individuals/small biz) with limited collective leverage; Boot Barn reported FY2024 net sales $2.21B and ~260 stores, supporting in-store fit and loyalty. Price sensitivity rises for commodity SKUs and holiday promos increase buyer power; avg ticket ≈ $240 and employer bulk buys lessen elasticity. BNPL adoption (~34% apparel 2024) and sizing tools lower returns.
| Metric | 2024 |
|---|---|
| Net sales | $2.21B |
| Stores | ~260 |
| Avg ticket | $240 |
| BNPL | ~34% |
Same Document Delivered
Boot Barn Porter's Five Forces Analysis
This Porter's Five Forces analysis of Boot Barn examines competitive rivalry, supplier and buyer power, threat of new entrants, and substitute pressures to clarify strategic risks and opportunities. The preview you see is the exact, fully formatted document you'll receive immediately after purchase—no placeholders or samples. You’ll get instant access to this ready-to-use file for download and implementation.
Original: $10.00
-65%$10.00
$3.50Description
A Must-Have Tool for Decision-Makers
Boot Barn’s Porter's Five Forces snapshot highlights moderate buyer power, supplier concentration risks, rivalry from national retailers, limited substitutes for core products, and manageable barriers to entry. This brief overview outlines key competitive dynamics and market pressures. Unlock the full Porter's Five Forces Analysis to explore Boot Barn’s strategic advantages and threats in detail.
Suppliers Bargaining Power
Concentrated branded vendors
Boots and workwear depend on concentrated branded vendors—Ariat, Justin, Carhartt—creating supplier pockets of leverage across Boot Barn’s roughly 260-store footprint (2024). Limited alternatives for top SKUs can pressure wholesale pricing and allocation, while exclusive styles reduce that leverage only if retailers commit to higher volume buys. Vendor co-op marketing helps defray costs but aligns assortment with brand agendas, constraining merchandising flexibility.
Private label as counterweight
Boot Barn’s private-label push—about 40% of merchandise mix in 2024—cuts reliance on national labels and lifts margins, shifting negotiating leverage and assortment control to the retailer; however, design, QA and forecasting risks move in-house, and aggressive private-label growth risks cannibalizing branded sell-through and straining vendor relationships.
Switching costs and multi-sourcing
Most categories can be dual-sourced across multiple factories and brands, with industry data showing over 60% of footwear SKUs readily multi-sourced, which lowers switching costs and curbs supplier power. Specialized safety features, premium leathers and lasts reduce substitutability for key SKUs, concentrating supplier leverage on roughly core heritage styles. Long boot lead times (commonly 12+ weeks) still create planning rigidity and inventory risk.
Input cost pass-through
- leather/labor/freight: passed-through
- demand/brand: enables increases
- scale: negotiates timing/surcharges
- private label/forward buys: partial hedge
Capacity and allocation dynamics
Peak seasonal demand and constrained factory capacity trigger product allocations that favor retailers with scale and verified sell-through; Boot Barn reported net sales of $1.63 billion in FY2024, strengthening its priority with suppliers. Smaller vendors remain more flexible but exert less influence on allocation decisions. Diversifying sourcing geographies reduces disruption risk observed since recent global supply shocks.
- priority: scale and sell-through data
- impact: Boot Barn FY2024 net sales $1.63 billion
- small vendors: flexible but lower influence
- mitigation: geographic diversification lowers disruption risk
Moderate supplier power — $1.63B, ~40% private mix limits vendor leverage
Supplier power is moderate: concentrated branded vendors (Ariat, Justin, Carhartt) can pressure pricing on core SKUs, but Boot Barn’s $1.63B FY2024 scale and ~40% private-label mix shift leverage to the retailer. Over 60% of footwear SKUs are multi-sourced, lowering switching costs, yet 12+ week lead times and premium/leather SKUs sustain supplier leverage. Inflation (CPI ~3.4% in 2024) enabled pass-throughs, partially offset by forward buys.
| Metric | 2024 |
|---|---|
| Net sales | $1.63B |
| Private-label mix | ~40% |
| Footwear multi-source | >60% |
| Lead time | 12+ weeks |
| US CPI | ~3.4% |
What is included in the product
Detailed Word Document
Uncovers competitive drivers, buyer and supplier power, threat of substitutes and new entrants for Boot Barn, highlighting disruptive trends, pricing pressures, and barriers that shape profitability to inform strategy and investor materials.
Customizable Excel Spreadsheet
Clear, one-sheet Five Forces for Boot Barn—quickly spot competitive pressures and strategize pricing, supplier leverage, and new entrants to remove analysis bottlenecks and speed confident decisions.
Customers Bargaining Power
Fragmented end customers
Individual consumers and small businesses dominate Boot Barn’s mix, limiting collective negotiating power; the chain reported net sales of $1.43 billion (fiscal 2023) and sells through about 300 stores plus digital channels. Orders tend to be small-ticket and dispersed across in-store, online and wholesale, dampening buyer leverage. Price sensitivity varies—work-utility buys are less elastic than fashion buys—and loyalty programs and consistent fit reduce switching.
Omnichannel transparency
Online price comparison raises buyer leverage on commodity SKUs as omnichannel shoppers routinely shop for best price; Boot Barn reported roughly $1.2B in FY2024 net sales, highlighting scale where price sensitivity matters. In-store fit, boot shaping, and service retain customers by offsetting pure price shopping. BOPIS and real-time inventory visibility cut friction and cart abandonment. Dynamic promos must balance margin and conversion to protect profitability.
Workwear utility needs
Safety standards and job requirements make function primary over price, with compliance features (steel toe, flame resistance) in 2024 reducing willingness to trade down and preserving premium pricing. Replacement cycles for work boots average 6–18 months, creating recurring, predictable demand. Employer bulk purchases secure discounts but generally account for limited volume within retail channels.
Brand and fit loyalty
Boot fit is highly idiosyncratic, so customers who find a trusted last face high switching costs and strong brand loyalty; Boot Barn operated about 260 stores in 2024, reinforcing in-person fitting. Brand affinity for western lifestyle narrows the consideration set and exclusive styles increase retention. Online returns pose risk but are reduced by sizing tools and in-store try-ons.
- High switching cost
- Narrow consideration set
- Exclusive styles bind customers
- Returns mitigated by sizing tools and 260+ stores
Promotions and financing
Holiday discounting heightens buyer power as consumers expect markdowns; Boot Barn reported FY2024 net sales of $2.21 billion, so promo strategy materially affects margins. Clear pricing ladders and tiered good-better-best assortments protect margin mix, while financing on higher-ticket boots (average ticket roughly $240) and rising BNPL adoption (~34% of apparel transactions in 2024) reduce price pushback; excessive promo cadence trains deal-seeking behavior.
- Holiday discounts ↑ buyer power
- FY2024 net sales: $2.21B
- Avg ticket ≈ $240; financing lowers resistance
- BNPL adoption ~34% (2024)
- High promo cadence → deal-seeking
Specialty apparel retailer: $2.21B sales, ~260 stores, avg ticket $240
Customers are fragmented (individuals/small biz) with limited collective leverage; Boot Barn reported FY2024 net sales $2.21B and ~260 stores, supporting in-store fit and loyalty. Price sensitivity rises for commodity SKUs and holiday promos increase buyer power; avg ticket ≈ $240 and employer bulk buys lessen elasticity. BNPL adoption (~34% apparel 2024) and sizing tools lower returns.
| Metric | 2024 |
|---|---|
| Net sales | $2.21B |
| Stores | ~260 |
| Avg ticket | $240 |
| BNPL | ~34% |
Same Document Delivered
Boot Barn Porter's Five Forces Analysis
This Porter's Five Forces analysis of Boot Barn examines competitive rivalry, supplier and buyer power, threat of new entrants, and substitute pressures to clarify strategic risks and opportunities. The preview you see is the exact, fully formatted document you'll receive immediately after purchase—no placeholders or samples. You’ll get instant access to this ready-to-use file for download and implementation.











