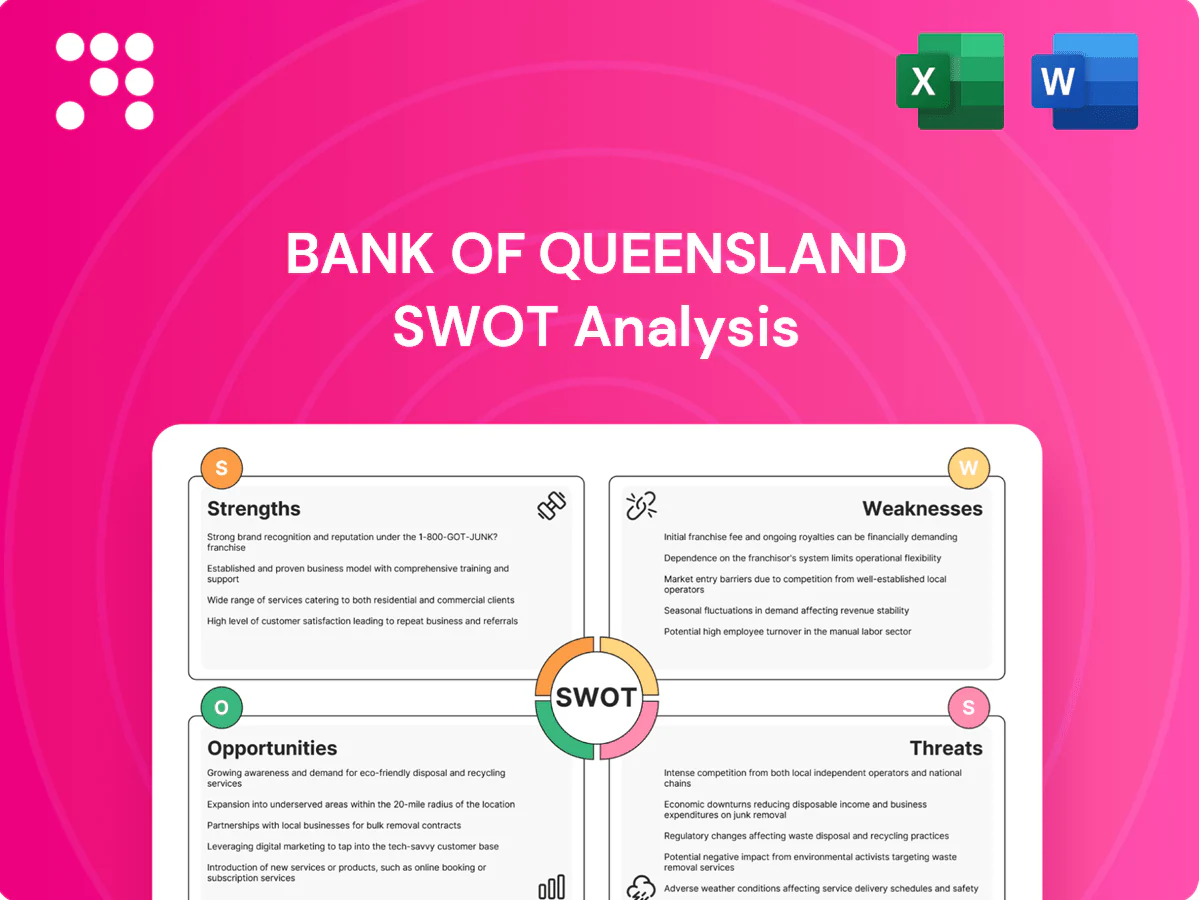
Bank of Queensland SWOT Analysis

Elevate Your Analysis with the Complete SWOT Report
Bank of Queensland combines a strong regional franchise and sticky retail deposits with an ambitious digital shift, yet faces margin pressure, portfolio concentration and rising compliance costs; growth hinges on SME lending and mortgage market share. Want the full story behind BOQ’s strengths, risks and growth drivers? Purchase the complete SWOT analysis to get a professionally formatted Word report and editable Excel matrix.
Strengths

Relationship-centric model
BOQ’s owner-managed branch model delivers personalised service and local credit decisions that build trust and drive retention, supporting a client base of around 500,000 customers. This structure boosts responsiveness to SME needs and enables more nuanced credit assessments versus centralised rivals. Deeper relationships raise cross-sell opportunities and measurably reduce churn, improving lifetime value per customer.
Diverse retail and business suite
Bank of Queensland offers home loans, personal loans, credit cards, deposits, business loans, transaction accounts and merchant services, enabling multi-product relationships that drive fee and interest-bearing balances.
This breadth supports earnings balance across cycles and bundling/package pricing that improves unit economics; BOQ’s diversified loan book (over A$60bn in total lending) gives portfolio mix flexibility to shift between retail and business demand.

SME and community footprint
Bank of Queenslands SME and community footprint—over 100 regional branches and local business bankers—anchors proximity-based lending where face-to-face matters.
Owner-managers’ deep knowledge of regional industries, cash cycles and collateral norms accelerates credit assessment and drives higher-quality origination versus remote competitors.
Community sponsorships and local engagement have translated into measurable reputational capital and stronger customer retention in targeted regional markets.

Customer experience focus
Personalized service at Bank of Queensland delivers tailored solutions and faster issue resolution, with human-centric advice complementing digital channels to boost satisfaction and suitability in complex lending cases versus pure self-serve models. This focus can drive higher NPS in target segments and stronger retention among mortgage and SME clients.
- Tailored solutions
- Faster resolution
- Human + digital
- Higher NPS potential
- Advantage in complex lending
Agile mid-tier positioning
Being smaller than major banks allows BOQ to make quicker product tweaks and pricing moves, with lighter governance layers improving time-to-market; BOQ had a market cap near AUD 2.1bn in 2024 and ~250 branches, enabling regional pilots before national scaling. Niche targeting is easier without legacy scale constraints, accelerating tailored rollouts and rapid feedback loops.
- Agility vs majors
- Light governance
- Regional pilot capability
- Niche targeting
Owner-managed bank: ~500,000 customers, ~250 branches, A$60bn+ lending
BOQ's owner-managed model serves ~500,000 customers via ~250 branches (2024), supporting A$60bn+ lending and strong SME/mortgage origination. Personalised service drives cross-sell, lower churn and faster product rollout versus majors. Market cap ~A$2.1bn (2024).
| Metric | 2024 |
|---|---|
| Customers | ~500,000 |
| Branches | ~250 |
| Total lending | A$60bn+ |
| Market cap | A$2.1bn |
What is included in the product
 Detailed Word Document
Delivers a strategic overview of Bank of Queensland’s internal and external business factors, outlining its strengths, weaknesses, opportunities and threats to assess competitive position and future risks. Highlights key growth drivers, operational gaps and market challenges shaping the bank’s strategic direction.

 Customizable Excel Spreadsheet
Provides a concise Bank of Queensland SWOT matrix to quickly surface strengths, weaknesses, opportunities and threats, enabling faster strategic decisions and clear stakeholder updates.
Weaknesses

Scale disadvantage vs majors
BOQ's smaller scale (group assets ~AUD 63bn at Jun 2024) versus a big-four bank like CBA (~AUD 1.1tn) raises funding and operating costs, as its marketing reach and branch density are narrower, limiting customer acquisition. Aggressive price competition from large banks—which control ~80% of the mortgage market—can compress BOQ margins and leaves it less able to absorb shocks than the big four.
Technology investment burden
Keeping pace in digital, data and core systems demands heavy capex and scarce talent, with banks often allocating around 10–12% of operating expenses to technology and transformation programs in recent years.
As a mid-tier lender, per-customer tech costs can be 20–30% higher than majors, while legacy integration slows feature delivery, risking noticeable experience gaps versus neobanks and major banks.

Owner-managed variability
Decentralized, owner-managed branches at Bank of Queensland can produce inconsistent customer service and risk practices across its network of over 200 branches, complicating quality control and brand uniformity.
Performance dispersion lifts oversight and compliance costs and was flagged during recent audits, pushing central governance to invest in standardized training and tighter controls to maintain group-wide standards.

Concentration in Australian market
Bank of Queensland’s earnings are heavily tied to Australian economic cycles and housing trends, with the loan book dominated by residential mortgages so housing downturns hit profitability and credit metrics. Geographic and sector diversification is limited because operations and lending are almost exclusively Australian, so shocks in specific regions or industries can disproportionately impact results. The bank is highly sensitive to Australian monetary policy and RBA rate moves, which drive funding costs and net interest margin.
- Domestic exposure: operations almost exclusively Australia
- Mortgage-heavy loan book: largest portfolio segment
- Regional/sector shock risk: concentrated impact
- RBA policy dependence: rates drive NIM and funding
Margin sensitivity to deposit mix
Bank of Queenslands net interest margin is highly dependent on a stable mix of low-cost deposits, leaving margins vulnerable when competitive pricing forces up funding costs. When retail customers shift into higher-rate term deposits or market rates rise, BOQ faces erosion of lending spreads and profitability pressure. This sensitivity is particularly acute during tightening cycles when deposit repricing accelerates.
- Margin reliance on low-cost deposits
- Competitive deposit pricing raises funding costs
- Customer shifts to higher-rate products erode spreads
- Heightened risk in rate-tightening cycles
Smaller bank faces margin squeeze from majors, heavy digital costs and branch inefficiency
BOQ’s smaller scale (group assets ~AUD 63bn at Jun 2024) limits reach and raises funding/operating costs versus majors; big four control ~80% of the mortgage market, exerting margin pressure. Heavy digital capex (tech spend ~10–12% of Opex) and 20–30% higher per-customer tech costs strain returns. Over 200 branches and decentralized operations increase compliance and service inconsistency.
| Metric | Value |
|---|---|
| Group assets (Jun 2024) | AUD 63bn |
| Big-four mortgage share | ~80% |
| Branches | >200 |
| Tech spend of Opex | 10–12% |
| Per-customer tech cost | 20–30% higher vs majors |
Preview the Actual Deliverable
Bank of Queensland SWOT Analysis
This is a live preview of the actual Bank of Queensland SWOT analysis you'll receive—no placeholders or samples. The content below is pulled directly from the final, professionally formatted file. Purchase unlocks the full, editable report with complete insights and supporting details.

Elevate Your Analysis with the Complete SWOT Report
Bank of Queensland combines a strong regional franchise and sticky retail deposits with an ambitious digital shift, yet faces margin pressure, portfolio concentration and rising compliance costs; growth hinges on SME lending and mortgage market share. Want the full story behind BOQ’s strengths, risks and growth drivers? Purchase the complete SWOT analysis to get a professionally formatted Word report and editable Excel matrix.
Strengths
Relationship-centric model
BOQ’s owner-managed branch model delivers personalised service and local credit decisions that build trust and drive retention, supporting a client base of around 500,000 customers. This structure boosts responsiveness to SME needs and enables more nuanced credit assessments versus centralised rivals. Deeper relationships raise cross-sell opportunities and measurably reduce churn, improving lifetime value per customer.
Diverse retail and business suite
Bank of Queensland offers home loans, personal loans, credit cards, deposits, business loans, transaction accounts and merchant services, enabling multi-product relationships that drive fee and interest-bearing balances.
This breadth supports earnings balance across cycles and bundling/package pricing that improves unit economics; BOQ’s diversified loan book (over A$60bn in total lending) gives portfolio mix flexibility to shift between retail and business demand.
SME and community footprint
Bank of Queenslands SME and community footprint—over 100 regional branches and local business bankers—anchors proximity-based lending where face-to-face matters.
Owner-managers’ deep knowledge of regional industries, cash cycles and collateral norms accelerates credit assessment and drives higher-quality origination versus remote competitors.
Community sponsorships and local engagement have translated into measurable reputational capital and stronger customer retention in targeted regional markets.
Customer experience focus
Personalized service at Bank of Queensland delivers tailored solutions and faster issue resolution, with human-centric advice complementing digital channels to boost satisfaction and suitability in complex lending cases versus pure self-serve models. This focus can drive higher NPS in target segments and stronger retention among mortgage and SME clients.
- Tailored solutions
- Faster resolution
- Human + digital
- Higher NPS potential
- Advantage in complex lending
Agile mid-tier positioning
Being smaller than major banks allows BOQ to make quicker product tweaks and pricing moves, with lighter governance layers improving time-to-market; BOQ had a market cap near AUD 2.1bn in 2024 and ~250 branches, enabling regional pilots before national scaling. Niche targeting is easier without legacy scale constraints, accelerating tailored rollouts and rapid feedback loops.
- Agility vs majors
- Light governance
- Regional pilot capability
- Niche targeting
Owner-managed bank: ~500,000 customers, ~250 branches, A$60bn+ lending
BOQ's owner-managed model serves ~500,000 customers via ~250 branches (2024), supporting A$60bn+ lending and strong SME/mortgage origination. Personalised service drives cross-sell, lower churn and faster product rollout versus majors. Market cap ~A$2.1bn (2024).
| Metric | 2024 |
|---|---|
| Customers | ~500,000 |
| Branches | ~250 |
| Total lending | A$60bn+ |
| Market cap | A$2.1bn |
What is included in the product
Detailed Word Document
Delivers a strategic overview of Bank of Queensland’s internal and external business factors, outlining its strengths, weaknesses, opportunities and threats to assess competitive position and future risks. Highlights key growth drivers, operational gaps and market challenges shaping the bank’s strategic direction.
Customizable Excel Spreadsheet
Provides a concise Bank of Queensland SWOT matrix to quickly surface strengths, weaknesses, opportunities and threats, enabling faster strategic decisions and clear stakeholder updates.
Weaknesses
Scale disadvantage vs majors
BOQ's smaller scale (group assets ~AUD 63bn at Jun 2024) versus a big-four bank like CBA (~AUD 1.1tn) raises funding and operating costs, as its marketing reach and branch density are narrower, limiting customer acquisition. Aggressive price competition from large banks—which control ~80% of the mortgage market—can compress BOQ margins and leaves it less able to absorb shocks than the big four.
Technology investment burden
Keeping pace in digital, data and core systems demands heavy capex and scarce talent, with banks often allocating around 10–12% of operating expenses to technology and transformation programs in recent years.
As a mid-tier lender, per-customer tech costs can be 20–30% higher than majors, while legacy integration slows feature delivery, risking noticeable experience gaps versus neobanks and major banks.
Owner-managed variability
Decentralized, owner-managed branches at Bank of Queensland can produce inconsistent customer service and risk practices across its network of over 200 branches, complicating quality control and brand uniformity.
Performance dispersion lifts oversight and compliance costs and was flagged during recent audits, pushing central governance to invest in standardized training and tighter controls to maintain group-wide standards.
Concentration in Australian market
Bank of Queensland’s earnings are heavily tied to Australian economic cycles and housing trends, with the loan book dominated by residential mortgages so housing downturns hit profitability and credit metrics. Geographic and sector diversification is limited because operations and lending are almost exclusively Australian, so shocks in specific regions or industries can disproportionately impact results. The bank is highly sensitive to Australian monetary policy and RBA rate moves, which drive funding costs and net interest margin.
- Domestic exposure: operations almost exclusively Australia
- Mortgage-heavy loan book: largest portfolio segment
- Regional/sector shock risk: concentrated impact
- RBA policy dependence: rates drive NIM and funding
Margin sensitivity to deposit mix
Bank of Queenslands net interest margin is highly dependent on a stable mix of low-cost deposits, leaving margins vulnerable when competitive pricing forces up funding costs. When retail customers shift into higher-rate term deposits or market rates rise, BOQ faces erosion of lending spreads and profitability pressure. This sensitivity is particularly acute during tightening cycles when deposit repricing accelerates.
- Margin reliance on low-cost deposits
- Competitive deposit pricing raises funding costs
- Customer shifts to higher-rate products erode spreads
- Heightened risk in rate-tightening cycles
Smaller bank faces margin squeeze from majors, heavy digital costs and branch inefficiency
BOQ’s smaller scale (group assets ~AUD 63bn at Jun 2024) limits reach and raises funding/operating costs versus majors; big four control ~80% of the mortgage market, exerting margin pressure. Heavy digital capex (tech spend ~10–12% of Opex) and 20–30% higher per-customer tech costs strain returns. Over 200 branches and decentralized operations increase compliance and service inconsistency.
| Metric | Value |
|---|---|
| Group assets (Jun 2024) | AUD 63bn |
| Big-four mortgage share | ~80% |
| Branches | >200 |
| Tech spend of Opex | 10–12% |
| Per-customer tech cost | 20–30% higher vs majors |
Preview the Actual Deliverable
Bank of Queensland SWOT Analysis
This is a live preview of the actual Bank of Queensland SWOT analysis you'll receive—no placeholders or samples. The content below is pulled directly from the final, professionally formatted file. Purchase unlocks the full, editable report with complete insights and supporting details.
Original: $10.00
-65%$10.00
$3.50Description
Elevate Your Analysis with the Complete SWOT Report
Bank of Queensland combines a strong regional franchise and sticky retail deposits with an ambitious digital shift, yet faces margin pressure, portfolio concentration and rising compliance costs; growth hinges on SME lending and mortgage market share. Want the full story behind BOQ’s strengths, risks and growth drivers? Purchase the complete SWOT analysis to get a professionally formatted Word report and editable Excel matrix.
Strengths
Relationship-centric model
BOQ’s owner-managed branch model delivers personalised service and local credit decisions that build trust and drive retention, supporting a client base of around 500,000 customers. This structure boosts responsiveness to SME needs and enables more nuanced credit assessments versus centralised rivals. Deeper relationships raise cross-sell opportunities and measurably reduce churn, improving lifetime value per customer.
Diverse retail and business suite
Bank of Queensland offers home loans, personal loans, credit cards, deposits, business loans, transaction accounts and merchant services, enabling multi-product relationships that drive fee and interest-bearing balances.
This breadth supports earnings balance across cycles and bundling/package pricing that improves unit economics; BOQ’s diversified loan book (over A$60bn in total lending) gives portfolio mix flexibility to shift between retail and business demand.
SME and community footprint
Bank of Queenslands SME and community footprint—over 100 regional branches and local business bankers—anchors proximity-based lending where face-to-face matters.
Owner-managers’ deep knowledge of regional industries, cash cycles and collateral norms accelerates credit assessment and drives higher-quality origination versus remote competitors.
Community sponsorships and local engagement have translated into measurable reputational capital and stronger customer retention in targeted regional markets.
Customer experience focus
Personalized service at Bank of Queensland delivers tailored solutions and faster issue resolution, with human-centric advice complementing digital channels to boost satisfaction and suitability in complex lending cases versus pure self-serve models. This focus can drive higher NPS in target segments and stronger retention among mortgage and SME clients.
- Tailored solutions
- Faster resolution
- Human + digital
- Higher NPS potential
- Advantage in complex lending
Agile mid-tier positioning
Being smaller than major banks allows BOQ to make quicker product tweaks and pricing moves, with lighter governance layers improving time-to-market; BOQ had a market cap near AUD 2.1bn in 2024 and ~250 branches, enabling regional pilots before national scaling. Niche targeting is easier without legacy scale constraints, accelerating tailored rollouts and rapid feedback loops.
- Agility vs majors
- Light governance
- Regional pilot capability
- Niche targeting
Owner-managed bank: ~500,000 customers, ~250 branches, A$60bn+ lending
BOQ's owner-managed model serves ~500,000 customers via ~250 branches (2024), supporting A$60bn+ lending and strong SME/mortgage origination. Personalised service drives cross-sell, lower churn and faster product rollout versus majors. Market cap ~A$2.1bn (2024).
| Metric | 2024 |
|---|---|
| Customers | ~500,000 |
| Branches | ~250 |
| Total lending | A$60bn+ |
| Market cap | A$2.1bn |
What is included in the product
Detailed Word Document
Delivers a strategic overview of Bank of Queensland’s internal and external business factors, outlining its strengths, weaknesses, opportunities and threats to assess competitive position and future risks. Highlights key growth drivers, operational gaps and market challenges shaping the bank’s strategic direction.
Customizable Excel Spreadsheet
Provides a concise Bank of Queensland SWOT matrix to quickly surface strengths, weaknesses, opportunities and threats, enabling faster strategic decisions and clear stakeholder updates.
Weaknesses
Scale disadvantage vs majors
BOQ's smaller scale (group assets ~AUD 63bn at Jun 2024) versus a big-four bank like CBA (~AUD 1.1tn) raises funding and operating costs, as its marketing reach and branch density are narrower, limiting customer acquisition. Aggressive price competition from large banks—which control ~80% of the mortgage market—can compress BOQ margins and leaves it less able to absorb shocks than the big four.
Technology investment burden
Keeping pace in digital, data and core systems demands heavy capex and scarce talent, with banks often allocating around 10–12% of operating expenses to technology and transformation programs in recent years.
As a mid-tier lender, per-customer tech costs can be 20–30% higher than majors, while legacy integration slows feature delivery, risking noticeable experience gaps versus neobanks and major banks.
Owner-managed variability
Decentralized, owner-managed branches at Bank of Queensland can produce inconsistent customer service and risk practices across its network of over 200 branches, complicating quality control and brand uniformity.
Performance dispersion lifts oversight and compliance costs and was flagged during recent audits, pushing central governance to invest in standardized training and tighter controls to maintain group-wide standards.
Concentration in Australian market
Bank of Queensland’s earnings are heavily tied to Australian economic cycles and housing trends, with the loan book dominated by residential mortgages so housing downturns hit profitability and credit metrics. Geographic and sector diversification is limited because operations and lending are almost exclusively Australian, so shocks in specific regions or industries can disproportionately impact results. The bank is highly sensitive to Australian monetary policy and RBA rate moves, which drive funding costs and net interest margin.
- Domestic exposure: operations almost exclusively Australia
- Mortgage-heavy loan book: largest portfolio segment
- Regional/sector shock risk: concentrated impact
- RBA policy dependence: rates drive NIM and funding
Margin sensitivity to deposit mix
Bank of Queenslands net interest margin is highly dependent on a stable mix of low-cost deposits, leaving margins vulnerable when competitive pricing forces up funding costs. When retail customers shift into higher-rate term deposits or market rates rise, BOQ faces erosion of lending spreads and profitability pressure. This sensitivity is particularly acute during tightening cycles when deposit repricing accelerates.
- Margin reliance on low-cost deposits
- Competitive deposit pricing raises funding costs
- Customer shifts to higher-rate products erode spreads
- Heightened risk in rate-tightening cycles
Smaller bank faces margin squeeze from majors, heavy digital costs and branch inefficiency
BOQ’s smaller scale (group assets ~AUD 63bn at Jun 2024) limits reach and raises funding/operating costs versus majors; big four control ~80% of the mortgage market, exerting margin pressure. Heavy digital capex (tech spend ~10–12% of Opex) and 20–30% higher per-customer tech costs strain returns. Over 200 branches and decentralized operations increase compliance and service inconsistency.
| Metric | Value |
|---|---|
| Group assets (Jun 2024) | AUD 63bn |
| Big-four mortgage share | ~80% |
| Branches | >200 |
| Tech spend of Opex | 10–12% |
| Per-customer tech cost | 20–30% higher vs majors |
Preview the Actual Deliverable
Bank of Queensland SWOT Analysis
This is a live preview of the actual Bank of Queensland SWOT analysis you'll receive—no placeholders or samples. The content below is pulled directly from the final, professionally formatted file. Purchase unlocks the full, editable report with complete insights and supporting details.











