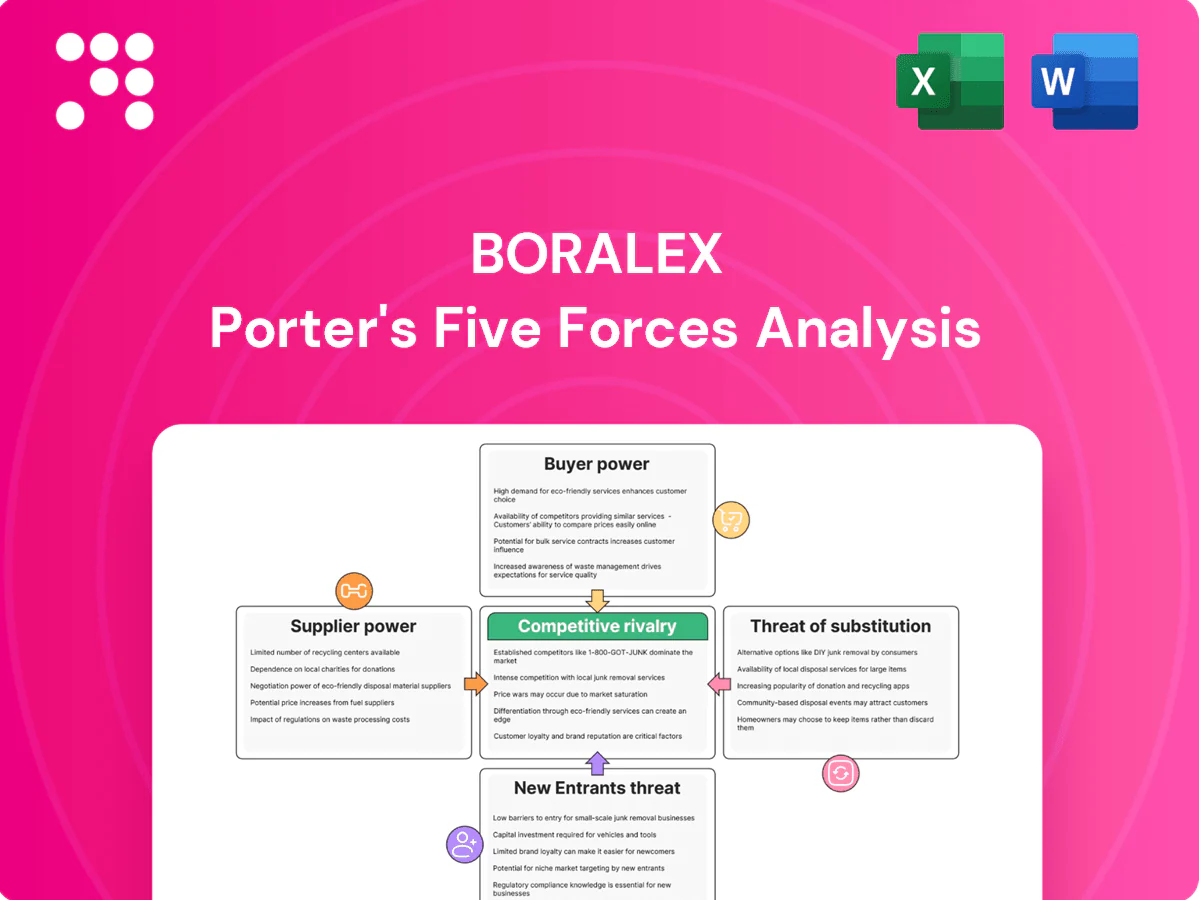
Boralex Porter's Five Forces Analysis

Don't Miss the Bigger Picture
Boralex faces high rivalry as global renewable players and project pipeline competition intensify; supplier and buyer power remain moderate given specialized equipment and long-term power contracts; threat of new entrants is restrained by capital and permitting barriers, while substitutes (other clean technologies and storage) pose growing pressure. This brief snapshot only scratches the surface — unlock the full Porter's Five Forces Analysis for actionable insights.
Suppliers Bargaining Power

OEM concentration
Wind turbines, solar modules and inverters are supplied by a concentrated global set of OEMs (top three wind OEMs account for roughly 65% of market share; top Chinese module makers >70% of shipments in 2023), giving suppliers leverage on pricing and delivery. Boralex faces high switching costs from project-specific engineering and certification; turbine lead times of 12–18 months and module/inverter lead times 3–6 months plus backlogs amplify OEM power. Multi-sourcing and framework agreements can partially mitigate but not eliminate this supplier concentration risk.
Balance-of-plant & EPC
EPC contractors and specialist civil/electrical firms gain leverage in peak build seasons, especially in 2024 when regional labor tightness raised scheduling premiums. Local labor availability, union rules and site complexity (terrain, grid distance) further strengthen EPC bargaining positions. Boralex’s repeatable project templates and competitive tendering help contain unit costs and compress margins. Use of performance bonds and liquidated damages shifts risk back toward suppliers.

Grid access & interconnection
Transmission owners and ISOs control interconnection timelines and costs, creating supplier-like power; US interconnection queues surpassed 1,100 GW (LBNL, 2023), concentrating bargaining leverage. Queue congestion and allocated network upgrades can add millions to project costs and compress IRRs. Boralex’s proactive siting and navigation of studies reduces this exposure. FERC and regional reforms in 2023–24 target improved queue management.

Landowners & permitting
Spare parts & O&M services
Proprietary components and software locks give OEMs leverage in long-term O&M, though as Boralex scaled to ~2.8 GW of operating capacity in 2024 independent service providers have emerged, moderating that power. Boralex mitigates risk by negotiating blended service models, stocking critical spares to cut downtime, and using data analytics plus performance guarantees to rebalance supplier bargaining dynamics.
- OEM lock-in vs independents: rising with fleet age
- Blended contracts + spares: lower downtime exposure
- Data/guarantees: shift bargaining toward owner
High supplier power: queue >1,100 GW vs small portfolio
OEM concentration (top3 wind ~65%; top Chinese modules >70% shipments 2023), long turbine (12–18m) and module lead times, and grid interconnection queues (>1,100 GW, LBNL 2023) raise supplier power vs Boralex (≈2.8 GW operating 2024). Mitigations: multi‑sourcing, long leases, blended O&M and spares; independents rising.
| Metric | Value (year) |
|---|---|
| OEM conc. | Top3 wind ~65% (2023) |
| Boralex capacity | ≈2.8 GW (2024) |
| Turbine lead time | 12–18 months |
| Interconnection queue | >1,100 GW (2023) |
What is included in the product
 Detailed Word Document
Uncovers key drivers of competition, customer influence, and market entry risks tailored to Boralex by evaluating supplier and buyer power, substitution threats, rivalry intensity, and barriers to entry to identify disruptive forces and strategic levers.

 Customizable Excel Spreadsheet
A clear one-sheet summary of Boralex's five competitive forces—ideal for quick boardroom decisions. Customize pressure levels with current renewable-market data, swap in your own notes, and drop the clean layout straight into pitch decks or reports.
Customers Bargaining Power

Concentrated offtakers
Utilities, system operators and large corporates account for the bulk of PPA demand, representing roughly 75–80% of awarded contracts in 2024 and concentrating buyer power into a few large offtakers.
Competitive RFPs in 2024 compressed prices to the low $20s–$40s/MWh in many markets and enforced stringent credit, delivery and curtailment clauses.
Boralex’s multi-GW portfolio and bankability continue to secure awards despite pressure, with portfolio-level flexibility to shape deliveries and firm output strengthening its negotiating position.
Long-term PPAs
Long-term PPAs lock in price and volume, reducing buyer switching and giving buyers leverage during origination as seen in 2024 market negotiations. Credit-quality and tenor requirements favor established IPPs like Boralex, which benefits from revenue visibility but may face merchant exposure if buyers demand shorter terms. Contract optionality and staggered maturities improve resilience against contract roll-off.

Merchant market exposure
In markets with partial merchant exposure, buyers’ power in 2024 tracked prevailing spot prices, which softened during periods of gas-price weakness and renewable oversupply. When spot markets fell, IPP pricing power diminished, prompting Boralex to increase hedging via financial contracts and PPA coverage to stabilize revenue. Boralex also aligns dispatch to demand peaks and pursues storage co-location to capture scarcity premiums and reduce buyer leverage.

Attribute requirements
- RECs/deliverability: rising demand
- Curtailment/basis: contract terms favor buyers
- Boralex edge: >40% capacity factor sites
- Transparency: clearer carbon benefits for corporates
Regulation & procurement design
Regulated auctions with ceiling prices concentrate buying power in policy-shaped offtakers, compressing returns as standardized contracts limit scope for customization and margin capture. Boralex’s multi-market footprint (over 2 GW operating capacity across Canada, France, UK and the US) allows portfolio shifts toward jurisdictions with firmer price signals. In tight auctions, coalition bidding and industry advocacy have improved clearing prices and contract terms.
- Regulation-driven pricing pressure
- Standard contracts reduce margin
- Multi-market exposure >2 GW enables pivot
- Consortiums/advocacy can raise auction outcomes
Utilities hold 75–80% of PPAs; prices $20s–$40s/MWh; high-capacity portfolios prevail
Utilities, system operators and large corporates accounted for ~75–80% of PPA awards in 2024, concentrating buyer power.
Competitive RFPs compressed prices to the low $20s–$40s/MWh and enforced strict credit, curtailment and basis clauses.
Boralex’s >2 GW operating footprint, multi‑GW pipeline and >40% site capacity factors preserve bankability and allow portfolio shifts; corporate PPA market ~30 GW in 2024.
| Metric | 2024 value | Implication |
|---|---|---|
| PPA concentration | 75–80% | High buyer leverage |
| Corporate PPA volume | ~30 GW | Stronger buyer demands |
| Price range | $20s–$40s/MWh | Compressed margins |
| Boralex operating capacity | >2 GW | Portfolio flexibility |
| Site capacity factor | >40% | Improved contract value |
Same Document Delivered
Boralex Porter's Five Forces Analysis
This preview shows the exact Boralex Porter's Five Forces Analysis you'll receive—comprehensive, professionally formatted, and ready for immediate use. There are no placeholders or samples; the file available after purchase is identical to what you see here. You'll get instant access to the full, final document for download and application.

Don't Miss the Bigger Picture
Boralex faces high rivalry as global renewable players and project pipeline competition intensify; supplier and buyer power remain moderate given specialized equipment and long-term power contracts; threat of new entrants is restrained by capital and permitting barriers, while substitutes (other clean technologies and storage) pose growing pressure. This brief snapshot only scratches the surface — unlock the full Porter's Five Forces Analysis for actionable insights.
Suppliers Bargaining Power
OEM concentration
Wind turbines, solar modules and inverters are supplied by a concentrated global set of OEMs (top three wind OEMs account for roughly 65% of market share; top Chinese module makers >70% of shipments in 2023), giving suppliers leverage on pricing and delivery. Boralex faces high switching costs from project-specific engineering and certification; turbine lead times of 12–18 months and module/inverter lead times 3–6 months plus backlogs amplify OEM power. Multi-sourcing and framework agreements can partially mitigate but not eliminate this supplier concentration risk.
Balance-of-plant & EPC
EPC contractors and specialist civil/electrical firms gain leverage in peak build seasons, especially in 2024 when regional labor tightness raised scheduling premiums. Local labor availability, union rules and site complexity (terrain, grid distance) further strengthen EPC bargaining positions. Boralex’s repeatable project templates and competitive tendering help contain unit costs and compress margins. Use of performance bonds and liquidated damages shifts risk back toward suppliers.
Grid access & interconnection
Transmission owners and ISOs control interconnection timelines and costs, creating supplier-like power; US interconnection queues surpassed 1,100 GW (LBNL, 2023), concentrating bargaining leverage. Queue congestion and allocated network upgrades can add millions to project costs and compress IRRs. Boralex’s proactive siting and navigation of studies reduces this exposure. FERC and regional reforms in 2023–24 target improved queue management.
Landowners & permitting
Spare parts & O&M services
Proprietary components and software locks give OEMs leverage in long-term O&M, though as Boralex scaled to ~2.8 GW of operating capacity in 2024 independent service providers have emerged, moderating that power. Boralex mitigates risk by negotiating blended service models, stocking critical spares to cut downtime, and using data analytics plus performance guarantees to rebalance supplier bargaining dynamics.
- OEM lock-in vs independents: rising with fleet age
- Blended contracts + spares: lower downtime exposure
- Data/guarantees: shift bargaining toward owner
High supplier power: queue >1,100 GW vs small portfolio
OEM concentration (top3 wind ~65%; top Chinese modules >70% shipments 2023), long turbine (12–18m) and module lead times, and grid interconnection queues (>1,100 GW, LBNL 2023) raise supplier power vs Boralex (≈2.8 GW operating 2024). Mitigations: multi‑sourcing, long leases, blended O&M and spares; independents rising.
| Metric | Value (year) |
|---|---|
| OEM conc. | Top3 wind ~65% (2023) |
| Boralex capacity | ≈2.8 GW (2024) |
| Turbine lead time | 12–18 months |
| Interconnection queue | >1,100 GW (2023) |
What is included in the product
Detailed Word Document
Uncovers key drivers of competition, customer influence, and market entry risks tailored to Boralex by evaluating supplier and buyer power, substitution threats, rivalry intensity, and barriers to entry to identify disruptive forces and strategic levers.
Customizable Excel Spreadsheet
A clear one-sheet summary of Boralex's five competitive forces—ideal for quick boardroom decisions. Customize pressure levels with current renewable-market data, swap in your own notes, and drop the clean layout straight into pitch decks or reports.
Customers Bargaining Power
Concentrated offtakers
Utilities, system operators and large corporates account for the bulk of PPA demand, representing roughly 75–80% of awarded contracts in 2024 and concentrating buyer power into a few large offtakers.
Competitive RFPs in 2024 compressed prices to the low $20s–$40s/MWh in many markets and enforced stringent credit, delivery and curtailment clauses.
Boralex’s multi-GW portfolio and bankability continue to secure awards despite pressure, with portfolio-level flexibility to shape deliveries and firm output strengthening its negotiating position.
Long-term PPAs
Long-term PPAs lock in price and volume, reducing buyer switching and giving buyers leverage during origination as seen in 2024 market negotiations. Credit-quality and tenor requirements favor established IPPs like Boralex, which benefits from revenue visibility but may face merchant exposure if buyers demand shorter terms. Contract optionality and staggered maturities improve resilience against contract roll-off.
Merchant market exposure
In markets with partial merchant exposure, buyers’ power in 2024 tracked prevailing spot prices, which softened during periods of gas-price weakness and renewable oversupply. When spot markets fell, IPP pricing power diminished, prompting Boralex to increase hedging via financial contracts and PPA coverage to stabilize revenue. Boralex also aligns dispatch to demand peaks and pursues storage co-location to capture scarcity premiums and reduce buyer leverage.
Attribute requirements
- RECs/deliverability: rising demand
- Curtailment/basis: contract terms favor buyers
- Boralex edge: >40% capacity factor sites
- Transparency: clearer carbon benefits for corporates
Regulation & procurement design
Regulated auctions with ceiling prices concentrate buying power in policy-shaped offtakers, compressing returns as standardized contracts limit scope for customization and margin capture. Boralex’s multi-market footprint (over 2 GW operating capacity across Canada, France, UK and the US) allows portfolio shifts toward jurisdictions with firmer price signals. In tight auctions, coalition bidding and industry advocacy have improved clearing prices and contract terms.
- Regulation-driven pricing pressure
- Standard contracts reduce margin
- Multi-market exposure >2 GW enables pivot
- Consortiums/advocacy can raise auction outcomes
Utilities hold 75–80% of PPAs; prices $20s–$40s/MWh; high-capacity portfolios prevail
Utilities, system operators and large corporates accounted for ~75–80% of PPA awards in 2024, concentrating buyer power.
Competitive RFPs compressed prices to the low $20s–$40s/MWh and enforced strict credit, curtailment and basis clauses.
Boralex’s >2 GW operating footprint, multi‑GW pipeline and >40% site capacity factors preserve bankability and allow portfolio shifts; corporate PPA market ~30 GW in 2024.
| Metric | 2024 value | Implication |
|---|---|---|
| PPA concentration | 75–80% | High buyer leverage |
| Corporate PPA volume | ~30 GW | Stronger buyer demands |
| Price range | $20s–$40s/MWh | Compressed margins |
| Boralex operating capacity | >2 GW | Portfolio flexibility |
| Site capacity factor | >40% | Improved contract value |
Same Document Delivered
Boralex Porter's Five Forces Analysis
This preview shows the exact Boralex Porter's Five Forces Analysis you'll receive—comprehensive, professionally formatted, and ready for immediate use. There are no placeholders or samples; the file available after purchase is identical to what you see here. You'll get instant access to the full, final document for download and application.
Original: $10.00
-65%$10.00
$3.50Description
Don't Miss the Bigger Picture
Boralex faces high rivalry as global renewable players and project pipeline competition intensify; supplier and buyer power remain moderate given specialized equipment and long-term power contracts; threat of new entrants is restrained by capital and permitting barriers, while substitutes (other clean technologies and storage) pose growing pressure. This brief snapshot only scratches the surface — unlock the full Porter's Five Forces Analysis for actionable insights.
Suppliers Bargaining Power
OEM concentration
Wind turbines, solar modules and inverters are supplied by a concentrated global set of OEMs (top three wind OEMs account for roughly 65% of market share; top Chinese module makers >70% of shipments in 2023), giving suppliers leverage on pricing and delivery. Boralex faces high switching costs from project-specific engineering and certification; turbine lead times of 12–18 months and module/inverter lead times 3–6 months plus backlogs amplify OEM power. Multi-sourcing and framework agreements can partially mitigate but not eliminate this supplier concentration risk.
Balance-of-plant & EPC
EPC contractors and specialist civil/electrical firms gain leverage in peak build seasons, especially in 2024 when regional labor tightness raised scheduling premiums. Local labor availability, union rules and site complexity (terrain, grid distance) further strengthen EPC bargaining positions. Boralex’s repeatable project templates and competitive tendering help contain unit costs and compress margins. Use of performance bonds and liquidated damages shifts risk back toward suppliers.
Grid access & interconnection
Transmission owners and ISOs control interconnection timelines and costs, creating supplier-like power; US interconnection queues surpassed 1,100 GW (LBNL, 2023), concentrating bargaining leverage. Queue congestion and allocated network upgrades can add millions to project costs and compress IRRs. Boralex’s proactive siting and navigation of studies reduces this exposure. FERC and regional reforms in 2023–24 target improved queue management.
Landowners & permitting
Spare parts & O&M services
Proprietary components and software locks give OEMs leverage in long-term O&M, though as Boralex scaled to ~2.8 GW of operating capacity in 2024 independent service providers have emerged, moderating that power. Boralex mitigates risk by negotiating blended service models, stocking critical spares to cut downtime, and using data analytics plus performance guarantees to rebalance supplier bargaining dynamics.
- OEM lock-in vs independents: rising with fleet age
- Blended contracts + spares: lower downtime exposure
- Data/guarantees: shift bargaining toward owner
High supplier power: queue >1,100 GW vs small portfolio
OEM concentration (top3 wind ~65%; top Chinese modules >70% shipments 2023), long turbine (12–18m) and module lead times, and grid interconnection queues (>1,100 GW, LBNL 2023) raise supplier power vs Boralex (≈2.8 GW operating 2024). Mitigations: multi‑sourcing, long leases, blended O&M and spares; independents rising.
| Metric | Value (year) |
|---|---|
| OEM conc. | Top3 wind ~65% (2023) |
| Boralex capacity | ≈2.8 GW (2024) |
| Turbine lead time | 12–18 months |
| Interconnection queue | >1,100 GW (2023) |
What is included in the product
Detailed Word Document
Uncovers key drivers of competition, customer influence, and market entry risks tailored to Boralex by evaluating supplier and buyer power, substitution threats, rivalry intensity, and barriers to entry to identify disruptive forces and strategic levers.
Customizable Excel Spreadsheet
A clear one-sheet summary of Boralex's five competitive forces—ideal for quick boardroom decisions. Customize pressure levels with current renewable-market data, swap in your own notes, and drop the clean layout straight into pitch decks or reports.
Customers Bargaining Power
Concentrated offtakers
Utilities, system operators and large corporates account for the bulk of PPA demand, representing roughly 75–80% of awarded contracts in 2024 and concentrating buyer power into a few large offtakers.
Competitive RFPs in 2024 compressed prices to the low $20s–$40s/MWh in many markets and enforced stringent credit, delivery and curtailment clauses.
Boralex’s multi-GW portfolio and bankability continue to secure awards despite pressure, with portfolio-level flexibility to shape deliveries and firm output strengthening its negotiating position.
Long-term PPAs
Long-term PPAs lock in price and volume, reducing buyer switching and giving buyers leverage during origination as seen in 2024 market negotiations. Credit-quality and tenor requirements favor established IPPs like Boralex, which benefits from revenue visibility but may face merchant exposure if buyers demand shorter terms. Contract optionality and staggered maturities improve resilience against contract roll-off.
Merchant market exposure
In markets with partial merchant exposure, buyers’ power in 2024 tracked prevailing spot prices, which softened during periods of gas-price weakness and renewable oversupply. When spot markets fell, IPP pricing power diminished, prompting Boralex to increase hedging via financial contracts and PPA coverage to stabilize revenue. Boralex also aligns dispatch to demand peaks and pursues storage co-location to capture scarcity premiums and reduce buyer leverage.
Attribute requirements
- RECs/deliverability: rising demand
- Curtailment/basis: contract terms favor buyers
- Boralex edge: >40% capacity factor sites
- Transparency: clearer carbon benefits for corporates
Regulation & procurement design
Regulated auctions with ceiling prices concentrate buying power in policy-shaped offtakers, compressing returns as standardized contracts limit scope for customization and margin capture. Boralex’s multi-market footprint (over 2 GW operating capacity across Canada, France, UK and the US) allows portfolio shifts toward jurisdictions with firmer price signals. In tight auctions, coalition bidding and industry advocacy have improved clearing prices and contract terms.
- Regulation-driven pricing pressure
- Standard contracts reduce margin
- Multi-market exposure >2 GW enables pivot
- Consortiums/advocacy can raise auction outcomes
Utilities hold 75–80% of PPAs; prices $20s–$40s/MWh; high-capacity portfolios prevail
Utilities, system operators and large corporates accounted for ~75–80% of PPA awards in 2024, concentrating buyer power.
Competitive RFPs compressed prices to the low $20s–$40s/MWh and enforced strict credit, curtailment and basis clauses.
Boralex’s >2 GW operating footprint, multi‑GW pipeline and >40% site capacity factors preserve bankability and allow portfolio shifts; corporate PPA market ~30 GW in 2024.
| Metric | 2024 value | Implication |
|---|---|---|
| PPA concentration | 75–80% | High buyer leverage |
| Corporate PPA volume | ~30 GW | Stronger buyer demands |
| Price range | $20s–$40s/MWh | Compressed margins |
| Boralex operating capacity | >2 GW | Portfolio flexibility |
| Site capacity factor | >40% | Improved contract value |
Same Document Delivered
Boralex Porter's Five Forces Analysis
This preview shows the exact Boralex Porter's Five Forces Analysis you'll receive—comprehensive, professionally formatted, and ready for immediate use. There are no placeholders or samples; the file available after purchase is identical to what you see here. You'll get instant access to the full, final document for download and application.











