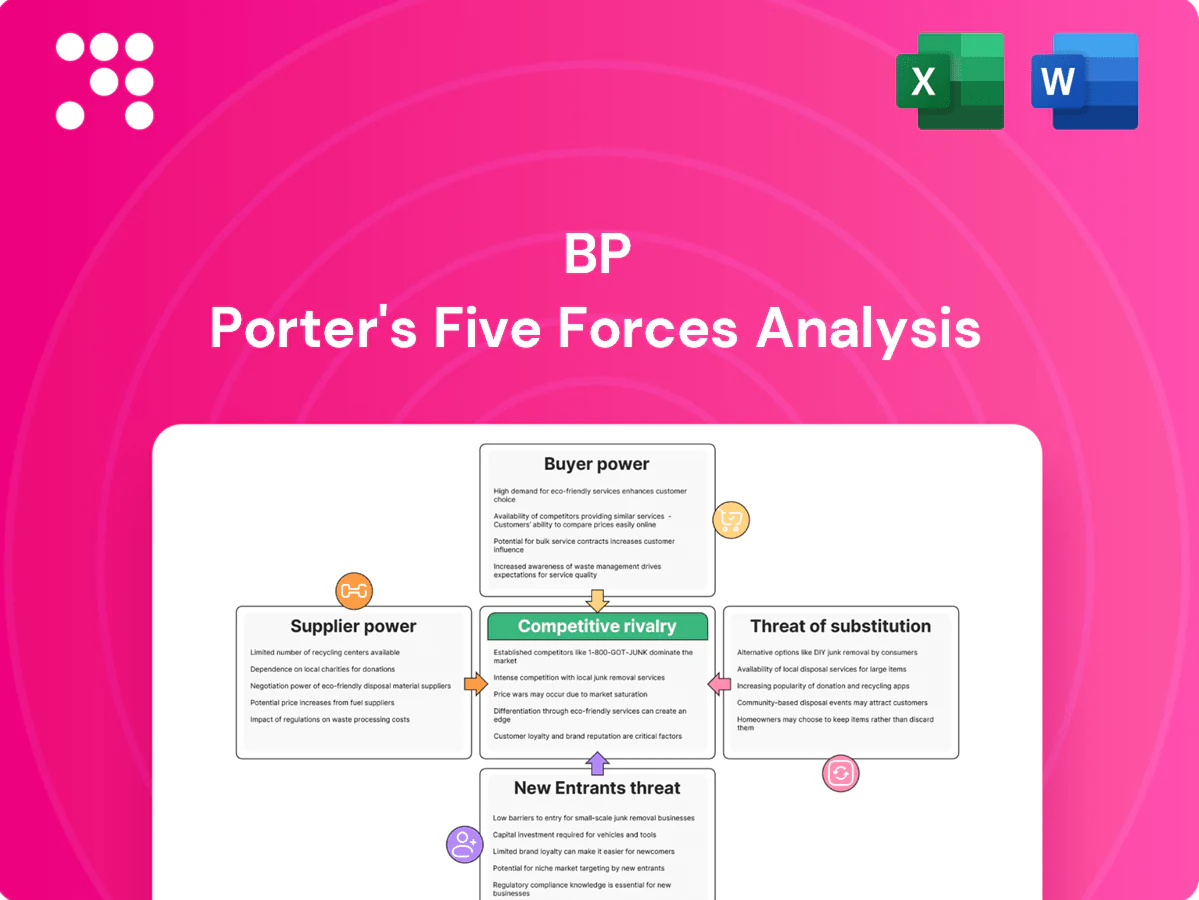
BP Porter's Five Forces Analysis

Don't Miss the Bigger Picture
BP faces complex industry pressures—from supplier leverage and buyer dynamics to regulatory and substitute threats—and this snapshot highlights key tensions shaping its strategy. The full Porter's Five Forces Analysis reveals force-by-force ratings, visuals, and actionable insights to drive smarter investment and strategic choices. Ready for a consultant-grade breakdown? Unlock the complete report for immediate use.
Suppliers Bargaining Power

Concentrated critical inputs
BP depends on specialized offshore rigs and proprietary technologies supplied by a small set of global contractors (Transocean, Valaris, Noble) which raises switching costs and limits leverage. Scarcity of LNG carriers and subsea systems tightens contract terms during cycles. In renewables, the top five turbine OEMs accounted for over 70% of installations in 2023 while CATL held roughly 34% of global EV battery capacity in 2023, elevating supplier bargaining power in tight markets.
Resource access via NOCs
National oil companies control roughly 80% of global proven hydrocarbon reserves and account for about 60% of production in 2024, enabling them to set stringent participation terms. Access for BP often requires long-term commitments, local content rules and profit‑sharing that limit operational and financial flexibility. Negotiation leverage swings with oil prices and shifting geopolitical priorities, reinforcing upstream resource holders’ strategic power.

Skilled labor and services
Specialist labor, engineering services and safety‑critical contractors are pivotal in complex projects, and ManpowerGroup's 2024 Talent Shortage Survey reported ~45% of employers struggle to fill skilled roles, tightening supply. Tight labor markets and project upcycles can inflate labor rates and extend timelines, driving EPC cost uplift and higher opex. Unionized workforces in refining and logistics—US union membership near 10%—add collective bargaining leverage. These dynamics raise supplier power across capex and opex.

Logistics and midstream dependencies
Pipeline owners, port operators and shipping firms act as bottlenecks, constraining BP's crude/product flows and elevating costs when congestion or sanctions tighten capacity. In 2024 supply-chain disruptions and tighter midstream capacity reduced routing optionality, forcing BP into longer, higher-cost contracts to secure reliable delivery. Limited alternatives in key corridors give midstream providers clear leverage over pricing and terms.
- Midstream concentration: limited corridor alternatives increase supplier power
- Cost impact: congestion/sanctions raise freight/handling rates and contract length
- Contract strategy: reliability needs push BP to accept less favorable terms
Emerging low‑carbon inputs
BP’s shift to biofeedstocks, critical minerals and power equipment faces volatile chains: China refines roughly 80% of battery precursors (2024) and global EV stock exceeded 26 million (IEA 2024), concentrating suppliers and raising leverage. Sustainability certifications and traceability narrow viable vendors, while cost pass-through risk spikes in supply squeezes, boosting supplier power in EV charging and biofuels growth segments.
- Concentration: China ~80% of precursor refining (2024)
- EV scale: >26m EVs globally (IEA 2024)
- High pass-through risk during squeezes
Supplier concentration raises switching costs; top-5 turbines ~70%
BP relies on few specialized suppliers (rigs, turbines, batteries) which raises switching costs; top‑5 turbine OEMs ~70% (2023), CATL ~34% EV battery capacity (2023). NOCs hold ~80% reserves and ~60% production (2024), limiting upstream leverage. Midstream bottlenecks and tight labor (45% talent shortage 2024) increase contract costs and duration.
| Supplier Category | Concentration | Key stat (2023/24) |
|---|---|---|
| Turbines/OEMs | High | Top‑5 ~70% (2023) |
| EV batteries | High | CATL ~34% (2023) |
| Upstream reserves | Very high | NOCs ~80% reserves, ~60% production (2024) |
| Labor | Tight | 45% struggle to fill skilled roles (2024) |
What is included in the product
 Detailed Word Document
Tailored Porter's Five Forces analysis for BP that uncovers competitive drivers, supplier and buyer power, entry barriers, substitutes and disruptive threats, with strategic commentary for investor and internal use.

 Customizable Excel Spreadsheet
One-page Porter's Five Forces for BP that distills competitive pressures into a clear, customizable snapshot—perfect for quick boardroom decisions. Swap inputs, toggle scenarios, and visualize strategic intensity with an instant spider chart for confident, data-driven action.
Customers Bargaining Power

Commodity price transparency
Refined products and LNG trade off visible benchmarks (Brent ~$86/bbl in 2024, Platts indices, JKM ~$12/MMBtu and TTF signals), letting buyers shop suppliers; low switching costs for many wholesale customers and traders compress margins in competitive hubs, with refinery GRMs and trading spreads often squeezed to single-digit $/bbl or $/t ranges in 2024; BP must compete on reliability, logistics and structured contracts to protect margin.
Large industrial and airline buyers
Airlines, petrochemical producers and utilities negotiate volume discounts and bespoke terms, using procurement scale to pressure pricing and service levels. Their scale increases leverage over BP, especially where supply can be concentrated into a few large contracts. Long-term offtake deals typically run 3–10 years and lock in volumes while compressing spreads. BP frequently trades price flexibility for stability in these relationships.

Retail consumers’ price sensitivity
Fuel retail customers are highly price-sensitive and switch stations easily; in 2024 the US average retail gasoline price was about $3.44/gal (EIA), reinforcing consumer focus on cents-per-gallon differences. Loyalty programs reach roughly 65% of shoppers but typically recover only small margin percentages. Convenience and bundling mitigate churn only partially, while state and federal oversight on pump pricing constrains rapid price increases. Net effect: buyers exert strong day-to-day pressure on margins.

ESG and decarbonization demands
Corporate buyers increasingly demand lower-carbon fuels, verified Scope 1-3 emissions and renewable power, with corporate PPAs hitting about 44 GW in 2023 (BNEF), giving buyers new specification power and penalties for non-compliance. This creates premium low-carbon niches but raises negotiation leverage, forcing BP to invest in low-carbon solutions or concede price. BP targets $5–7bn annual low-carbon investment by 2030 to meet these demands.
- Buyers: stronger specs, verified emissions
- Market: 44 GW corporate PPAs (2023)
- BP: $5–7bn low-carbon investment target
- Impact: premium niches vs. price concessions
Power markets and PPAs
In renewables, corporate PPAs and utility tenders are fiercely price-driven; global corporate PPA volume hit about 40 GW in 2023 (BloombergNEF), and buyers benchmark aggressively across developers, driving down bids. Contracted prices are often fixed or indexed, compressing developer margins and shifting bargaining power toward sophisticated energy purchasers with scale and credit strength.
- Price competition: high
- Benchmarking: aggressive
- Contracting: fixed/indexed
- Buyer power: increasing
Buyers Drive Margins Down: Low Switching Costs, Benchmarks & PPAs Force Discounts
Buyers wield strong price and spec power in 2024: wholesale switching costs are low, benchmarks (Brent ~$86/bbl, JKM ~$12/MMBtu) and tight trading spreads compress margins. Large corporates and utilities leverage scale and PPAs (≈44 GW corporate PPAs in 2023) to demand low‑carbon specs and discounts. Retail fuel customers remain price‑sensitive (US avg $3.44/gal in 2024), forcing loyalty programs and service differentiation.
| Metric | Value | Impact |
|---|---|---|
| Brent (2024) | $86/bbl | benchmarking |
| JKM (2024) | $12/MMBtu | trading spreads |
| US retail (2024) | $3.44/gal | consumer pressure |
| Corp PPAs (2023) | ≈44 GW | spec leverage |
| BP low‑carbon target | $5–7bn/yr by 2030 | capex to retain contracts |
What You See Is What You Get
BP Porter's Five Forces Analysis
This preview shows the exact BP Porter's Five Forces analysis you'll receive—no placeholders, no edits. It covers rivalry, supplier and buyer power, threats of entry and substitutes, and strategic implications. The full, professionally formatted document is available for immediate download after purchase.

Don't Miss the Bigger Picture
BP faces complex industry pressures—from supplier leverage and buyer dynamics to regulatory and substitute threats—and this snapshot highlights key tensions shaping its strategy. The full Porter's Five Forces Analysis reveals force-by-force ratings, visuals, and actionable insights to drive smarter investment and strategic choices. Ready for a consultant-grade breakdown? Unlock the complete report for immediate use.
Suppliers Bargaining Power
Concentrated critical inputs
BP depends on specialized offshore rigs and proprietary technologies supplied by a small set of global contractors (Transocean, Valaris, Noble) which raises switching costs and limits leverage. Scarcity of LNG carriers and subsea systems tightens contract terms during cycles. In renewables, the top five turbine OEMs accounted for over 70% of installations in 2023 while CATL held roughly 34% of global EV battery capacity in 2023, elevating supplier bargaining power in tight markets.
Resource access via NOCs
National oil companies control roughly 80% of global proven hydrocarbon reserves and account for about 60% of production in 2024, enabling them to set stringent participation terms. Access for BP often requires long-term commitments, local content rules and profit‑sharing that limit operational and financial flexibility. Negotiation leverage swings with oil prices and shifting geopolitical priorities, reinforcing upstream resource holders’ strategic power.
Skilled labor and services
Specialist labor, engineering services and safety‑critical contractors are pivotal in complex projects, and ManpowerGroup's 2024 Talent Shortage Survey reported ~45% of employers struggle to fill skilled roles, tightening supply. Tight labor markets and project upcycles can inflate labor rates and extend timelines, driving EPC cost uplift and higher opex. Unionized workforces in refining and logistics—US union membership near 10%—add collective bargaining leverage. These dynamics raise supplier power across capex and opex.
Logistics and midstream dependencies
Pipeline owners, port operators and shipping firms act as bottlenecks, constraining BP's crude/product flows and elevating costs when congestion or sanctions tighten capacity. In 2024 supply-chain disruptions and tighter midstream capacity reduced routing optionality, forcing BP into longer, higher-cost contracts to secure reliable delivery. Limited alternatives in key corridors give midstream providers clear leverage over pricing and terms.
- Midstream concentration: limited corridor alternatives increase supplier power
- Cost impact: congestion/sanctions raise freight/handling rates and contract length
- Contract strategy: reliability needs push BP to accept less favorable terms
Emerging low‑carbon inputs
BP’s shift to biofeedstocks, critical minerals and power equipment faces volatile chains: China refines roughly 80% of battery precursors (2024) and global EV stock exceeded 26 million (IEA 2024), concentrating suppliers and raising leverage. Sustainability certifications and traceability narrow viable vendors, while cost pass-through risk spikes in supply squeezes, boosting supplier power in EV charging and biofuels growth segments.
- Concentration: China ~80% of precursor refining (2024)
- EV scale: >26m EVs globally (IEA 2024)
- High pass-through risk during squeezes
Supplier concentration raises switching costs; top-5 turbines ~70%
BP relies on few specialized suppliers (rigs, turbines, batteries) which raises switching costs; top‑5 turbine OEMs ~70% (2023), CATL ~34% EV battery capacity (2023). NOCs hold ~80% reserves and ~60% production (2024), limiting upstream leverage. Midstream bottlenecks and tight labor (45% talent shortage 2024) increase contract costs and duration.
| Supplier Category | Concentration | Key stat (2023/24) |
|---|---|---|
| Turbines/OEMs | High | Top‑5 ~70% (2023) |
| EV batteries | High | CATL ~34% (2023) |
| Upstream reserves | Very high | NOCs ~80% reserves, ~60% production (2024) |
| Labor | Tight | 45% struggle to fill skilled roles (2024) |
What is included in the product
Detailed Word Document
Tailored Porter's Five Forces analysis for BP that uncovers competitive drivers, supplier and buyer power, entry barriers, substitutes and disruptive threats, with strategic commentary for investor and internal use.
Customizable Excel Spreadsheet
One-page Porter's Five Forces for BP that distills competitive pressures into a clear, customizable snapshot—perfect for quick boardroom decisions. Swap inputs, toggle scenarios, and visualize strategic intensity with an instant spider chart for confident, data-driven action.
Customers Bargaining Power
Commodity price transparency
Refined products and LNG trade off visible benchmarks (Brent ~$86/bbl in 2024, Platts indices, JKM ~$12/MMBtu and TTF signals), letting buyers shop suppliers; low switching costs for many wholesale customers and traders compress margins in competitive hubs, with refinery GRMs and trading spreads often squeezed to single-digit $/bbl or $/t ranges in 2024; BP must compete on reliability, logistics and structured contracts to protect margin.
Large industrial and airline buyers
Airlines, petrochemical producers and utilities negotiate volume discounts and bespoke terms, using procurement scale to pressure pricing and service levels. Their scale increases leverage over BP, especially where supply can be concentrated into a few large contracts. Long-term offtake deals typically run 3–10 years and lock in volumes while compressing spreads. BP frequently trades price flexibility for stability in these relationships.
Retail consumers’ price sensitivity
Fuel retail customers are highly price-sensitive and switch stations easily; in 2024 the US average retail gasoline price was about $3.44/gal (EIA), reinforcing consumer focus on cents-per-gallon differences. Loyalty programs reach roughly 65% of shoppers but typically recover only small margin percentages. Convenience and bundling mitigate churn only partially, while state and federal oversight on pump pricing constrains rapid price increases. Net effect: buyers exert strong day-to-day pressure on margins.
ESG and decarbonization demands
Corporate buyers increasingly demand lower-carbon fuels, verified Scope 1-3 emissions and renewable power, with corporate PPAs hitting about 44 GW in 2023 (BNEF), giving buyers new specification power and penalties for non-compliance. This creates premium low-carbon niches but raises negotiation leverage, forcing BP to invest in low-carbon solutions or concede price. BP targets $5–7bn annual low-carbon investment by 2030 to meet these demands.
- Buyers: stronger specs, verified emissions
- Market: 44 GW corporate PPAs (2023)
- BP: $5–7bn low-carbon investment target
- Impact: premium niches vs. price concessions
Power markets and PPAs
In renewables, corporate PPAs and utility tenders are fiercely price-driven; global corporate PPA volume hit about 40 GW in 2023 (BloombergNEF), and buyers benchmark aggressively across developers, driving down bids. Contracted prices are often fixed or indexed, compressing developer margins and shifting bargaining power toward sophisticated energy purchasers with scale and credit strength.
- Price competition: high
- Benchmarking: aggressive
- Contracting: fixed/indexed
- Buyer power: increasing
Buyers Drive Margins Down: Low Switching Costs, Benchmarks & PPAs Force Discounts
Buyers wield strong price and spec power in 2024: wholesale switching costs are low, benchmarks (Brent ~$86/bbl, JKM ~$12/MMBtu) and tight trading spreads compress margins. Large corporates and utilities leverage scale and PPAs (≈44 GW corporate PPAs in 2023) to demand low‑carbon specs and discounts. Retail fuel customers remain price‑sensitive (US avg $3.44/gal in 2024), forcing loyalty programs and service differentiation.
| Metric | Value | Impact |
|---|---|---|
| Brent (2024) | $86/bbl | benchmarking |
| JKM (2024) | $12/MMBtu | trading spreads |
| US retail (2024) | $3.44/gal | consumer pressure |
| Corp PPAs (2023) | ≈44 GW | spec leverage |
| BP low‑carbon target | $5–7bn/yr by 2030 | capex to retain contracts |
What You See Is What You Get
BP Porter's Five Forces Analysis
This preview shows the exact BP Porter's Five Forces analysis you'll receive—no placeholders, no edits. It covers rivalry, supplier and buyer power, threats of entry and substitutes, and strategic implications. The full, professionally formatted document is available for immediate download after purchase.
Original: $10.00
-65%$10.00
$3.50Description
Don't Miss the Bigger Picture
BP faces complex industry pressures—from supplier leverage and buyer dynamics to regulatory and substitute threats—and this snapshot highlights key tensions shaping its strategy. The full Porter's Five Forces Analysis reveals force-by-force ratings, visuals, and actionable insights to drive smarter investment and strategic choices. Ready for a consultant-grade breakdown? Unlock the complete report for immediate use.
Suppliers Bargaining Power
Concentrated critical inputs
BP depends on specialized offshore rigs and proprietary technologies supplied by a small set of global contractors (Transocean, Valaris, Noble) which raises switching costs and limits leverage. Scarcity of LNG carriers and subsea systems tightens contract terms during cycles. In renewables, the top five turbine OEMs accounted for over 70% of installations in 2023 while CATL held roughly 34% of global EV battery capacity in 2023, elevating supplier bargaining power in tight markets.
Resource access via NOCs
National oil companies control roughly 80% of global proven hydrocarbon reserves and account for about 60% of production in 2024, enabling them to set stringent participation terms. Access for BP often requires long-term commitments, local content rules and profit‑sharing that limit operational and financial flexibility. Negotiation leverage swings with oil prices and shifting geopolitical priorities, reinforcing upstream resource holders’ strategic power.
Skilled labor and services
Specialist labor, engineering services and safety‑critical contractors are pivotal in complex projects, and ManpowerGroup's 2024 Talent Shortage Survey reported ~45% of employers struggle to fill skilled roles, tightening supply. Tight labor markets and project upcycles can inflate labor rates and extend timelines, driving EPC cost uplift and higher opex. Unionized workforces in refining and logistics—US union membership near 10%—add collective bargaining leverage. These dynamics raise supplier power across capex and opex.
Logistics and midstream dependencies
Pipeline owners, port operators and shipping firms act as bottlenecks, constraining BP's crude/product flows and elevating costs when congestion or sanctions tighten capacity. In 2024 supply-chain disruptions and tighter midstream capacity reduced routing optionality, forcing BP into longer, higher-cost contracts to secure reliable delivery. Limited alternatives in key corridors give midstream providers clear leverage over pricing and terms.
- Midstream concentration: limited corridor alternatives increase supplier power
- Cost impact: congestion/sanctions raise freight/handling rates and contract length
- Contract strategy: reliability needs push BP to accept less favorable terms
Emerging low‑carbon inputs
BP’s shift to biofeedstocks, critical minerals and power equipment faces volatile chains: China refines roughly 80% of battery precursors (2024) and global EV stock exceeded 26 million (IEA 2024), concentrating suppliers and raising leverage. Sustainability certifications and traceability narrow viable vendors, while cost pass-through risk spikes in supply squeezes, boosting supplier power in EV charging and biofuels growth segments.
- Concentration: China ~80% of precursor refining (2024)
- EV scale: >26m EVs globally (IEA 2024)
- High pass-through risk during squeezes
Supplier concentration raises switching costs; top-5 turbines ~70%
BP relies on few specialized suppliers (rigs, turbines, batteries) which raises switching costs; top‑5 turbine OEMs ~70% (2023), CATL ~34% EV battery capacity (2023). NOCs hold ~80% reserves and ~60% production (2024), limiting upstream leverage. Midstream bottlenecks and tight labor (45% talent shortage 2024) increase contract costs and duration.
| Supplier Category | Concentration | Key stat (2023/24) |
|---|---|---|
| Turbines/OEMs | High | Top‑5 ~70% (2023) |
| EV batteries | High | CATL ~34% (2023) |
| Upstream reserves | Very high | NOCs ~80% reserves, ~60% production (2024) |
| Labor | Tight | 45% struggle to fill skilled roles (2024) |
What is included in the product
Detailed Word Document
Tailored Porter's Five Forces analysis for BP that uncovers competitive drivers, supplier and buyer power, entry barriers, substitutes and disruptive threats, with strategic commentary for investor and internal use.
Customizable Excel Spreadsheet
One-page Porter's Five Forces for BP that distills competitive pressures into a clear, customizable snapshot—perfect for quick boardroom decisions. Swap inputs, toggle scenarios, and visualize strategic intensity with an instant spider chart for confident, data-driven action.
Customers Bargaining Power
Commodity price transparency
Refined products and LNG trade off visible benchmarks (Brent ~$86/bbl in 2024, Platts indices, JKM ~$12/MMBtu and TTF signals), letting buyers shop suppliers; low switching costs for many wholesale customers and traders compress margins in competitive hubs, with refinery GRMs and trading spreads often squeezed to single-digit $/bbl or $/t ranges in 2024; BP must compete on reliability, logistics and structured contracts to protect margin.
Large industrial and airline buyers
Airlines, petrochemical producers and utilities negotiate volume discounts and bespoke terms, using procurement scale to pressure pricing and service levels. Their scale increases leverage over BP, especially where supply can be concentrated into a few large contracts. Long-term offtake deals typically run 3–10 years and lock in volumes while compressing spreads. BP frequently trades price flexibility for stability in these relationships.
Retail consumers’ price sensitivity
Fuel retail customers are highly price-sensitive and switch stations easily; in 2024 the US average retail gasoline price was about $3.44/gal (EIA), reinforcing consumer focus on cents-per-gallon differences. Loyalty programs reach roughly 65% of shoppers but typically recover only small margin percentages. Convenience and bundling mitigate churn only partially, while state and federal oversight on pump pricing constrains rapid price increases. Net effect: buyers exert strong day-to-day pressure on margins.
ESG and decarbonization demands
Corporate buyers increasingly demand lower-carbon fuels, verified Scope 1-3 emissions and renewable power, with corporate PPAs hitting about 44 GW in 2023 (BNEF), giving buyers new specification power and penalties for non-compliance. This creates premium low-carbon niches but raises negotiation leverage, forcing BP to invest in low-carbon solutions or concede price. BP targets $5–7bn annual low-carbon investment by 2030 to meet these demands.
- Buyers: stronger specs, verified emissions
- Market: 44 GW corporate PPAs (2023)
- BP: $5–7bn low-carbon investment target
- Impact: premium niches vs. price concessions
Power markets and PPAs
In renewables, corporate PPAs and utility tenders are fiercely price-driven; global corporate PPA volume hit about 40 GW in 2023 (BloombergNEF), and buyers benchmark aggressively across developers, driving down bids. Contracted prices are often fixed or indexed, compressing developer margins and shifting bargaining power toward sophisticated energy purchasers with scale and credit strength.
- Price competition: high
- Benchmarking: aggressive
- Contracting: fixed/indexed
- Buyer power: increasing
Buyers Drive Margins Down: Low Switching Costs, Benchmarks & PPAs Force Discounts
Buyers wield strong price and spec power in 2024: wholesale switching costs are low, benchmarks (Brent ~$86/bbl, JKM ~$12/MMBtu) and tight trading spreads compress margins. Large corporates and utilities leverage scale and PPAs (≈44 GW corporate PPAs in 2023) to demand low‑carbon specs and discounts. Retail fuel customers remain price‑sensitive (US avg $3.44/gal in 2024), forcing loyalty programs and service differentiation.
| Metric | Value | Impact |
|---|---|---|
| Brent (2024) | $86/bbl | benchmarking |
| JKM (2024) | $12/MMBtu | trading spreads |
| US retail (2024) | $3.44/gal | consumer pressure |
| Corp PPAs (2023) | ≈44 GW | spec leverage |
| BP low‑carbon target | $5–7bn/yr by 2030 | capex to retain contracts |
What You See Is What You Get
BP Porter's Five Forces Analysis
This preview shows the exact BP Porter's Five Forces analysis you'll receive—no placeholders, no edits. It covers rivalry, supplier and buyer power, threats of entry and substitutes, and strategic implications. The full, professionally formatted document is available for immediate download after purchase.











