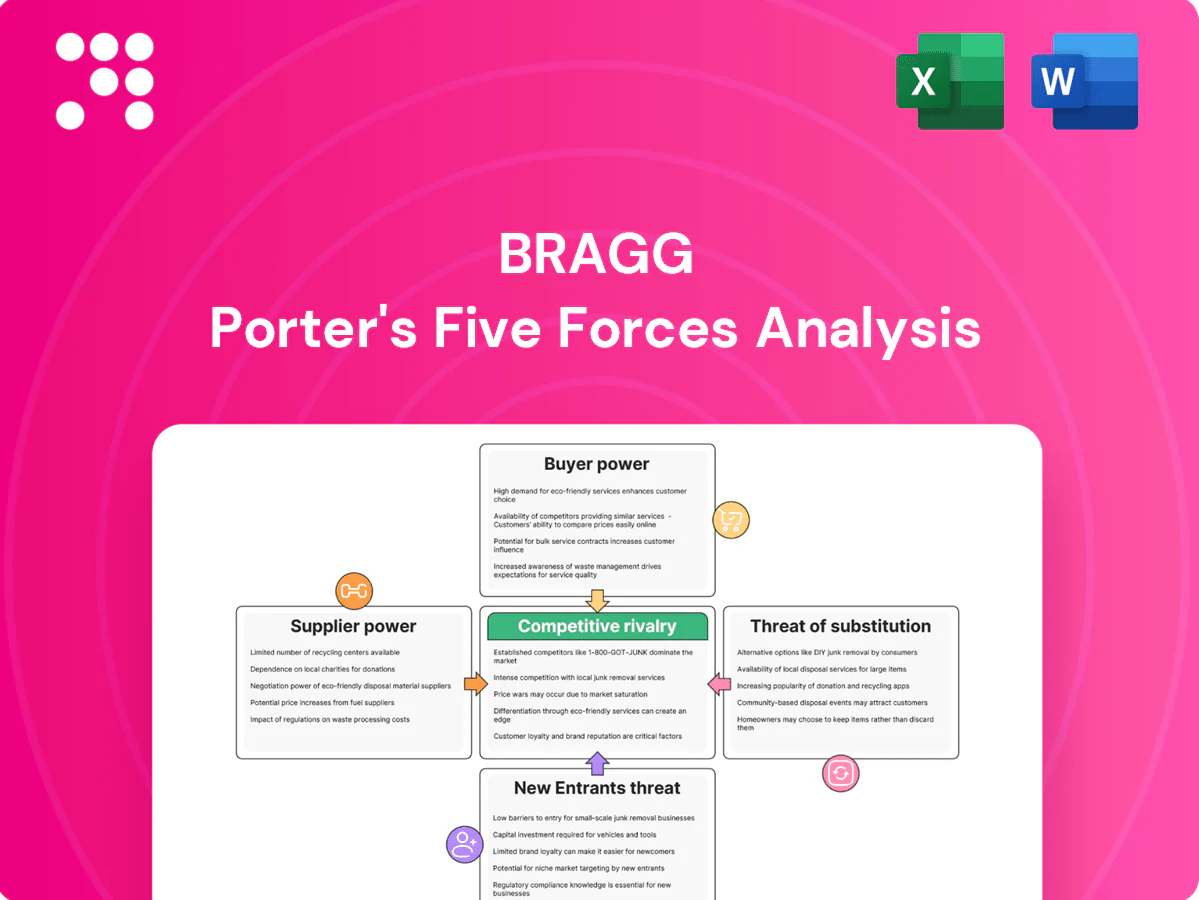
Bragg Porter's Five Forces Analysis

A Must-Have Tool for Decision-Makers
Bragg's Porter's Five Forces analysis highlights competitive rivalry, supplier and buyer power, threat of substitutes and new entrants, and the industry's margin pressures to reveal strategic levers and risks. This preview is just the beginning. The full analysis provides a complete strategic snapshot with force-by-force ratings, visuals, and business implications tailored to Bragg.
Suppliers Bargaining Power

Key game studios
Third‑party studios creating exclusive or high‑ROI titles can command favorable revenue shares; for example Epic Games Store offers an 88/12 split versus typical 70/30, giving top studios leverage. Bragg’s RGS aggregation diversifies content sources, mitigating concentration in a global games market near $200 billion in 2024. Nonetheless, hit‑driven dynamics mean a few blockbuster providers retain bargaining power; long‑term co‑development and timed exclusivity windows can rebalance terms.
Cloud and infra
Dependence on major cloud/CDN vendors concentrates power: in 2024 AWS (32%), Microsoft Azure (23%) and Google Cloud (11%) together dominated public cloud, giving them leverage over uptime, pricing and egress terms. Multi-cloud and edge architectures can reduce lock-in but increase operational complexity and costs. Regulated markets demand SLAs typically between 99.95%–99.99%, heightening switching frictions. Major providers offer tiered volume discounts on egress and bandwidth as traffic scales.

Regtech and data
KYC/AML, geolocation, fraud detection and real-time data feeds are often sourced from specialized vendors and certification labs, making them essential suppliers; the global regtech market reached roughly USD 14 billion in 2024, underscoring vendor scale. Limited interchangeable options in certain jurisdictions elevate supplier influence and pricing power. Modular APIs and composable compliance tooling, increasingly adopted, restore optionality and create pricing tension between providers.

Payment rails
IP and licensing
Brand IP licensors and math-model IP holders can demand royalties that compress margins; 2024 industry reports show licensing rates for major branded games typically range 10–25% of net revenue. Exclusive brands raise acquisition and retention—2024 analyses attribute 15–40% higher installs—but often command the top of that royalty range. Time-bound licenses create renewal and continuity risk for live ops and valuation. Building proprietary IP reduces external bargaining leverage over time.
- royalty range: 10–25% (2024)
- exclusive boosts installs: +15–40% (2024)
- renewal risk: impacts live ops continuity
- proprietary IP lowers supplier leverage
Supplier concentration in gaming: studios, cloud & regtech squeeze margins amid licensing pressure
Third‑party studios (Epic 88/12 vs typical 70/30) and a $200B global games market (2024) concentrate supplier leverage; blockbusters retain outsized negotiating power. Cloud providers (AWS 32%, Azure 23%, GCP 11% in 2024) and regtech vendors (≈USD 14B market) create switching frictions. Licensing (10–25% royalties; exclusive titles +15–40% installs) further pressures margins.
| Supplier | 2024 metric | Impact |
|---|---|---|
| Studios | 88/12 top split | High revenue share |
| Cloud | AWS32/AZ23/GCP11% | Pricing/uplift risk |
| Regtech | USD14B | Dependency |
What is included in the product
 Detailed Word Document
Uncovers key drivers of competition, supplier and buyer power, substitute threats, and entry barriers specific to Bragg, highlighting disruptive forces and strategic levers to protect market share and profitability.

 Customizable Excel Spreadsheet
A single-sheet Bragg Porter Five Forces snapshot that quantifies competitive pressure, highlights actionable levers, and removes analysis friction for faster strategic decisions.
Customers Bargaining Power

Operator concentration
Tier-1 and tier-2 operators with multi-market footprints wield strong negotiating leverage, able to extract volume discounts, bespoke features and influence vendor roadmaps; in 2024 the global telecom services market exceeded $1.7 trillion, concentrating buyer power among a few large operators.
Losing a single large account can materially impact vendor revenue—major deals often represent double-digit percentages of B2B sales—so vendors mitigate risk by diversifying into mid-market operators to reduce dependency and stabilize revenue.
Switching costs
PAM and RGS integrations embed Bragg into operator workflows, increasing stickiness and making data migration and re-certification (ISO/IEC 27001, PCI DSS, GLI) real barriers to exit. As of 2024 REST/JSON standard APIs and modular stacks lower long-term switching costs. Value-add analytics and outsourced managed services further raise practical exit costs for operators.

Multi-sourcing
Operators commonly multi-source content, with 2024 industry surveys reporting about 75% of operators using three or more suppliers, increasing price transparency and buyer power through easy comparability. Exclusive content and localized jackpots can preserve pricing power by creating unique player value. Shifting to performance-based commercial models (revenue share or CPA tiers) aligns incentives and reduces commercial pushback.

Regulatory demands
Operators demand rapid cross-jurisdiction compliance updates; a 2024 industry survey found 59% rank update speed as a top procurement criterion, and vendors slow to adapt face increased rebid risk and contract churn. Superior regulatory coverage raises perceived vendor value and pricing power, while proactive certifications correlate with longer average contract duration.
- Update speed: 59% (2024 survey)
- Rebid risk: higher for slow compliance
- Certifications: extend contract length
Outcome accountability
Buyers prioritize KPIs such as GGR uplift, engagement and retention and in 2024 68% of platform buyers required measurable uplift metrics before renewing contracts. Underperforming content or features prompt renegotiation or reallocation of lobby space within 1–3 months. Demonstrated ROI via analytics lowers discount pressure, while co-marketing and time-limited feature trials sustain wallet share.
- GGR uplift focus
- Renegotiate or reallocate
- Analytics reduces discounts
- Co-marketing + trials retain spend
Buyers rule: telecom > $1.7T, 75% use 3+ vendors
Large multi-market operators concentrate buyer power; 2024 global telecom services > $1.7 trillion, enabling volume discounts and roadmap influence.
About 75% of operators use three or more suppliers, so price transparency is high; REST/JSON APIs lower switching costs while certifications (ISO/IEC 27001, PCI DSS, GLI) raise exit barriers.
68% require measurable GGR uplift to renew and 59% rank compliance update speed as a top procurement criterion.
| Metric | 2024 value |
|---|---|
| Global telecom services | $1.7T+ |
| Operators using 3+ suppliers | 75% |
| Require GGR uplift | 68% |
| Prioritize compliance update speed | 59% |
Preview the Actual Deliverable
Bragg Porter's Five Forces Analysis
This preview shows the exact Bragg Porter Five Forces analysis you'll receive—no placeholders or samples. The document is fully formatted, professionally written, and ready for immediate download upon purchase. Use it as-is for strategy, valuation, or presentation needs.

A Must-Have Tool for Decision-Makers
Bragg's Porter's Five Forces analysis highlights competitive rivalry, supplier and buyer power, threat of substitutes and new entrants, and the industry's margin pressures to reveal strategic levers and risks. This preview is just the beginning. The full analysis provides a complete strategic snapshot with force-by-force ratings, visuals, and business implications tailored to Bragg.
Suppliers Bargaining Power
Key game studios
Third‑party studios creating exclusive or high‑ROI titles can command favorable revenue shares; for example Epic Games Store offers an 88/12 split versus typical 70/30, giving top studios leverage. Bragg’s RGS aggregation diversifies content sources, mitigating concentration in a global games market near $200 billion in 2024. Nonetheless, hit‑driven dynamics mean a few blockbuster providers retain bargaining power; long‑term co‑development and timed exclusivity windows can rebalance terms.
Cloud and infra
Dependence on major cloud/CDN vendors concentrates power: in 2024 AWS (32%), Microsoft Azure (23%) and Google Cloud (11%) together dominated public cloud, giving them leverage over uptime, pricing and egress terms. Multi-cloud and edge architectures can reduce lock-in but increase operational complexity and costs. Regulated markets demand SLAs typically between 99.95%–99.99%, heightening switching frictions. Major providers offer tiered volume discounts on egress and bandwidth as traffic scales.
Regtech and data
KYC/AML, geolocation, fraud detection and real-time data feeds are often sourced from specialized vendors and certification labs, making them essential suppliers; the global regtech market reached roughly USD 14 billion in 2024, underscoring vendor scale. Limited interchangeable options in certain jurisdictions elevate supplier influence and pricing power. Modular APIs and composable compliance tooling, increasingly adopted, restore optionality and create pricing tension between providers.
Payment rails
IP and licensing
Brand IP licensors and math-model IP holders can demand royalties that compress margins; 2024 industry reports show licensing rates for major branded games typically range 10–25% of net revenue. Exclusive brands raise acquisition and retention—2024 analyses attribute 15–40% higher installs—but often command the top of that royalty range. Time-bound licenses create renewal and continuity risk for live ops and valuation. Building proprietary IP reduces external bargaining leverage over time.
- royalty range: 10–25% (2024)
- exclusive boosts installs: +15–40% (2024)
- renewal risk: impacts live ops continuity
- proprietary IP lowers supplier leverage
Supplier concentration in gaming: studios, cloud & regtech squeeze margins amid licensing pressure
Third‑party studios (Epic 88/12 vs typical 70/30) and a $200B global games market (2024) concentrate supplier leverage; blockbusters retain outsized negotiating power. Cloud providers (AWS 32%, Azure 23%, GCP 11% in 2024) and regtech vendors (≈USD 14B market) create switching frictions. Licensing (10–25% royalties; exclusive titles +15–40% installs) further pressures margins.
| Supplier | 2024 metric | Impact |
|---|---|---|
| Studios | 88/12 top split | High revenue share |
| Cloud | AWS32/AZ23/GCP11% | Pricing/uplift risk |
| Regtech | USD14B | Dependency |
What is included in the product
Detailed Word Document
Uncovers key drivers of competition, supplier and buyer power, substitute threats, and entry barriers specific to Bragg, highlighting disruptive forces and strategic levers to protect market share and profitability.
Customizable Excel Spreadsheet
A single-sheet Bragg Porter Five Forces snapshot that quantifies competitive pressure, highlights actionable levers, and removes analysis friction for faster strategic decisions.
Customers Bargaining Power
Operator concentration
Tier-1 and tier-2 operators with multi-market footprints wield strong negotiating leverage, able to extract volume discounts, bespoke features and influence vendor roadmaps; in 2024 the global telecom services market exceeded $1.7 trillion, concentrating buyer power among a few large operators.
Losing a single large account can materially impact vendor revenue—major deals often represent double-digit percentages of B2B sales—so vendors mitigate risk by diversifying into mid-market operators to reduce dependency and stabilize revenue.
Switching costs
PAM and RGS integrations embed Bragg into operator workflows, increasing stickiness and making data migration and re-certification (ISO/IEC 27001, PCI DSS, GLI) real barriers to exit. As of 2024 REST/JSON standard APIs and modular stacks lower long-term switching costs. Value-add analytics and outsourced managed services further raise practical exit costs for operators.
Multi-sourcing
Operators commonly multi-source content, with 2024 industry surveys reporting about 75% of operators using three or more suppliers, increasing price transparency and buyer power through easy comparability. Exclusive content and localized jackpots can preserve pricing power by creating unique player value. Shifting to performance-based commercial models (revenue share or CPA tiers) aligns incentives and reduces commercial pushback.
Regulatory demands
Operators demand rapid cross-jurisdiction compliance updates; a 2024 industry survey found 59% rank update speed as a top procurement criterion, and vendors slow to adapt face increased rebid risk and contract churn. Superior regulatory coverage raises perceived vendor value and pricing power, while proactive certifications correlate with longer average contract duration.
- Update speed: 59% (2024 survey)
- Rebid risk: higher for slow compliance
- Certifications: extend contract length
Outcome accountability
Buyers prioritize KPIs such as GGR uplift, engagement and retention and in 2024 68% of platform buyers required measurable uplift metrics before renewing contracts. Underperforming content or features prompt renegotiation or reallocation of lobby space within 1–3 months. Demonstrated ROI via analytics lowers discount pressure, while co-marketing and time-limited feature trials sustain wallet share.
- GGR uplift focus
- Renegotiate or reallocate
- Analytics reduces discounts
- Co-marketing + trials retain spend
Buyers rule: telecom > $1.7T, 75% use 3+ vendors
Large multi-market operators concentrate buyer power; 2024 global telecom services > $1.7 trillion, enabling volume discounts and roadmap influence.
About 75% of operators use three or more suppliers, so price transparency is high; REST/JSON APIs lower switching costs while certifications (ISO/IEC 27001, PCI DSS, GLI) raise exit barriers.
68% require measurable GGR uplift to renew and 59% rank compliance update speed as a top procurement criterion.
| Metric | 2024 value |
|---|---|
| Global telecom services | $1.7T+ |
| Operators using 3+ suppliers | 75% |
| Require GGR uplift | 68% |
| Prioritize compliance update speed | 59% |
Preview the Actual Deliverable
Bragg Porter's Five Forces Analysis
This preview shows the exact Bragg Porter Five Forces analysis you'll receive—no placeholders or samples. The document is fully formatted, professionally written, and ready for immediate download upon purchase. Use it as-is for strategy, valuation, or presentation needs.
Original: $10.00
-65%$10.00
$3.50Description
A Must-Have Tool for Decision-Makers
Bragg's Porter's Five Forces analysis highlights competitive rivalry, supplier and buyer power, threat of substitutes and new entrants, and the industry's margin pressures to reveal strategic levers and risks. This preview is just the beginning. The full analysis provides a complete strategic snapshot with force-by-force ratings, visuals, and business implications tailored to Bragg.
Suppliers Bargaining Power
Key game studios
Third‑party studios creating exclusive or high‑ROI titles can command favorable revenue shares; for example Epic Games Store offers an 88/12 split versus typical 70/30, giving top studios leverage. Bragg’s RGS aggregation diversifies content sources, mitigating concentration in a global games market near $200 billion in 2024. Nonetheless, hit‑driven dynamics mean a few blockbuster providers retain bargaining power; long‑term co‑development and timed exclusivity windows can rebalance terms.
Cloud and infra
Dependence on major cloud/CDN vendors concentrates power: in 2024 AWS (32%), Microsoft Azure (23%) and Google Cloud (11%) together dominated public cloud, giving them leverage over uptime, pricing and egress terms. Multi-cloud and edge architectures can reduce lock-in but increase operational complexity and costs. Regulated markets demand SLAs typically between 99.95%–99.99%, heightening switching frictions. Major providers offer tiered volume discounts on egress and bandwidth as traffic scales.
Regtech and data
KYC/AML, geolocation, fraud detection and real-time data feeds are often sourced from specialized vendors and certification labs, making them essential suppliers; the global regtech market reached roughly USD 14 billion in 2024, underscoring vendor scale. Limited interchangeable options in certain jurisdictions elevate supplier influence and pricing power. Modular APIs and composable compliance tooling, increasingly adopted, restore optionality and create pricing tension between providers.
Payment rails
IP and licensing
Brand IP licensors and math-model IP holders can demand royalties that compress margins; 2024 industry reports show licensing rates for major branded games typically range 10–25% of net revenue. Exclusive brands raise acquisition and retention—2024 analyses attribute 15–40% higher installs—but often command the top of that royalty range. Time-bound licenses create renewal and continuity risk for live ops and valuation. Building proprietary IP reduces external bargaining leverage over time.
- royalty range: 10–25% (2024)
- exclusive boosts installs: +15–40% (2024)
- renewal risk: impacts live ops continuity
- proprietary IP lowers supplier leverage
Supplier concentration in gaming: studios, cloud & regtech squeeze margins amid licensing pressure
Third‑party studios (Epic 88/12 vs typical 70/30) and a $200B global games market (2024) concentrate supplier leverage; blockbusters retain outsized negotiating power. Cloud providers (AWS 32%, Azure 23%, GCP 11% in 2024) and regtech vendors (≈USD 14B market) create switching frictions. Licensing (10–25% royalties; exclusive titles +15–40% installs) further pressures margins.
| Supplier | 2024 metric | Impact |
|---|---|---|
| Studios | 88/12 top split | High revenue share |
| Cloud | AWS32/AZ23/GCP11% | Pricing/uplift risk |
| Regtech | USD14B | Dependency |
What is included in the product
Detailed Word Document
Uncovers key drivers of competition, supplier and buyer power, substitute threats, and entry barriers specific to Bragg, highlighting disruptive forces and strategic levers to protect market share and profitability.
Customizable Excel Spreadsheet
A single-sheet Bragg Porter Five Forces snapshot that quantifies competitive pressure, highlights actionable levers, and removes analysis friction for faster strategic decisions.
Customers Bargaining Power
Operator concentration
Tier-1 and tier-2 operators with multi-market footprints wield strong negotiating leverage, able to extract volume discounts, bespoke features and influence vendor roadmaps; in 2024 the global telecom services market exceeded $1.7 trillion, concentrating buyer power among a few large operators.
Losing a single large account can materially impact vendor revenue—major deals often represent double-digit percentages of B2B sales—so vendors mitigate risk by diversifying into mid-market operators to reduce dependency and stabilize revenue.
Switching costs
PAM and RGS integrations embed Bragg into operator workflows, increasing stickiness and making data migration and re-certification (ISO/IEC 27001, PCI DSS, GLI) real barriers to exit. As of 2024 REST/JSON standard APIs and modular stacks lower long-term switching costs. Value-add analytics and outsourced managed services further raise practical exit costs for operators.
Multi-sourcing
Operators commonly multi-source content, with 2024 industry surveys reporting about 75% of operators using three or more suppliers, increasing price transparency and buyer power through easy comparability. Exclusive content and localized jackpots can preserve pricing power by creating unique player value. Shifting to performance-based commercial models (revenue share or CPA tiers) aligns incentives and reduces commercial pushback.
Regulatory demands
Operators demand rapid cross-jurisdiction compliance updates; a 2024 industry survey found 59% rank update speed as a top procurement criterion, and vendors slow to adapt face increased rebid risk and contract churn. Superior regulatory coverage raises perceived vendor value and pricing power, while proactive certifications correlate with longer average contract duration.
- Update speed: 59% (2024 survey)
- Rebid risk: higher for slow compliance
- Certifications: extend contract length
Outcome accountability
Buyers prioritize KPIs such as GGR uplift, engagement and retention and in 2024 68% of platform buyers required measurable uplift metrics before renewing contracts. Underperforming content or features prompt renegotiation or reallocation of lobby space within 1–3 months. Demonstrated ROI via analytics lowers discount pressure, while co-marketing and time-limited feature trials sustain wallet share.
- GGR uplift focus
- Renegotiate or reallocate
- Analytics reduces discounts
- Co-marketing + trials retain spend
Buyers rule: telecom > $1.7T, 75% use 3+ vendors
Large multi-market operators concentrate buyer power; 2024 global telecom services > $1.7 trillion, enabling volume discounts and roadmap influence.
About 75% of operators use three or more suppliers, so price transparency is high; REST/JSON APIs lower switching costs while certifications (ISO/IEC 27001, PCI DSS, GLI) raise exit barriers.
68% require measurable GGR uplift to renew and 59% rank compliance update speed as a top procurement criterion.
| Metric | 2024 value |
|---|---|
| Global telecom services | $1.7T+ |
| Operators using 3+ suppliers | 75% |
| Require GGR uplift | 68% |
| Prioritize compliance update speed | 59% |
Preview the Actual Deliverable
Bragg Porter's Five Forces Analysis
This preview shows the exact Bragg Porter Five Forces analysis you'll receive—no placeholders or samples. The document is fully formatted, professionally written, and ready for immediate download upon purchase. Use it as-is for strategy, valuation, or presentation needs.











