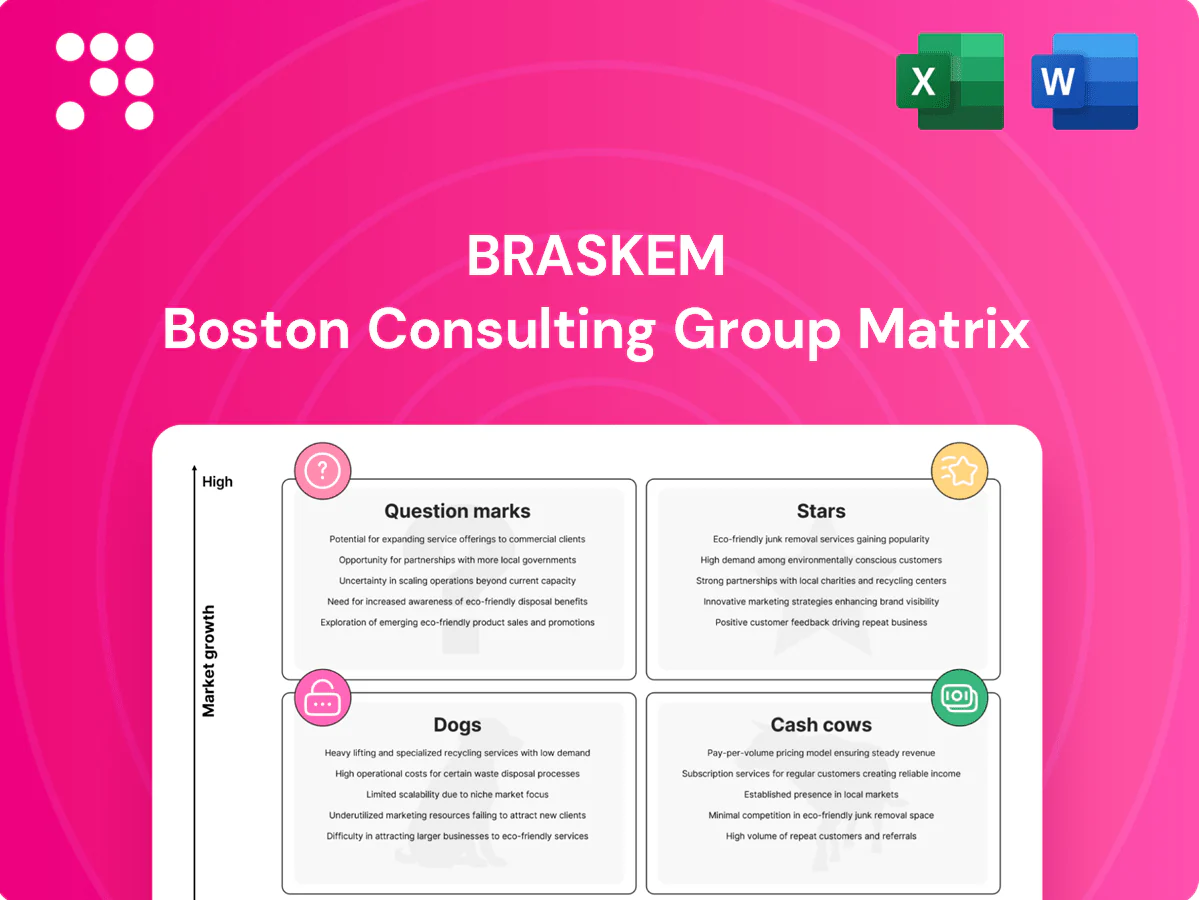
Braskem Boston Consulting Group Matrix

Actionable Strategy Starts Here
Braskem’s BCG Matrix snapshot shows where its product lines sit—who’s feeding growth, who’s funding it, and who’s dragging the portfolio down. This preview teases the quadrant placements; buy the full BCG Matrix for a complete, data-backed breakdown and clear strategic moves you can act on. Get the report in Word + a high-level Excel summary so you can present, decide, and allocate capital with confidence. Purchase now for fast, usable insights that save you hours of research.
Stars

“I’m green” bio‑based PE
Braskem’s I’m green bio‑based PE sits in a high‑growth low‑carbon packaging market estimated at roughly USD 260 billion in 2024 with ~6–7% CAGR, where Braskem is a recognized leader. Strong brand pull with CPG customers affords pricing power, but continued marketing and additional capacity are required to meet demand. The business is cash hungry today, yet scale and customer stickiness can convert it into a cash generator. Maintain investment to defend share as the category expands.
Circular PP/PE (mechanical & advanced)
Brands are racing toward recycled content as the EU targets 30% recycled plastic in packaging by 2030, driving fast market growth; recycled polyolefins demand rose sharply in 2023–24. Braskem’s early circular PP/PE projects and ISCC PLUS certifications have already won offtake wins, pushing share momentum. Building collection, sorting and offtake requires significant upfront cash, but continued feedstock partnerships can turn this into a scalable cash engine.

Healthcare & high‑spec polymers
Regulated, fast‑growing niches like IV bags, medical packaging and device housings underpin Braskem’s healthcare & high‑spec polymers, with the medical polymers market expanding roughly 5% in 2024 and strong demand for single‑use and sterile components. Braskem’s qualified grades and supply approvals lock in customers and raise switching costs, requiring ongoing application support and regulatory maintenance. Holding share here compounds into durable, higher‑margin profit streams.

Green ethylene platform
Owning green ethylene know-how makes Braskem a first mover, leveraging sugarcane‑based routes to capture rising brand demand for traceable low‑carbon inputs as polyethylene markets approach ≈100 Mt/year. Scaling, third‑party certification and supply‑assurance require capex and offtake agreements; nailing reliability turns green ethylene into the backbone for multiple green polymers.
- first‑mover
- traceable low‑carbon demand
- scale & certification needed
- supply assurance = backbone for green polymers
Brand-owner decarb alliances
Co‑development with global CPGs and autos surged in 2024, with industry reports showing a ~30% year‑over‑year increase in branded decarbonization partnerships; such deals anchor volume and validate premium recycled/renewable polymers while pilots often consume tens of millions in capex and OPEX and require 2–5 years to industrialize.
- Deal growth: ~30% YoY in 2024
- Pilot cost: tens of millions USD
- Time to scale: 2–5 years
- Outcome: lighthouse programs → repeatable, high‑share franchises
USD 260B low-carbon packaging market growing 6–7%
Braskem’s I’m green PE is a Star in a ~USD 260B 2024 low‑carbon packaging market growing ~6–7% CAGR, with strong CPG pull and pricing power but high capex needs. Recycled/green PP‑PE momentum (recycled demand surged 2023–24; co‑development deals +30% YoY in 2024) anchors growth yet needs tens of millions and 2–5 years to scale. Healthcare high‑spec polymers (~5% growth in 2024) and green ethylene (PE ≈100 Mt/yr) can convert this into a cash generator.
| Metric | 2024 | Note |
|---|---|---|
| Market size | USD 260B | Low‑carbon packaging |
| CAGR | 6–7% | 2024 base |
| Deal growth | +30% YoY | CPG co‑devs |
| Medical polymers | +5% | Market growth |
| PE market | ≈100 Mt/yr | Global scale |
What is included in the product
 Detailed Word Document
BCG analysis of Braskem’s portfolio: maps Stars, Cash Cows, Question Marks and Dogs with clear invest, hold, divest guidance.

 Customizable Excel Spreadsheet
One-page BCG matrix for Braskem, placing each business unit in a quadrant to spot priorities and cut complexity.
Cash Cows

Commodity PE in the Americas
Braskem's commodity PE in the Americas sits on a large installed base with deep customer ties and mature packaging demand growing roughly 1–2% CAGR; plants run at high utilization (around 90–95%), and integrated logistics convert that throughput into strong cash generation. Growth is modest so capex is disciplined (typically low single-digit percent of sales), while continuous efficiency improvements and reliable supply focus on protecting share.
Commodity PP in the Americas
Commodity PP in the Americas is a steady cash cow for Braskem, feeding packaging, consumer goods and automotive with ~5.0 million tpa regional PP capacity and stable plant utilization above 85% in 2024. Scale and long-term contracts helped protect margins, supporting Braskem’s ability to convert volumes into cash despite muted market growth of roughly 1–2% in 2024. Focus remains on optimizing mix, keeping plants full and banking cash.

PVC in construction cycles (LatAm)
Established pipes, profiles and fittings demand in LatAm (PVC market ~4 Mt in 2024) keeps Braskem as a core supplier across channels, generating mature-market, recurring replacement cycles and predictable cash flows; limited promotion is needed beyond distributor/channel support. Incremental debottlenecking in 2024 lifted PVC yields and incremental EBITDA contribution, reinforcing cash-cow status.

Integrated basic chemicals (ethylene/propylene)
Integrated basic chemicals ethylene/propylene remain Braskem cash cows in 2024, feeding internal resin production while enabling external sales; vertical integration smooths margins and reduces price volatility versus merchant producers.
Growth is low but reliable; disciplined cost control and plant uptime drive cash generation—prioritize reliability and energy efficiency to widen margin spread.
- Backbone feedstock for internal resins and exports
- Integration reduces volatility, improves margins
- Low growth, high cash generation via uptime/costs
- Focus: reliability, energy efficiency to widen spreads
Long‑term contracts & logistics footprint
Long‑term supply contracts and Braskem’s logistics footprint — spanning an installed capacity of about 21 million tonnes/year — lock in supply reliability, storage and distribution advantages that function as moat‑like economics; mature, sticky customer relationships reduce churn and compress SG&A, turning a non‑headline product set into a steady cash engine. Keep service levels high and costs tight to preserve margin.
- Supply reliability: long‑term contracts
- Logistics: integrated storage & distribution
- Scale: ~21 Mt/year capacity
- Economics: lower churn, reduced SG&A
- Priority: maintain service, control costs
Commodity PE/PP/PVC: low‑growth, high‑cash with 85–95% utilization and disciplined capex
Braskem’s commodity PE/PP/PVC and basic chemicals are low‑growth, high‑cash segments in 2024: ~21 Mt/year installed capacity, PP ~5.0 Mtpa, PVC ~4.0 Mt market, plant utilization 85–95%, packaging growth ~1–2% CAGR; disciplined capex (~low single‑digit % of sales) and integration drive steady free cash flow.
| Metric | 2024 |
|---|---|
| Installed capacity | ~21 Mt/year |
| PP capacity | ~5.0 Mtpa |
| PVC market | ~4.0 Mt |
| Utilization | 85–95% |
| Packaging CAGR | ~1–2% |
| Capex | Low single‑digit % of sales |
What You’re Viewing Is Included
Braskem BCG Matrix
The file you're previewing is the final Braskem BCG Matrix you'll receive after purchase. It maps Braskem's product lines and business units by market share and growth, tailored for strategic clarity and decision-making. No watermarks or demo content—fully formatted and ready to present, edit, or print. Purchase unlocks immediate download and delivery to your inbox.

Actionable Strategy Starts Here
Braskem’s BCG Matrix snapshot shows where its product lines sit—who’s feeding growth, who’s funding it, and who’s dragging the portfolio down. This preview teases the quadrant placements; buy the full BCG Matrix for a complete, data-backed breakdown and clear strategic moves you can act on. Get the report in Word + a high-level Excel summary so you can present, decide, and allocate capital with confidence. Purchase now for fast, usable insights that save you hours of research.
Stars
“I’m green” bio‑based PE
Braskem’s I’m green bio‑based PE sits in a high‑growth low‑carbon packaging market estimated at roughly USD 260 billion in 2024 with ~6–7% CAGR, where Braskem is a recognized leader. Strong brand pull with CPG customers affords pricing power, but continued marketing and additional capacity are required to meet demand. The business is cash hungry today, yet scale and customer stickiness can convert it into a cash generator. Maintain investment to defend share as the category expands.
Circular PP/PE (mechanical & advanced)
Brands are racing toward recycled content as the EU targets 30% recycled plastic in packaging by 2030, driving fast market growth; recycled polyolefins demand rose sharply in 2023–24. Braskem’s early circular PP/PE projects and ISCC PLUS certifications have already won offtake wins, pushing share momentum. Building collection, sorting and offtake requires significant upfront cash, but continued feedstock partnerships can turn this into a scalable cash engine.
Healthcare & high‑spec polymers
Regulated, fast‑growing niches like IV bags, medical packaging and device housings underpin Braskem’s healthcare & high‑spec polymers, with the medical polymers market expanding roughly 5% in 2024 and strong demand for single‑use and sterile components. Braskem’s qualified grades and supply approvals lock in customers and raise switching costs, requiring ongoing application support and regulatory maintenance. Holding share here compounds into durable, higher‑margin profit streams.
Green ethylene platform
Owning green ethylene know-how makes Braskem a first mover, leveraging sugarcane‑based routes to capture rising brand demand for traceable low‑carbon inputs as polyethylene markets approach ≈100 Mt/year. Scaling, third‑party certification and supply‑assurance require capex and offtake agreements; nailing reliability turns green ethylene into the backbone for multiple green polymers.
- first‑mover
- traceable low‑carbon demand
- scale & certification needed
- supply assurance = backbone for green polymers
Brand-owner decarb alliances
Co‑development with global CPGs and autos surged in 2024, with industry reports showing a ~30% year‑over‑year increase in branded decarbonization partnerships; such deals anchor volume and validate premium recycled/renewable polymers while pilots often consume tens of millions in capex and OPEX and require 2–5 years to industrialize.
- Deal growth: ~30% YoY in 2024
- Pilot cost: tens of millions USD
- Time to scale: 2–5 years
- Outcome: lighthouse programs → repeatable, high‑share franchises
USD 260B low-carbon packaging market growing 6–7%
Braskem’s I’m green PE is a Star in a ~USD 260B 2024 low‑carbon packaging market growing ~6–7% CAGR, with strong CPG pull and pricing power but high capex needs. Recycled/green PP‑PE momentum (recycled demand surged 2023–24; co‑development deals +30% YoY in 2024) anchors growth yet needs tens of millions and 2–5 years to scale. Healthcare high‑spec polymers (~5% growth in 2024) and green ethylene (PE ≈100 Mt/yr) can convert this into a cash generator.
| Metric | 2024 | Note |
|---|---|---|
| Market size | USD 260B | Low‑carbon packaging |
| CAGR | 6–7% | 2024 base |
| Deal growth | +30% YoY | CPG co‑devs |
| Medical polymers | +5% | Market growth |
| PE market | ≈100 Mt/yr | Global scale |
What is included in the product
Detailed Word Document
BCG analysis of Braskem’s portfolio: maps Stars, Cash Cows, Question Marks and Dogs with clear invest, hold, divest guidance.
Customizable Excel Spreadsheet
One-page BCG matrix for Braskem, placing each business unit in a quadrant to spot priorities and cut complexity.
Cash Cows
Commodity PE in the Americas
Braskem's commodity PE in the Americas sits on a large installed base with deep customer ties and mature packaging demand growing roughly 1–2% CAGR; plants run at high utilization (around 90–95%), and integrated logistics convert that throughput into strong cash generation. Growth is modest so capex is disciplined (typically low single-digit percent of sales), while continuous efficiency improvements and reliable supply focus on protecting share.
Commodity PP in the Americas
Commodity PP in the Americas is a steady cash cow for Braskem, feeding packaging, consumer goods and automotive with ~5.0 million tpa regional PP capacity and stable plant utilization above 85% in 2024. Scale and long-term contracts helped protect margins, supporting Braskem’s ability to convert volumes into cash despite muted market growth of roughly 1–2% in 2024. Focus remains on optimizing mix, keeping plants full and banking cash.
PVC in construction cycles (LatAm)
Established pipes, profiles and fittings demand in LatAm (PVC market ~4 Mt in 2024) keeps Braskem as a core supplier across channels, generating mature-market, recurring replacement cycles and predictable cash flows; limited promotion is needed beyond distributor/channel support. Incremental debottlenecking in 2024 lifted PVC yields and incremental EBITDA contribution, reinforcing cash-cow status.
Integrated basic chemicals (ethylene/propylene)
Integrated basic chemicals ethylene/propylene remain Braskem cash cows in 2024, feeding internal resin production while enabling external sales; vertical integration smooths margins and reduces price volatility versus merchant producers.
Growth is low but reliable; disciplined cost control and plant uptime drive cash generation—prioritize reliability and energy efficiency to widen margin spread.
- Backbone feedstock for internal resins and exports
- Integration reduces volatility, improves margins
- Low growth, high cash generation via uptime/costs
- Focus: reliability, energy efficiency to widen spreads
Long‑term contracts & logistics footprint
Long‑term supply contracts and Braskem’s logistics footprint — spanning an installed capacity of about 21 million tonnes/year — lock in supply reliability, storage and distribution advantages that function as moat‑like economics; mature, sticky customer relationships reduce churn and compress SG&A, turning a non‑headline product set into a steady cash engine. Keep service levels high and costs tight to preserve margin.
- Supply reliability: long‑term contracts
- Logistics: integrated storage & distribution
- Scale: ~21 Mt/year capacity
- Economics: lower churn, reduced SG&A
- Priority: maintain service, control costs
Commodity PE/PP/PVC: low‑growth, high‑cash with 85–95% utilization and disciplined capex
Braskem’s commodity PE/PP/PVC and basic chemicals are low‑growth, high‑cash segments in 2024: ~21 Mt/year installed capacity, PP ~5.0 Mtpa, PVC ~4.0 Mt market, plant utilization 85–95%, packaging growth ~1–2% CAGR; disciplined capex (~low single‑digit % of sales) and integration drive steady free cash flow.
| Metric | 2024 |
|---|---|
| Installed capacity | ~21 Mt/year |
| PP capacity | ~5.0 Mtpa |
| PVC market | ~4.0 Mt |
| Utilization | 85–95% |
| Packaging CAGR | ~1–2% |
| Capex | Low single‑digit % of sales |
What You’re Viewing Is Included
Braskem BCG Matrix
The file you're previewing is the final Braskem BCG Matrix you'll receive after purchase. It maps Braskem's product lines and business units by market share and growth, tailored for strategic clarity and decision-making. No watermarks or demo content—fully formatted and ready to present, edit, or print. Purchase unlocks immediate download and delivery to your inbox.
Description
Actionable Strategy Starts Here
Braskem’s BCG Matrix snapshot shows where its product lines sit—who’s feeding growth, who’s funding it, and who’s dragging the portfolio down. This preview teases the quadrant placements; buy the full BCG Matrix for a complete, data-backed breakdown and clear strategic moves you can act on. Get the report in Word + a high-level Excel summary so you can present, decide, and allocate capital with confidence. Purchase now for fast, usable insights that save you hours of research.
Stars
“I’m green” bio‑based PE
Braskem’s I’m green bio‑based PE sits in a high‑growth low‑carbon packaging market estimated at roughly USD 260 billion in 2024 with ~6–7% CAGR, where Braskem is a recognized leader. Strong brand pull with CPG customers affords pricing power, but continued marketing and additional capacity are required to meet demand. The business is cash hungry today, yet scale and customer stickiness can convert it into a cash generator. Maintain investment to defend share as the category expands.
Circular PP/PE (mechanical & advanced)
Brands are racing toward recycled content as the EU targets 30% recycled plastic in packaging by 2030, driving fast market growth; recycled polyolefins demand rose sharply in 2023–24. Braskem’s early circular PP/PE projects and ISCC PLUS certifications have already won offtake wins, pushing share momentum. Building collection, sorting and offtake requires significant upfront cash, but continued feedstock partnerships can turn this into a scalable cash engine.
Healthcare & high‑spec polymers
Regulated, fast‑growing niches like IV bags, medical packaging and device housings underpin Braskem’s healthcare & high‑spec polymers, with the medical polymers market expanding roughly 5% in 2024 and strong demand for single‑use and sterile components. Braskem’s qualified grades and supply approvals lock in customers and raise switching costs, requiring ongoing application support and regulatory maintenance. Holding share here compounds into durable, higher‑margin profit streams.
Green ethylene platform
Owning green ethylene know-how makes Braskem a first mover, leveraging sugarcane‑based routes to capture rising brand demand for traceable low‑carbon inputs as polyethylene markets approach ≈100 Mt/year. Scaling, third‑party certification and supply‑assurance require capex and offtake agreements; nailing reliability turns green ethylene into the backbone for multiple green polymers.
- first‑mover
- traceable low‑carbon demand
- scale & certification needed
- supply assurance = backbone for green polymers
Brand-owner decarb alliances
Co‑development with global CPGs and autos surged in 2024, with industry reports showing a ~30% year‑over‑year increase in branded decarbonization partnerships; such deals anchor volume and validate premium recycled/renewable polymers while pilots often consume tens of millions in capex and OPEX and require 2–5 years to industrialize.
- Deal growth: ~30% YoY in 2024
- Pilot cost: tens of millions USD
- Time to scale: 2–5 years
- Outcome: lighthouse programs → repeatable, high‑share franchises
USD 260B low-carbon packaging market growing 6–7%
Braskem’s I’m green PE is a Star in a ~USD 260B 2024 low‑carbon packaging market growing ~6–7% CAGR, with strong CPG pull and pricing power but high capex needs. Recycled/green PP‑PE momentum (recycled demand surged 2023–24; co‑development deals +30% YoY in 2024) anchors growth yet needs tens of millions and 2–5 years to scale. Healthcare high‑spec polymers (~5% growth in 2024) and green ethylene (PE ≈100 Mt/yr) can convert this into a cash generator.
| Metric | 2024 | Note |
|---|---|---|
| Market size | USD 260B | Low‑carbon packaging |
| CAGR | 6–7% | 2024 base |
| Deal growth | +30% YoY | CPG co‑devs |
| Medical polymers | +5% | Market growth |
| PE market | ≈100 Mt/yr | Global scale |
What is included in the product
Detailed Word Document
BCG analysis of Braskem’s portfolio: maps Stars, Cash Cows, Question Marks and Dogs with clear invest, hold, divest guidance.
Customizable Excel Spreadsheet
One-page BCG matrix for Braskem, placing each business unit in a quadrant to spot priorities and cut complexity.
Cash Cows
Commodity PE in the Americas
Braskem's commodity PE in the Americas sits on a large installed base with deep customer ties and mature packaging demand growing roughly 1–2% CAGR; plants run at high utilization (around 90–95%), and integrated logistics convert that throughput into strong cash generation. Growth is modest so capex is disciplined (typically low single-digit percent of sales), while continuous efficiency improvements and reliable supply focus on protecting share.
Commodity PP in the Americas
Commodity PP in the Americas is a steady cash cow for Braskem, feeding packaging, consumer goods and automotive with ~5.0 million tpa regional PP capacity and stable plant utilization above 85% in 2024. Scale and long-term contracts helped protect margins, supporting Braskem’s ability to convert volumes into cash despite muted market growth of roughly 1–2% in 2024. Focus remains on optimizing mix, keeping plants full and banking cash.
PVC in construction cycles (LatAm)
Established pipes, profiles and fittings demand in LatAm (PVC market ~4 Mt in 2024) keeps Braskem as a core supplier across channels, generating mature-market, recurring replacement cycles and predictable cash flows; limited promotion is needed beyond distributor/channel support. Incremental debottlenecking in 2024 lifted PVC yields and incremental EBITDA contribution, reinforcing cash-cow status.
Integrated basic chemicals (ethylene/propylene)
Integrated basic chemicals ethylene/propylene remain Braskem cash cows in 2024, feeding internal resin production while enabling external sales; vertical integration smooths margins and reduces price volatility versus merchant producers.
Growth is low but reliable; disciplined cost control and plant uptime drive cash generation—prioritize reliability and energy efficiency to widen margin spread.
- Backbone feedstock for internal resins and exports
- Integration reduces volatility, improves margins
- Low growth, high cash generation via uptime/costs
- Focus: reliability, energy efficiency to widen spreads
Long‑term contracts & logistics footprint
Long‑term supply contracts and Braskem’s logistics footprint — spanning an installed capacity of about 21 million tonnes/year — lock in supply reliability, storage and distribution advantages that function as moat‑like economics; mature, sticky customer relationships reduce churn and compress SG&A, turning a non‑headline product set into a steady cash engine. Keep service levels high and costs tight to preserve margin.
- Supply reliability: long‑term contracts
- Logistics: integrated storage & distribution
- Scale: ~21 Mt/year capacity
- Economics: lower churn, reduced SG&A
- Priority: maintain service, control costs
Commodity PE/PP/PVC: low‑growth, high‑cash with 85–95% utilization and disciplined capex
Braskem’s commodity PE/PP/PVC and basic chemicals are low‑growth, high‑cash segments in 2024: ~21 Mt/year installed capacity, PP ~5.0 Mtpa, PVC ~4.0 Mt market, plant utilization 85–95%, packaging growth ~1–2% CAGR; disciplined capex (~low single‑digit % of sales) and integration drive steady free cash flow.
| Metric | 2024 |
|---|---|
| Installed capacity | ~21 Mt/year |
| PP capacity | ~5.0 Mtpa |
| PVC market | ~4.0 Mt |
| Utilization | 85–95% |
| Packaging CAGR | ~1–2% |
| Capex | Low single‑digit % of sales |
What You’re Viewing Is Included
Braskem BCG Matrix
The file you're previewing is the final Braskem BCG Matrix you'll receive after purchase. It maps Braskem's product lines and business units by market share and growth, tailored for strategic clarity and decision-making. No watermarks or demo content—fully formatted and ready to present, edit, or print. Purchase unlocks immediate download and delivery to your inbox.











