Bravura Solutions Porter's Five Forces Analysis

Go Beyond the Preview—Access the Full Strategic Report
Bravura Solutions faces nuanced competitive pressures—from concentrated buyer demands to evolving fintech substitutes—and this snapshot highlights key friction points and strategic levers. To understand supplier influence, entry barriers, and rivalry intensity with actionable ratings and visuals, access the full Porter's Five Forces Analysis. Unlock the complete report to inform investment decisions and sharpen strategic planning.
Suppliers Bargaining Power

Dependence on hyperscalers
Bravura depends on hyperscalers for hosting, resilience and global reach, exposing it to concentrated pricing power from AWS, Azure and GCP, which held roughly 31%, 23% and 11% of global cloud market share in 2024. Multi-cloud and private hosting can reduce vendor dependence but increase operational complexity and costs. Use of service credits and multi-year commitments partially cushions cost volatility and secures capacity.
Specialist data vendors
Market/pricing feeds, KYC/AML, tax and actuarial inputs come from niche vendors, creating high switching costs because of integration and validation work; many contracts include vendor-specific formats and SLAs (commonly 99.9% uptime) that deepen dependence. Bulk purchasing agreements and standardized APIs (REST/JSON, FIX) and data schemas materially reduce integration overhead and supplier lock-in.

Skilled engineering talent
Senior engineers, domain SMEs and security specialists are scarce and in 2024 commanded wage premiums of roughly 20–40%, with US cybersecurity roles commonly exceeding $150,000 annual pay; this shifts supplier power toward talent in regulated fintech. Offshore/nearshore hubs can cut labor costs by 30–60% but typically add 15–25% coordination overhead. Strong EVP and structured training pipelines can halve attrition and materially reduce hiring premiums.

Implementation partners
System integrators and consulting partners strongly influence Bravura's delivery capacity and timelines; 2024 industry data show 72% of enterprise implementations depend on external SIs, pressuring margins when SI bill rates (commonly $120–$250/hr) and availability tighten. Certifying multiple partners reduces concentration risk, while co-selling and standardized playbooks curb scope creep and margin erosion.
- SI influence on timelines — 72% reliance (2024)
- Bill rates pressure — $120–$250/hr
- Multiple certifications — reduces concentration risk
- Co-selling + playbooks — limits scope creep
Third‑party components
Third-party workflow, reporting and database engines embed upstream dependency risk for Bravura, with licensing-model shifts (eg moving to per-core or per-user) able to materially change unit economics and margins.
Open-source alternatives can cut license spend but often raise support and integration costs and operational risk; contractual step-in rights and escrow arrangements are used to protect continuity and client trust.
- Dependency risk: embedded engines
- Licensing: per-core/user affects unit economics
- Open-source: lower license cost, higher support burden
- Continuity: step-in rights and escrow mitigations
Hyperscaler concentration, talent premium and SI reliance create material margin risks
Bravura faces concentrated supplier power from hyperscalers (AWS 31%, Azure 23%, GCP 11% in 2024), niche data vendors and scarce fintech talent (wage premium 20–40%, US cyber roles >$150,000). SIs drive delivery (72% reliance; bill rates $120–$250/hr), while embedded engines and license-model shifts can materially hit margins; multi-cloud, standard APIs and escrow mitigate risks.
| Supplier | 2024 metric |
|---|---|
| Hyperscalers | AWS 31% / Azure 23% / GCP 11% |
| Talent | Wage premium 20–40%; cyber >$150k |
| SIs | 72% reliance; $120–$250/hr |
What is included in the product
 Detailed Word Document
Tailored Porter's Five Forces analysis for Bravura Solutions examining competitive rivalry, buyer and supplier power, threats from new entrants and substitutes, and industry dynamics shaping pricing, margins and growth. Identifies disruptive technologies, regulatory and market entry risks, and strategic levers to defend market share and inform investor or internal strategy use.

 Customizable Excel Spreadsheet
A one-sheet Porter's Five Forces for Bravura Solutions that translates complex market pressures into a clean radar chart and editable ratings—ideal for fast strategic decisions, board slides, or scenario comparisons without needing macros.
Customers Bargaining Power

Large enterprise clients
Banks, insurers, super funds and administrators are concentrated, sophisticated buyers that run competitive RFPs and demand bespoke terms and proofs of compliance; Australia’s Big Four banks hold roughly 77% of banking assets and superannuation assets reached about A$3.3 trillion at June 2024. Their volume and reference value give strong negotiation leverage, but long implementation cycles, often exceeding 12 months, temper frequent switching.
High switching costs
High switching costs—data migration, compliance testing and retraining—create material exit barriers that blunt near-term price pressure once Bravura is embedded. With global IT spend near $5.1 trillion in 2024, customers face large migration budgets and downtime risks that favor incumbents. Buyers still exploit renewal windows to extract 5–10% discounts and tighter SLAs. Consistent roadmap delivery sustains client stickiness.

Cost-out mandates
Clients face sustained fee compression and rising compliance costs, increasing price sensitivity and pushing procurement toward outcome-based pricing and SaaS consumption models. Buyers increasingly accept reduced customization to achieve lower total cost of ownership, requesting clear ROI and automation metrics. Demonstrable automation savings and well-documented ROI remain the primary defenses for maintaining premium pricing.

Customization demands
Complex pension and life rules drive frequent configuration and change requests, and unmanaged scope expansion can erode vendor margins as work shifts from coding to configuration with standardized modules and APIs; governance and capped change budgets are essential to balance delivered value and cost.
- Configuration over code: reduces dev effort, increases change volume
- Scope control: prevents margin erosion on fixed-price work
- APIs/modules: shift effort to configuration and integration
- Governance/budgets: align change value with cost
Multi-year contracts
Multi-year contracts (typically 3–7 years) give Bravura revenue visibility and predictable ARR but concentrate risk at renewal when large clients decide to leave.
Buyers use benchmarking and audit rights at renewal to press prices and scope; uplift caps (commonly 2–4%) and CPI links further limit pricing flexibility.
Bundling of implementation, support and managed services increases switching costs and can lift retention rates for core platforms.
- Term length: 3–7 years
- Uplift caps: commonly 2–4% or CPI-linked
- Renewal pressure: benchmarking and audit rights
- Retention tool: embedded services bundling
Concentrated buyers (~77%) drive multi-year, low-churn contracts and incumbent edge
Banks, insurers and super funds are concentrated, sophisticated buyers (Australia’s Big Four ~77% of banking assets; superannuation A$3.3T at June 2024) who run competitive RFPs and demand compliance, giving strong leverage but long (>12 months) implementation cycles limit churn. High switching costs and multi-year contracts (3–7 yrs) sustain stickiness despite 5–10% renewal discount pressure. Uplift caps commonly 2–4% and global IT spend ~US$5.1T (2024) favor incumbents.
| Metric | Value |
|---|---|
| Big Four share | ~77% |
| Super assets (Jun 2024) | A$3.3T |
| Global IT spend (2024) | US$5.1T |
| Typical contract | 3–7 yrs |
| Renewal discount | 5–10% |
| Uplift caps | 2–4% |
Preview the Actual Deliverable
Bravura Solutions Porter's Five Forces Analysis
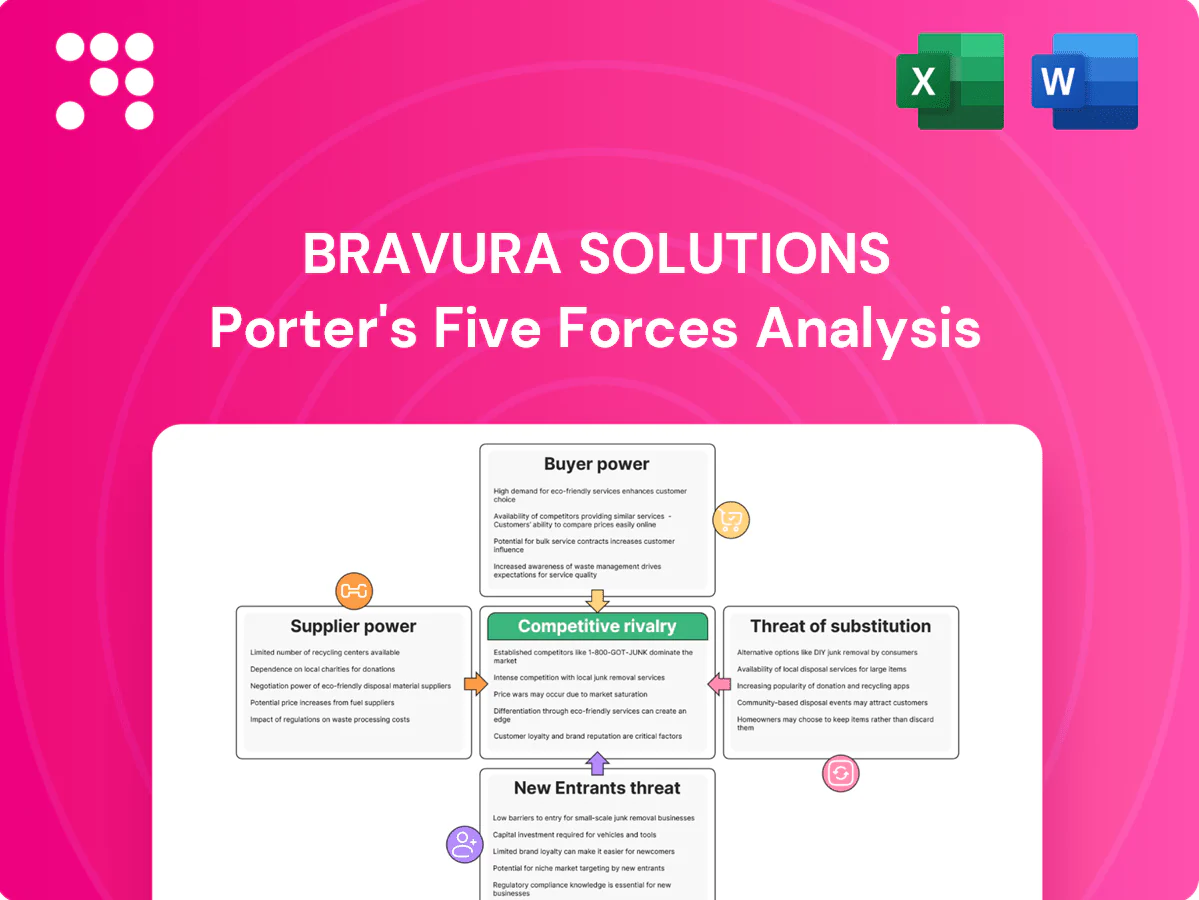
This preview shows the exact Bravura Solutions Porter’s Five Forces analysis you’ll receive—no placeholders, no mockups. The document is fully formatted, professionally written and ready for immediate download upon purchase. What you see here is precisely the deliverable you’ll get.

Go Beyond the Preview—Access the Full Strategic Report
Bravura Solutions faces nuanced competitive pressures—from concentrated buyer demands to evolving fintech substitutes—and this snapshot highlights key friction points and strategic levers. To understand supplier influence, entry barriers, and rivalry intensity with actionable ratings and visuals, access the full Porter's Five Forces Analysis. Unlock the complete report to inform investment decisions and sharpen strategic planning.
Suppliers Bargaining Power
Dependence on hyperscalers
Bravura depends on hyperscalers for hosting, resilience and global reach, exposing it to concentrated pricing power from AWS, Azure and GCP, which held roughly 31%, 23% and 11% of global cloud market share in 2024. Multi-cloud and private hosting can reduce vendor dependence but increase operational complexity and costs. Use of service credits and multi-year commitments partially cushions cost volatility and secures capacity.
Specialist data vendors
Market/pricing feeds, KYC/AML, tax and actuarial inputs come from niche vendors, creating high switching costs because of integration and validation work; many contracts include vendor-specific formats and SLAs (commonly 99.9% uptime) that deepen dependence. Bulk purchasing agreements and standardized APIs (REST/JSON, FIX) and data schemas materially reduce integration overhead and supplier lock-in.
Skilled engineering talent
Senior engineers, domain SMEs and security specialists are scarce and in 2024 commanded wage premiums of roughly 20–40%, with US cybersecurity roles commonly exceeding $150,000 annual pay; this shifts supplier power toward talent in regulated fintech. Offshore/nearshore hubs can cut labor costs by 30–60% but typically add 15–25% coordination overhead. Strong EVP and structured training pipelines can halve attrition and materially reduce hiring premiums.
Implementation partners
System integrators and consulting partners strongly influence Bravura's delivery capacity and timelines; 2024 industry data show 72% of enterprise implementations depend on external SIs, pressuring margins when SI bill rates (commonly $120–$250/hr) and availability tighten. Certifying multiple partners reduces concentration risk, while co-selling and standardized playbooks curb scope creep and margin erosion.
- SI influence on timelines — 72% reliance (2024)
- Bill rates pressure — $120–$250/hr
- Multiple certifications — reduces concentration risk
- Co-selling + playbooks — limits scope creep
Third‑party components
Third-party workflow, reporting and database engines embed upstream dependency risk for Bravura, with licensing-model shifts (eg moving to per-core or per-user) able to materially change unit economics and margins.
Open-source alternatives can cut license spend but often raise support and integration costs and operational risk; contractual step-in rights and escrow arrangements are used to protect continuity and client trust.
- Dependency risk: embedded engines
- Licensing: per-core/user affects unit economics
- Open-source: lower license cost, higher support burden
- Continuity: step-in rights and escrow mitigations
Hyperscaler concentration, talent premium and SI reliance create material margin risks
Bravura faces concentrated supplier power from hyperscalers (AWS 31%, Azure 23%, GCP 11% in 2024), niche data vendors and scarce fintech talent (wage premium 20–40%, US cyber roles >$150,000). SIs drive delivery (72% reliance; bill rates $120–$250/hr), while embedded engines and license-model shifts can materially hit margins; multi-cloud, standard APIs and escrow mitigate risks.
| Supplier | 2024 metric |
|---|---|
| Hyperscalers | AWS 31% / Azure 23% / GCP 11% |
| Talent | Wage premium 20–40%; cyber >$150k |
| SIs | 72% reliance; $120–$250/hr |
What is included in the product
Detailed Word Document
Tailored Porter's Five Forces analysis for Bravura Solutions examining competitive rivalry, buyer and supplier power, threats from new entrants and substitutes, and industry dynamics shaping pricing, margins and growth. Identifies disruptive technologies, regulatory and market entry risks, and strategic levers to defend market share and inform investor or internal strategy use.
Customizable Excel Spreadsheet
A one-sheet Porter's Five Forces for Bravura Solutions that translates complex market pressures into a clean radar chart and editable ratings—ideal for fast strategic decisions, board slides, or scenario comparisons without needing macros.
Customers Bargaining Power
Large enterprise clients
Banks, insurers, super funds and administrators are concentrated, sophisticated buyers that run competitive RFPs and demand bespoke terms and proofs of compliance; Australia’s Big Four banks hold roughly 77% of banking assets and superannuation assets reached about A$3.3 trillion at June 2024. Their volume and reference value give strong negotiation leverage, but long implementation cycles, often exceeding 12 months, temper frequent switching.
High switching costs
High switching costs—data migration, compliance testing and retraining—create material exit barriers that blunt near-term price pressure once Bravura is embedded. With global IT spend near $5.1 trillion in 2024, customers face large migration budgets and downtime risks that favor incumbents. Buyers still exploit renewal windows to extract 5–10% discounts and tighter SLAs. Consistent roadmap delivery sustains client stickiness.
Cost-out mandates
Clients face sustained fee compression and rising compliance costs, increasing price sensitivity and pushing procurement toward outcome-based pricing and SaaS consumption models. Buyers increasingly accept reduced customization to achieve lower total cost of ownership, requesting clear ROI and automation metrics. Demonstrable automation savings and well-documented ROI remain the primary defenses for maintaining premium pricing.
Customization demands
Complex pension and life rules drive frequent configuration and change requests, and unmanaged scope expansion can erode vendor margins as work shifts from coding to configuration with standardized modules and APIs; governance and capped change budgets are essential to balance delivered value and cost.
- Configuration over code: reduces dev effort, increases change volume
- Scope control: prevents margin erosion on fixed-price work
- APIs/modules: shift effort to configuration and integration
- Governance/budgets: align change value with cost
Multi-year contracts
Multi-year contracts (typically 3–7 years) give Bravura revenue visibility and predictable ARR but concentrate risk at renewal when large clients decide to leave.
Buyers use benchmarking and audit rights at renewal to press prices and scope; uplift caps (commonly 2–4%) and CPI links further limit pricing flexibility.
Bundling of implementation, support and managed services increases switching costs and can lift retention rates for core platforms.
- Term length: 3–7 years
- Uplift caps: commonly 2–4% or CPI-linked
- Renewal pressure: benchmarking and audit rights
- Retention tool: embedded services bundling
Concentrated buyers (~77%) drive multi-year, low-churn contracts and incumbent edge
Banks, insurers and super funds are concentrated, sophisticated buyers (Australia’s Big Four ~77% of banking assets; superannuation A$3.3T at June 2024) who run competitive RFPs and demand compliance, giving strong leverage but long (>12 months) implementation cycles limit churn. High switching costs and multi-year contracts (3–7 yrs) sustain stickiness despite 5–10% renewal discount pressure. Uplift caps commonly 2–4% and global IT spend ~US$5.1T (2024) favor incumbents.
| Metric | Value |
|---|---|
| Big Four share | ~77% |
| Super assets (Jun 2024) | A$3.3T |
| Global IT spend (2024) | US$5.1T |
| Typical contract | 3–7 yrs |
| Renewal discount | 5–10% |
| Uplift caps | 2–4% |
Preview the Actual Deliverable
Bravura Solutions Porter's Five Forces Analysis
This preview shows the exact Bravura Solutions Porter’s Five Forces analysis you’ll receive—no placeholders, no mockups. The document is fully formatted, professionally written and ready for immediate download upon purchase. What you see here is precisely the deliverable you’ll get.
Description
Go Beyond the Preview—Access the Full Strategic Report
Bravura Solutions faces nuanced competitive pressures—from concentrated buyer demands to evolving fintech substitutes—and this snapshot highlights key friction points and strategic levers. To understand supplier influence, entry barriers, and rivalry intensity with actionable ratings and visuals, access the full Porter's Five Forces Analysis. Unlock the complete report to inform investment decisions and sharpen strategic planning.
Suppliers Bargaining Power
Dependence on hyperscalers
Bravura depends on hyperscalers for hosting, resilience and global reach, exposing it to concentrated pricing power from AWS, Azure and GCP, which held roughly 31%, 23% and 11% of global cloud market share in 2024. Multi-cloud and private hosting can reduce vendor dependence but increase operational complexity and costs. Use of service credits and multi-year commitments partially cushions cost volatility and secures capacity.
Specialist data vendors
Market/pricing feeds, KYC/AML, tax and actuarial inputs come from niche vendors, creating high switching costs because of integration and validation work; many contracts include vendor-specific formats and SLAs (commonly 99.9% uptime) that deepen dependence. Bulk purchasing agreements and standardized APIs (REST/JSON, FIX) and data schemas materially reduce integration overhead and supplier lock-in.
Skilled engineering talent
Senior engineers, domain SMEs and security specialists are scarce and in 2024 commanded wage premiums of roughly 20–40%, with US cybersecurity roles commonly exceeding $150,000 annual pay; this shifts supplier power toward talent in regulated fintech. Offshore/nearshore hubs can cut labor costs by 30–60% but typically add 15–25% coordination overhead. Strong EVP and structured training pipelines can halve attrition and materially reduce hiring premiums.
Implementation partners
System integrators and consulting partners strongly influence Bravura's delivery capacity and timelines; 2024 industry data show 72% of enterprise implementations depend on external SIs, pressuring margins when SI bill rates (commonly $120–$250/hr) and availability tighten. Certifying multiple partners reduces concentration risk, while co-selling and standardized playbooks curb scope creep and margin erosion.
- SI influence on timelines — 72% reliance (2024)
- Bill rates pressure — $120–$250/hr
- Multiple certifications — reduces concentration risk
- Co-selling + playbooks — limits scope creep
Third‑party components
Third-party workflow, reporting and database engines embed upstream dependency risk for Bravura, with licensing-model shifts (eg moving to per-core or per-user) able to materially change unit economics and margins.
Open-source alternatives can cut license spend but often raise support and integration costs and operational risk; contractual step-in rights and escrow arrangements are used to protect continuity and client trust.
- Dependency risk: embedded engines
- Licensing: per-core/user affects unit economics
- Open-source: lower license cost, higher support burden
- Continuity: step-in rights and escrow mitigations
Hyperscaler concentration, talent premium and SI reliance create material margin risks
Bravura faces concentrated supplier power from hyperscalers (AWS 31%, Azure 23%, GCP 11% in 2024), niche data vendors and scarce fintech talent (wage premium 20–40%, US cyber roles >$150,000). SIs drive delivery (72% reliance; bill rates $120–$250/hr), while embedded engines and license-model shifts can materially hit margins; multi-cloud, standard APIs and escrow mitigate risks.
| Supplier | 2024 metric |
|---|---|
| Hyperscalers | AWS 31% / Azure 23% / GCP 11% |
| Talent | Wage premium 20–40%; cyber >$150k |
| SIs | 72% reliance; $120–$250/hr |
What is included in the product
Detailed Word Document
Tailored Porter's Five Forces analysis for Bravura Solutions examining competitive rivalry, buyer and supplier power, threats from new entrants and substitutes, and industry dynamics shaping pricing, margins and growth. Identifies disruptive technologies, regulatory and market entry risks, and strategic levers to defend market share and inform investor or internal strategy use.
Customizable Excel Spreadsheet
A one-sheet Porter's Five Forces for Bravura Solutions that translates complex market pressures into a clean radar chart and editable ratings—ideal for fast strategic decisions, board slides, or scenario comparisons without needing macros.
Customers Bargaining Power
Large enterprise clients
Banks, insurers, super funds and administrators are concentrated, sophisticated buyers that run competitive RFPs and demand bespoke terms and proofs of compliance; Australia’s Big Four banks hold roughly 77% of banking assets and superannuation assets reached about A$3.3 trillion at June 2024. Their volume and reference value give strong negotiation leverage, but long implementation cycles, often exceeding 12 months, temper frequent switching.
High switching costs
High switching costs—data migration, compliance testing and retraining—create material exit barriers that blunt near-term price pressure once Bravura is embedded. With global IT spend near $5.1 trillion in 2024, customers face large migration budgets and downtime risks that favor incumbents. Buyers still exploit renewal windows to extract 5–10% discounts and tighter SLAs. Consistent roadmap delivery sustains client stickiness.
Cost-out mandates
Clients face sustained fee compression and rising compliance costs, increasing price sensitivity and pushing procurement toward outcome-based pricing and SaaS consumption models. Buyers increasingly accept reduced customization to achieve lower total cost of ownership, requesting clear ROI and automation metrics. Demonstrable automation savings and well-documented ROI remain the primary defenses for maintaining premium pricing.
Customization demands
Complex pension and life rules drive frequent configuration and change requests, and unmanaged scope expansion can erode vendor margins as work shifts from coding to configuration with standardized modules and APIs; governance and capped change budgets are essential to balance delivered value and cost.
- Configuration over code: reduces dev effort, increases change volume
- Scope control: prevents margin erosion on fixed-price work
- APIs/modules: shift effort to configuration and integration
- Governance/budgets: align change value with cost
Multi-year contracts
Multi-year contracts (typically 3–7 years) give Bravura revenue visibility and predictable ARR but concentrate risk at renewal when large clients decide to leave.
Buyers use benchmarking and audit rights at renewal to press prices and scope; uplift caps (commonly 2–4%) and CPI links further limit pricing flexibility.
Bundling of implementation, support and managed services increases switching costs and can lift retention rates for core platforms.
- Term length: 3–7 years
- Uplift caps: commonly 2–4% or CPI-linked
- Renewal pressure: benchmarking and audit rights
- Retention tool: embedded services bundling
Concentrated buyers (~77%) drive multi-year, low-churn contracts and incumbent edge
Banks, insurers and super funds are concentrated, sophisticated buyers (Australia’s Big Four ~77% of banking assets; superannuation A$3.3T at June 2024) who run competitive RFPs and demand compliance, giving strong leverage but long (>12 months) implementation cycles limit churn. High switching costs and multi-year contracts (3–7 yrs) sustain stickiness despite 5–10% renewal discount pressure. Uplift caps commonly 2–4% and global IT spend ~US$5.1T (2024) favor incumbents.
| Metric | Value |
|---|---|
| Big Four share | ~77% |
| Super assets (Jun 2024) | A$3.3T |
| Global IT spend (2024) | US$5.1T |
| Typical contract | 3–7 yrs |
| Renewal discount | 5–10% |
| Uplift caps | 2–4% |
Preview the Actual Deliverable
Bravura Solutions Porter's Five Forces Analysis
This preview shows the exact Bravura Solutions Porter’s Five Forces analysis you’ll receive—no placeholders, no mockups. The document is fully formatted, professionally written and ready for immediate download upon purchase. What you see here is precisely the deliverable you’ll get.











