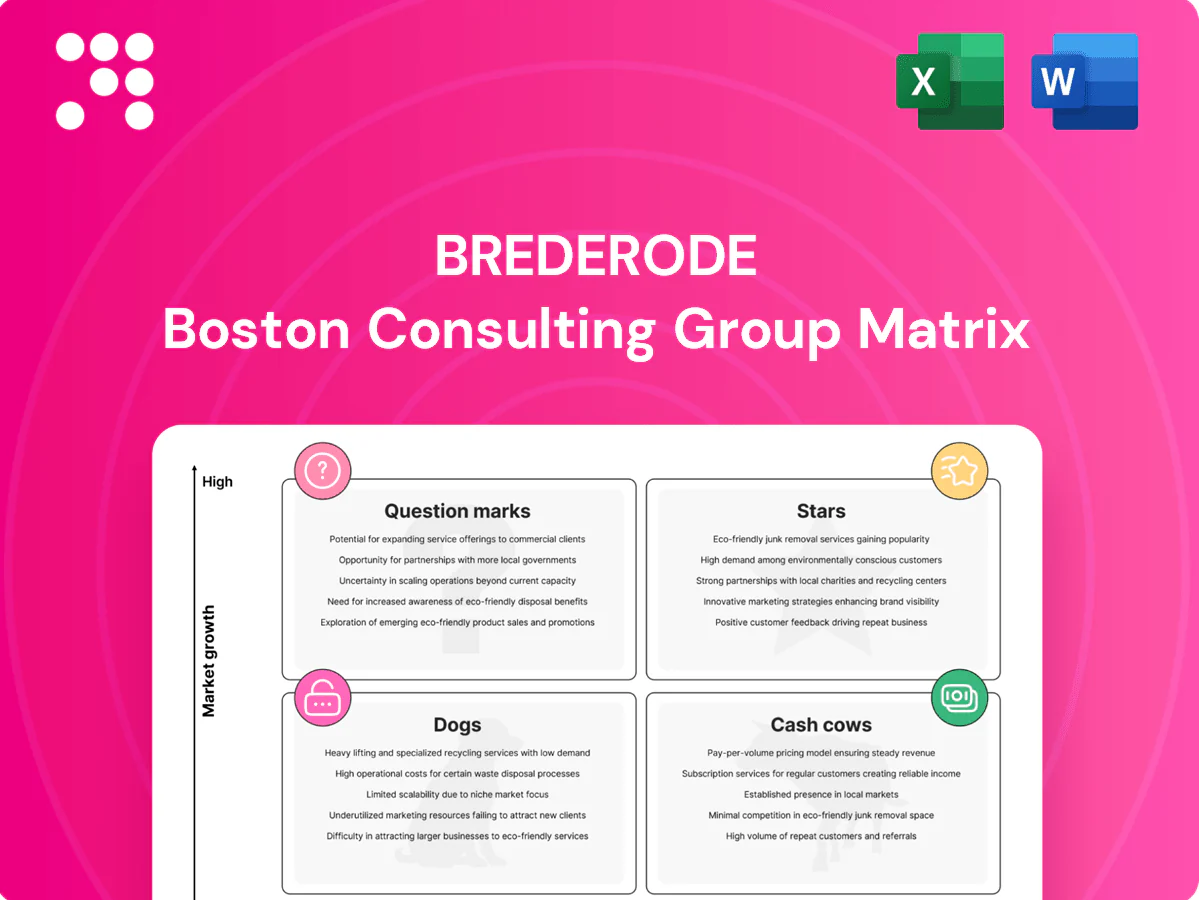
Brederode Boston Consulting Group Matrix

Actionable Strategy Starts Here
The Brederode BCG Matrix snapshot shows where each product lands—Stars driving growth, Cash Cows funding the engine, Question Marks that need bets, and Dogs dragging focus. Want the full picture? Purchase the complete BCG Matrix for quadrant-by-quadrant placement, data-backed recommendations, and an actionable roadmap to reallocate capital and prioritize R&D. Delivered in ready-to-use Word and Excel formats, it’s the strategic shortcut every founder and CFO needs—grab it and move faster.
Stars

Category leaders in software/SaaS
Minority stakes in category-leading SaaS platforms delivering 30–80% ARR growth in 2024, with logos valued as premium and net retention commonly running 120–140%. Revenue is sticky and compounding; companies reinvest heavily, with S&M and R&D often consuming 40–60% of revenue to fund GTM and product. They burn cash short-term but the customer flywheel converts Stars into Cash Cows over a multi‑year horizon.
Healthcare tech with scale momentum
Diagnostics, data and clinical tools are winning share in a >$300B global digital health market in 2024, with in vitro diagnostics and AI-assisted imaging showing double-digit growth and durable clinical/regulatory moats; roll-up of adjacent specialties remains wide open. Heavy reinvestment now preserves optionality—funding should continue to support scale, clinical validation, and regulatory pathways to capture long-term margin expansion.

Energy transition champions
Platforms tied to grid, storage, efficiency show visible pipelines—global grid-scale battery pipeline exceeded 500 GW in 2024, with utility-scale storage deployments up ~60% year-on-year. Policy tailwinds like the US IRA and EU Green Deal plus industrial scale give lead-dog status; large developers report 2–3 years of order backlog. Capital intensive but cash in equals cash out now; maintain share to harvest later.

Buyout co‑invests in dominant niches
Backed by top‑tier sponsors, these Stars set pricing in their micro‑markets; operational levers have driven mid‑teens organic revenue growth in 2024 and ~350 bps EBITDA margin expansion, letting Brederode ride along without fund fee drag while continuing add‑ons to defend leadership.
- Top sponsors
- Mid‑teens organic growth (2024)
- ~350 bps EBITDA uplift
- No fund fees drag
- Ongoing add‑ons
Fintech infrastructure with network effects
Fintech infrastructure with rails, risk and compliance layers embedded in client workflows drives strong network effects: each new integration deepens the moat and increases throughput, turning one-off revenues into platform stickiness. Marketing burns cash early, but at scale unit economics typically improve and CAC payback compresses. Stay the course to convert growth into steady yield.
- Rails + compliance = higher retention
- Each integration boosts TPV and stickiness
- Marketing heavy early; CAC falls with scale
- Focus on long-term yield conversion
Minority stakes in SaaS, digital health, grid storage — cash burn to cash cows
Minority stakes in SaaS leaders growing 30–80% ARR in 2024 with NRR 120–140% and heavy S&M/R&D reinvestment; cash burn now to become Cash Cows.
Digital health/diagnostics target a >$300B market (2024) with double‑digit growth and regulatory moats; roll‑ups remain open.
Grid/storage pipeline >500 GW (2024) with 2–3 year backlogs and policy tailwinds; capital intensity justified for scale.
| Metric | 2024 |
|---|---|
| SaaS ARR growth | 30–80% |
| NRR | 120–140% |
| Digital health TAM | >$300B |
| Grid pipeline | >500 GW |
What is included in the product
 Detailed Word Document
In-depth review of Brederode's products across BCG quadrants, with strategic moves to invest, hold, or divest per unit.

 Customizable Excel Spreadsheet
One-page overview placing each business unit in a quadrant—cuts confusion, speeds exec decisions.
Cash Cows

Dividend‑rich listed blue chips
Mature, dividend‑rich listed blue chips deliver predictable cash with low drama, often yielding around 2% while returning capital via dividends and buybacks (US buybacks exceeded $1T in 2023). Limited reinvestment needs make them ideal funding sources for newer bets and to cover fees. Strategy: maintain exposures rather than over‑optimize—steady cash funds growth initiatives and preserves portfolio stability.
Infrastructure yield platforms
Infrastructure yield platforms deliver high visibility with ~95% contracted cash flows over a 5-year horizon, CPI-linked escalators averaging 2.9% in 2024 and ~80% investment-grade counterparties; capex is planned (~5% of AUM) not surprise; distributions (~6.2% cash yield in 2024) cover overhead and seed €50m dry powder, while modest ops tweaks aim to lift efficiency marginally.

Scaled B2B recurring‑revenue plays
Scaled B2B recurring‑revenue plays show cooled growth to mid‑teens in 2024, churn typically around 4–6% and gross margins near 70–80%, with FCF margins about 15–25%. Market share is entrenched (>30–40% for leaders) as high switching costs sustain cash conversion; milk gently while refreshing product roadmaps.

Seasoned buyout funds in harvest mode
Seasoned buyout funds in harvest mode: legacy vintages are steadily selling assets and returning capital, with Brederode reporting portfolio realizations up 18% year‑over‑year in 2024, enabling orderly exits without heroics and faster capital recycling than new deployment.
- Harvest tempo: realizations +18% YoY (2024)
- Return profile: distributions outpacing new investments
- Recycling: capital redeployed into higher‑growth, higher‑risk strategies
Oligopoly industrials
Oligopoly industrials
Few large players drive rational pricing and predictable demand; 2024 sector free cash flow yields remained elevated, often above 5% as capex discipline plus recurring service revenue bolster margins. Free cash flow is the story—hold core positions, trim only on punchy valuations.- Few players, stable pricing
- Predictable demand, service revenue
- Capex discipline → FCF focus (2024: FCF yields >5%)
- Hold core; trim on rich valuations
Blue chips ~2%, infra ~6.2%, B2B 15–25%
Mature blue chips yield ~2% with steady buybacks (US >1T in 2023), funding growth; infrastructure shows ~95% contracted 5y cash, CPI +2.9% (2024) and ~6.2% cash yield; B2B leaders: churn 4–6%, FCF margins 15–25%; oligopoly industrials: FCF yields >5% (2024), hold core positions.
| Segment | 2024 Metric | Yield/Note |
|---|---|---|
| Blue chips | Buybacks >$1T (2023) | ~2% div |
| Infrastructure | 95% contracted, CPI+2.9% | ~6.2% |
| B2B | Churn 4–6% | FCF 15–25% |
| Industrials | Capex discipline | FCF >5% |
Full Transparency, Always
Brederode BCG Matrix
The file you're previewing is the exact Brederode BCG Matrix report you'll receive after purchase. No watermarks, no demo content—just the fully formatted, analysis-ready document designed for clarity. After payment you'll get the final file instantly, editable and printable for presentations or planning. Built by strategy pros, ready to plug into your workflow.

Actionable Strategy Starts Here
The Brederode BCG Matrix snapshot shows where each product lands—Stars driving growth, Cash Cows funding the engine, Question Marks that need bets, and Dogs dragging focus. Want the full picture? Purchase the complete BCG Matrix for quadrant-by-quadrant placement, data-backed recommendations, and an actionable roadmap to reallocate capital and prioritize R&D. Delivered in ready-to-use Word and Excel formats, it’s the strategic shortcut every founder and CFO needs—grab it and move faster.
Stars
Category leaders in software/SaaS
Minority stakes in category-leading SaaS platforms delivering 30–80% ARR growth in 2024, with logos valued as premium and net retention commonly running 120–140%. Revenue is sticky and compounding; companies reinvest heavily, with S&M and R&D often consuming 40–60% of revenue to fund GTM and product. They burn cash short-term but the customer flywheel converts Stars into Cash Cows over a multi‑year horizon.
Healthcare tech with scale momentum
Diagnostics, data and clinical tools are winning share in a >$300B global digital health market in 2024, with in vitro diagnostics and AI-assisted imaging showing double-digit growth and durable clinical/regulatory moats; roll-up of adjacent specialties remains wide open. Heavy reinvestment now preserves optionality—funding should continue to support scale, clinical validation, and regulatory pathways to capture long-term margin expansion.
Energy transition champions
Platforms tied to grid, storage, efficiency show visible pipelines—global grid-scale battery pipeline exceeded 500 GW in 2024, with utility-scale storage deployments up ~60% year-on-year. Policy tailwinds like the US IRA and EU Green Deal plus industrial scale give lead-dog status; large developers report 2–3 years of order backlog. Capital intensive but cash in equals cash out now; maintain share to harvest later.
Buyout co‑invests in dominant niches
Backed by top‑tier sponsors, these Stars set pricing in their micro‑markets; operational levers have driven mid‑teens organic revenue growth in 2024 and ~350 bps EBITDA margin expansion, letting Brederode ride along without fund fee drag while continuing add‑ons to defend leadership.
- Top sponsors
- Mid‑teens organic growth (2024)
- ~350 bps EBITDA uplift
- No fund fees drag
- Ongoing add‑ons
Fintech infrastructure with network effects
Fintech infrastructure with rails, risk and compliance layers embedded in client workflows drives strong network effects: each new integration deepens the moat and increases throughput, turning one-off revenues into platform stickiness. Marketing burns cash early, but at scale unit economics typically improve and CAC payback compresses. Stay the course to convert growth into steady yield.
- Rails + compliance = higher retention
- Each integration boosts TPV and stickiness
- Marketing heavy early; CAC falls with scale
- Focus on long-term yield conversion
Minority stakes in SaaS, digital health, grid storage — cash burn to cash cows
Minority stakes in SaaS leaders growing 30–80% ARR in 2024 with NRR 120–140% and heavy S&M/R&D reinvestment; cash burn now to become Cash Cows.
Digital health/diagnostics target a >$300B market (2024) with double‑digit growth and regulatory moats; roll‑ups remain open.
Grid/storage pipeline >500 GW (2024) with 2–3 year backlogs and policy tailwinds; capital intensity justified for scale.
| Metric | 2024 |
|---|---|
| SaaS ARR growth | 30–80% |
| NRR | 120–140% |
| Digital health TAM | >$300B |
| Grid pipeline | >500 GW |
What is included in the product
Detailed Word Document
In-depth review of Brederode's products across BCG quadrants, with strategic moves to invest, hold, or divest per unit.
Customizable Excel Spreadsheet
One-page overview placing each business unit in a quadrant—cuts confusion, speeds exec decisions.
Cash Cows
Dividend‑rich listed blue chips
Mature, dividend‑rich listed blue chips deliver predictable cash with low drama, often yielding around 2% while returning capital via dividends and buybacks (US buybacks exceeded $1T in 2023). Limited reinvestment needs make them ideal funding sources for newer bets and to cover fees. Strategy: maintain exposures rather than over‑optimize—steady cash funds growth initiatives and preserves portfolio stability.
Infrastructure yield platforms
Infrastructure yield platforms deliver high visibility with ~95% contracted cash flows over a 5-year horizon, CPI-linked escalators averaging 2.9% in 2024 and ~80% investment-grade counterparties; capex is planned (~5% of AUM) not surprise; distributions (~6.2% cash yield in 2024) cover overhead and seed €50m dry powder, while modest ops tweaks aim to lift efficiency marginally.
Scaled B2B recurring‑revenue plays
Scaled B2B recurring‑revenue plays show cooled growth to mid‑teens in 2024, churn typically around 4–6% and gross margins near 70–80%, with FCF margins about 15–25%. Market share is entrenched (>30–40% for leaders) as high switching costs sustain cash conversion; milk gently while refreshing product roadmaps.
Seasoned buyout funds in harvest mode
Seasoned buyout funds in harvest mode: legacy vintages are steadily selling assets and returning capital, with Brederode reporting portfolio realizations up 18% year‑over‑year in 2024, enabling orderly exits without heroics and faster capital recycling than new deployment.
- Harvest tempo: realizations +18% YoY (2024)
- Return profile: distributions outpacing new investments
- Recycling: capital redeployed into higher‑growth, higher‑risk strategies
Oligopoly industrials
Oligopoly industrials
Few large players drive rational pricing and predictable demand; 2024 sector free cash flow yields remained elevated, often above 5% as capex discipline plus recurring service revenue bolster margins. Free cash flow is the story—hold core positions, trim only on punchy valuations.- Few players, stable pricing
- Predictable demand, service revenue
- Capex discipline → FCF focus (2024: FCF yields >5%)
- Hold core; trim on rich valuations
Blue chips ~2%, infra ~6.2%, B2B 15–25%
Mature blue chips yield ~2% with steady buybacks (US >1T in 2023), funding growth; infrastructure shows ~95% contracted 5y cash, CPI +2.9% (2024) and ~6.2% cash yield; B2B leaders: churn 4–6%, FCF margins 15–25%; oligopoly industrials: FCF yields >5% (2024), hold core positions.
| Segment | 2024 Metric | Yield/Note |
|---|---|---|
| Blue chips | Buybacks >$1T (2023) | ~2% div |
| Infrastructure | 95% contracted, CPI+2.9% | ~6.2% |
| B2B | Churn 4–6% | FCF 15–25% |
| Industrials | Capex discipline | FCF >5% |
Full Transparency, Always
Brederode BCG Matrix
The file you're previewing is the exact Brederode BCG Matrix report you'll receive after purchase. No watermarks, no demo content—just the fully formatted, analysis-ready document designed for clarity. After payment you'll get the final file instantly, editable and printable for presentations or planning. Built by strategy pros, ready to plug into your workflow.
Original: $10.00
-65%$10.00
$3.50Description
Actionable Strategy Starts Here
The Brederode BCG Matrix snapshot shows where each product lands—Stars driving growth, Cash Cows funding the engine, Question Marks that need bets, and Dogs dragging focus. Want the full picture? Purchase the complete BCG Matrix for quadrant-by-quadrant placement, data-backed recommendations, and an actionable roadmap to reallocate capital and prioritize R&D. Delivered in ready-to-use Word and Excel formats, it’s the strategic shortcut every founder and CFO needs—grab it and move faster.
Stars
Category leaders in software/SaaS
Minority stakes in category-leading SaaS platforms delivering 30–80% ARR growth in 2024, with logos valued as premium and net retention commonly running 120–140%. Revenue is sticky and compounding; companies reinvest heavily, with S&M and R&D often consuming 40–60% of revenue to fund GTM and product. They burn cash short-term but the customer flywheel converts Stars into Cash Cows over a multi‑year horizon.
Healthcare tech with scale momentum
Diagnostics, data and clinical tools are winning share in a >$300B global digital health market in 2024, with in vitro diagnostics and AI-assisted imaging showing double-digit growth and durable clinical/regulatory moats; roll-up of adjacent specialties remains wide open. Heavy reinvestment now preserves optionality—funding should continue to support scale, clinical validation, and regulatory pathways to capture long-term margin expansion.
Energy transition champions
Platforms tied to grid, storage, efficiency show visible pipelines—global grid-scale battery pipeline exceeded 500 GW in 2024, with utility-scale storage deployments up ~60% year-on-year. Policy tailwinds like the US IRA and EU Green Deal plus industrial scale give lead-dog status; large developers report 2–3 years of order backlog. Capital intensive but cash in equals cash out now; maintain share to harvest later.
Buyout co‑invests in dominant niches
Backed by top‑tier sponsors, these Stars set pricing in their micro‑markets; operational levers have driven mid‑teens organic revenue growth in 2024 and ~350 bps EBITDA margin expansion, letting Brederode ride along without fund fee drag while continuing add‑ons to defend leadership.
- Top sponsors
- Mid‑teens organic growth (2024)
- ~350 bps EBITDA uplift
- No fund fees drag
- Ongoing add‑ons
Fintech infrastructure with network effects
Fintech infrastructure with rails, risk and compliance layers embedded in client workflows drives strong network effects: each new integration deepens the moat and increases throughput, turning one-off revenues into platform stickiness. Marketing burns cash early, but at scale unit economics typically improve and CAC payback compresses. Stay the course to convert growth into steady yield.
- Rails + compliance = higher retention
- Each integration boosts TPV and stickiness
- Marketing heavy early; CAC falls with scale
- Focus on long-term yield conversion
Minority stakes in SaaS, digital health, grid storage — cash burn to cash cows
Minority stakes in SaaS leaders growing 30–80% ARR in 2024 with NRR 120–140% and heavy S&M/R&D reinvestment; cash burn now to become Cash Cows.
Digital health/diagnostics target a >$300B market (2024) with double‑digit growth and regulatory moats; roll‑ups remain open.
Grid/storage pipeline >500 GW (2024) with 2–3 year backlogs and policy tailwinds; capital intensity justified for scale.
| Metric | 2024 |
|---|---|
| SaaS ARR growth | 30–80% |
| NRR | 120–140% |
| Digital health TAM | >$300B |
| Grid pipeline | >500 GW |
What is included in the product
Detailed Word Document
In-depth review of Brederode's products across BCG quadrants, with strategic moves to invest, hold, or divest per unit.
Customizable Excel Spreadsheet
One-page overview placing each business unit in a quadrant—cuts confusion, speeds exec decisions.
Cash Cows
Dividend‑rich listed blue chips
Mature, dividend‑rich listed blue chips deliver predictable cash with low drama, often yielding around 2% while returning capital via dividends and buybacks (US buybacks exceeded $1T in 2023). Limited reinvestment needs make them ideal funding sources for newer bets and to cover fees. Strategy: maintain exposures rather than over‑optimize—steady cash funds growth initiatives and preserves portfolio stability.
Infrastructure yield platforms
Infrastructure yield platforms deliver high visibility with ~95% contracted cash flows over a 5-year horizon, CPI-linked escalators averaging 2.9% in 2024 and ~80% investment-grade counterparties; capex is planned (~5% of AUM) not surprise; distributions (~6.2% cash yield in 2024) cover overhead and seed €50m dry powder, while modest ops tweaks aim to lift efficiency marginally.
Scaled B2B recurring‑revenue plays
Scaled B2B recurring‑revenue plays show cooled growth to mid‑teens in 2024, churn typically around 4–6% and gross margins near 70–80%, with FCF margins about 15–25%. Market share is entrenched (>30–40% for leaders) as high switching costs sustain cash conversion; milk gently while refreshing product roadmaps.
Seasoned buyout funds in harvest mode
Seasoned buyout funds in harvest mode: legacy vintages are steadily selling assets and returning capital, with Brederode reporting portfolio realizations up 18% year‑over‑year in 2024, enabling orderly exits without heroics and faster capital recycling than new deployment.
- Harvest tempo: realizations +18% YoY (2024)
- Return profile: distributions outpacing new investments
- Recycling: capital redeployed into higher‑growth, higher‑risk strategies
Oligopoly industrials
Oligopoly industrials
Few large players drive rational pricing and predictable demand; 2024 sector free cash flow yields remained elevated, often above 5% as capex discipline plus recurring service revenue bolster margins. Free cash flow is the story—hold core positions, trim only on punchy valuations.- Few players, stable pricing
- Predictable demand, service revenue
- Capex discipline → FCF focus (2024: FCF yields >5%)
- Hold core; trim on rich valuations
Blue chips ~2%, infra ~6.2%, B2B 15–25%
Mature blue chips yield ~2% with steady buybacks (US >1T in 2023), funding growth; infrastructure shows ~95% contracted 5y cash, CPI +2.9% (2024) and ~6.2% cash yield; B2B leaders: churn 4–6%, FCF margins 15–25%; oligopoly industrials: FCF yields >5% (2024), hold core positions.
| Segment | 2024 Metric | Yield/Note |
|---|---|---|
| Blue chips | Buybacks >$1T (2023) | ~2% div |
| Infrastructure | 95% contracted, CPI+2.9% | ~6.2% |
| B2B | Churn 4–6% | FCF 15–25% |
| Industrials | Capex discipline | FCF >5% |
Full Transparency, Always
Brederode BCG Matrix
The file you're previewing is the exact Brederode BCG Matrix report you'll receive after purchase. No watermarks, no demo content—just the fully formatted, analysis-ready document designed for clarity. After payment you'll get the final file instantly, editable and printable for presentations or planning. Built by strategy pros, ready to plug into your workflow.











