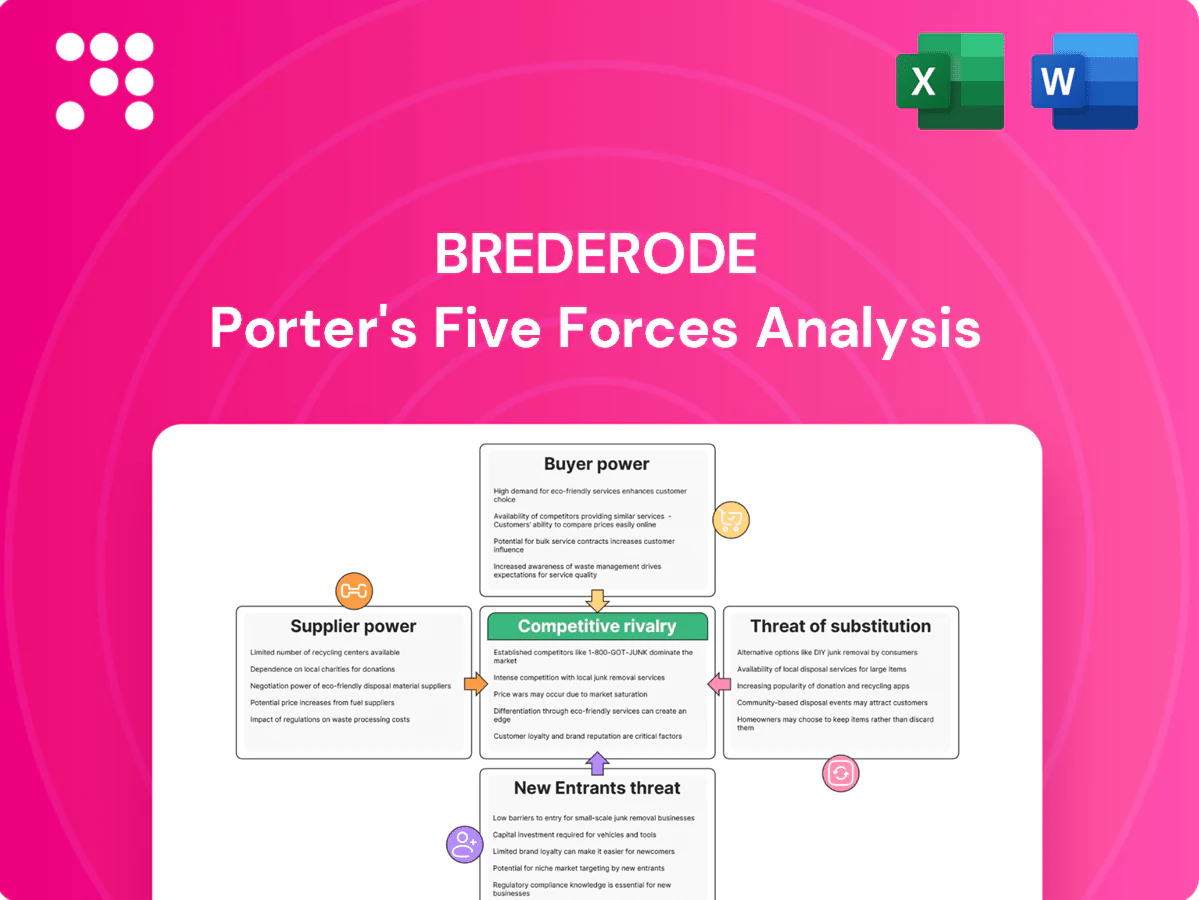
Brederode Porter's Five Forces Analysis

A Must-Have Tool for Decision-Makers
Brederode’s Porter's Five Forces snapshot highlights supplier leverage, buyer power, new entrant threats, substitute risks and competitive rivalry shaping its margins and strategic choices. This brief overview surfaces key pressures but omits force-by-force ratings and tailored implications. Unlock the full Porter’s Five Forces Analysis to get detailed ratings, visuals and actionable strategy insights for Brederode.
Suppliers Bargaining Power

Scarce high-quality deal flow
Brederode relies on attractive minority stakes sourced via bankers, GPs, founders and networks; when top-tier targets are scarce, intermediaries and founders gain leverage on deal terms. Limited supply pushes entry valuations higher and often reduces protective covenants, while global private capital dry powder remained above $2 trillion in 2024, amplifying competition. Strong relationships and rapid speed-to-term-sheet help offset this supplier power.
Dependence on co-invest and GP pipelines
If Brederode relies on GP co-invest pipelines, GPs effectively control deal allocation and in hot 2024 processes—with Preqin reporting about $2.3 trillion in PE dry powder—they can prioritize larger tickets or strategic LPs, limiting Brederode’s access. Such concentration compresses fees and deal economics for smaller co-investors. Diversifying GP relationships and targeting niche sectors reduces this dependency and bargaining weakness.

Advisors and data providers
Investment banks, legal firms and data vendors exert leverage through pricing and selective access; advisory fees typically range from 0.5% for mega-deals to 2% for mid‑market transactions. Specialized cross‑border due diligence and legal work are hard to substitute, keeping fee stickiness that can shave 100–300 basis points from net returns. The financial data market is estimated at roughly 40–50 billion USD in 2024, but multi‑provider competition and growing in‑house analytics weaken supplier power.

Capital market intermediaries
Capital market intermediaries—prime brokers, custodians and financing counterparties—directly affect trading costs and terms; during stress they can tighten margin and borrowing requirements and raise costs, increasing supplier power. Counterparty diversification and conservative leverage reduce exposure, while stable long-term relationships tend to preserve favorable pricing and access.
- Prime brokers: fee and margin leverage
- Custodians: custody and settlement terms
- Financing counterparties: borrowing costs, counterparty risk
- Mitigants: diversification, low leverage, long relationships
Management teams of targets
Founders and incumbent management frequently negotiate governance when selling minority stakes; in 2024 roughly 58% of private deals preserved one or more founder board seats, limiting acquirers' control and diluting influence over value creation. When secondary options and alternative capital are abundant, teams resist binding reporting and veto rights. Offering strategic support and patient capital increases alignment and deal completion rates.
Supplier power: $2.3T dry powder; founders hold 58% seats
Supplier power is elevated: global PE dry powder was about $2.3T in 2024, tightening target supply and raising entry valuations. Advisory fees run 0.5–2% and data market size ~45B USD, creating sticky costs. Founders retained board seats in ~58% of private deals, limiting governance leverage. Countermeasures: deep GP networks, diversification and speed-to-term-sheet.
| Supplier | 2024 metric | Impact |
|---|---|---|
| Private capital | $2.3T dry powder | Higher valuations, weaker terms |
| Advisors/data | Fees 0.5–2%; market ~$45B | Sticky cost drag |
| Founders | 58% keep board seats | Limited control |
What is included in the product
 Detailed Word Document
Tailored Porter's Five Forces analysis for Brederode uncovering key competitive drivers, supplier and buyer power, barriers to entry, threat of substitutes, and rivalry intensity, with strategic commentary on disruptive forces and recommendations to strengthen market position.

 Customizable Excel Spreadsheet
Brederode's Porter's Five Forces one-sheet distills competitive pressures into a single, actionable view—ideal for fast strategic decisions and pitch decks. Customize force levels, swap in your data, and export charts for boardroom-ready visuals without macros or complex setup.
Customers Bargaining Power

Public shareholders’ return demands
As a listed investment company, Brederode’s customers are its public shareholders, who in 2024 continued to press for returns via discount-to-NAV pressure and voting at AGMs. Persistent underperformance in 2024 has led to shareholder activism across the investment trust sector, raising the risk of board challenges. Transparent reporting and consistent NAV compounding materially reduce shareholder leverage. Clear buyback/dividend policies and regular NAV disclosure curb discount volatility.
Exit counterparties and markets
Buyers at exit—strategics, sponsors, and public markets—ultimately set realizable value, and in 2024 strategic acquirers regained selective pricing power while public IPO windows remained narrow. Pricing power rises in risk-off cycles, compressing multiples and driving delayed exits; median private equity holding periods have extended to roughly six years by 2024. Flexible exit routes and early-built strategic buyer lists mitigate forced-sale discounting.

Institutional investor concentration
2024 filings show institutional investors hold a concentrated block of Brederode shares, enabling them to influence capital allocation and governance decisions through voting and proposals. Block trades by these holders have historically pressured liquidity and short-term valuation around reporting dates. A diversified register and regular investor engagement have limited takeover risk, while predictable dividends and targeted buybacks help align large holders with long-term strategy.

Private secondary market dynamics
For unlisted holdings secondary buyers often demand illiquidity discounts; in 2023-24 average secondary discounts widened to roughly 20-35%, increasing buyer power in tighter liquidity. Staged exits and milestone-based pricing can reduce discounts; robust governance rights (veto, information) boost salability and pricing.
- Discounts: 20-35% (2023-24)
- Liquidity tightness widens spreads
- Staged exits and governance reduce discounts
Fee and cost sensitivity
Investors benchmark Brederode’s ~1.8% management fee against index ETFs near 0.05% and listed PE peers around 1.5–2.0% (2024). High expense ratios invite pressure to streamline and require clear disclosure of alpha to justify premiums. Operating leverage and scale can reduce cost per AUM materially as assets grow. Transparent performance attribution supports premium pricing.
- fee-gap: Brederode ~1.8% vs ETFs ~0.05% (2024)
- peer-range: listed PE 1.5–2.0%
- leverage: scale reduces unit costs; disclosure justifies premium
Shareholders press NAV recovery: secondary discounts 20–35% and fees under scrutiny
Shareholders exert high bargaining power in 2024 via discount-to-NAV pressure and activism after sector underperformance. Institutional blocks concentrate voting influence; liquidity events and block trades amplify short-term valuation swings. Secondary buyers demand 20–35% illiquidity discounts (2023–24). Fee gap (Brederode 1.8% vs ETFs 0.05%) increases investor scrutiny.
| Metric | 2023–24 |
|---|---|
| Secondary discounts | 20–35% |
| Management fee | Brederode 1.8% / ETFs 0.05% |
| PE holding period | ~6 years |
Same Document Delivered
Brederode Porter's Five Forces Analysis
This Brederode Porter’s Five Forces Analysis preview is the exact, fully formatted document you’ll receive immediately after purchase—no samples, no placeholders. It contains the complete competitive assessment ready for download and use. What you see is the final deliverable, instantly accessible upon payment.

A Must-Have Tool for Decision-Makers
Brederode’s Porter's Five Forces snapshot highlights supplier leverage, buyer power, new entrant threats, substitute risks and competitive rivalry shaping its margins and strategic choices. This brief overview surfaces key pressures but omits force-by-force ratings and tailored implications. Unlock the full Porter’s Five Forces Analysis to get detailed ratings, visuals and actionable strategy insights for Brederode.
Suppliers Bargaining Power
Scarce high-quality deal flow
Brederode relies on attractive minority stakes sourced via bankers, GPs, founders and networks; when top-tier targets are scarce, intermediaries and founders gain leverage on deal terms. Limited supply pushes entry valuations higher and often reduces protective covenants, while global private capital dry powder remained above $2 trillion in 2024, amplifying competition. Strong relationships and rapid speed-to-term-sheet help offset this supplier power.
Dependence on co-invest and GP pipelines
If Brederode relies on GP co-invest pipelines, GPs effectively control deal allocation and in hot 2024 processes—with Preqin reporting about $2.3 trillion in PE dry powder—they can prioritize larger tickets or strategic LPs, limiting Brederode’s access. Such concentration compresses fees and deal economics for smaller co-investors. Diversifying GP relationships and targeting niche sectors reduces this dependency and bargaining weakness.
Advisors and data providers
Investment banks, legal firms and data vendors exert leverage through pricing and selective access; advisory fees typically range from 0.5% for mega-deals to 2% for mid‑market transactions. Specialized cross‑border due diligence and legal work are hard to substitute, keeping fee stickiness that can shave 100–300 basis points from net returns. The financial data market is estimated at roughly 40–50 billion USD in 2024, but multi‑provider competition and growing in‑house analytics weaken supplier power.
Capital market intermediaries
Capital market intermediaries—prime brokers, custodians and financing counterparties—directly affect trading costs and terms; during stress they can tighten margin and borrowing requirements and raise costs, increasing supplier power. Counterparty diversification and conservative leverage reduce exposure, while stable long-term relationships tend to preserve favorable pricing and access.
- Prime brokers: fee and margin leverage
- Custodians: custody and settlement terms
- Financing counterparties: borrowing costs, counterparty risk
- Mitigants: diversification, low leverage, long relationships
Management teams of targets
Founders and incumbent management frequently negotiate governance when selling minority stakes; in 2024 roughly 58% of private deals preserved one or more founder board seats, limiting acquirers' control and diluting influence over value creation. When secondary options and alternative capital are abundant, teams resist binding reporting and veto rights. Offering strategic support and patient capital increases alignment and deal completion rates.
Supplier power: $2.3T dry powder; founders hold 58% seats
Supplier power is elevated: global PE dry powder was about $2.3T in 2024, tightening target supply and raising entry valuations. Advisory fees run 0.5–2% and data market size ~45B USD, creating sticky costs. Founders retained board seats in ~58% of private deals, limiting governance leverage. Countermeasures: deep GP networks, diversification and speed-to-term-sheet.
| Supplier | 2024 metric | Impact |
|---|---|---|
| Private capital | $2.3T dry powder | Higher valuations, weaker terms |
| Advisors/data | Fees 0.5–2%; market ~$45B | Sticky cost drag |
| Founders | 58% keep board seats | Limited control |
What is included in the product
Detailed Word Document
Tailored Porter's Five Forces analysis for Brederode uncovering key competitive drivers, supplier and buyer power, barriers to entry, threat of substitutes, and rivalry intensity, with strategic commentary on disruptive forces and recommendations to strengthen market position.
Customizable Excel Spreadsheet
Brederode's Porter's Five Forces one-sheet distills competitive pressures into a single, actionable view—ideal for fast strategic decisions and pitch decks. Customize force levels, swap in your data, and export charts for boardroom-ready visuals without macros or complex setup.
Customers Bargaining Power
Public shareholders’ return demands
As a listed investment company, Brederode’s customers are its public shareholders, who in 2024 continued to press for returns via discount-to-NAV pressure and voting at AGMs. Persistent underperformance in 2024 has led to shareholder activism across the investment trust sector, raising the risk of board challenges. Transparent reporting and consistent NAV compounding materially reduce shareholder leverage. Clear buyback/dividend policies and regular NAV disclosure curb discount volatility.
Exit counterparties and markets
Buyers at exit—strategics, sponsors, and public markets—ultimately set realizable value, and in 2024 strategic acquirers regained selective pricing power while public IPO windows remained narrow. Pricing power rises in risk-off cycles, compressing multiples and driving delayed exits; median private equity holding periods have extended to roughly six years by 2024. Flexible exit routes and early-built strategic buyer lists mitigate forced-sale discounting.
Institutional investor concentration
2024 filings show institutional investors hold a concentrated block of Brederode shares, enabling them to influence capital allocation and governance decisions through voting and proposals. Block trades by these holders have historically pressured liquidity and short-term valuation around reporting dates. A diversified register and regular investor engagement have limited takeover risk, while predictable dividends and targeted buybacks help align large holders with long-term strategy.
Private secondary market dynamics
For unlisted holdings secondary buyers often demand illiquidity discounts; in 2023-24 average secondary discounts widened to roughly 20-35%, increasing buyer power in tighter liquidity. Staged exits and milestone-based pricing can reduce discounts; robust governance rights (veto, information) boost salability and pricing.
- Discounts: 20-35% (2023-24)
- Liquidity tightness widens spreads
- Staged exits and governance reduce discounts
Fee and cost sensitivity
Investors benchmark Brederode’s ~1.8% management fee against index ETFs near 0.05% and listed PE peers around 1.5–2.0% (2024). High expense ratios invite pressure to streamline and require clear disclosure of alpha to justify premiums. Operating leverage and scale can reduce cost per AUM materially as assets grow. Transparent performance attribution supports premium pricing.
- fee-gap: Brederode ~1.8% vs ETFs ~0.05% (2024)
- peer-range: listed PE 1.5–2.0%
- leverage: scale reduces unit costs; disclosure justifies premium
Shareholders press NAV recovery: secondary discounts 20–35% and fees under scrutiny
Shareholders exert high bargaining power in 2024 via discount-to-NAV pressure and activism after sector underperformance. Institutional blocks concentrate voting influence; liquidity events and block trades amplify short-term valuation swings. Secondary buyers demand 20–35% illiquidity discounts (2023–24). Fee gap (Brederode 1.8% vs ETFs 0.05%) increases investor scrutiny.
| Metric | 2023–24 |
|---|---|
| Secondary discounts | 20–35% |
| Management fee | Brederode 1.8% / ETFs 0.05% |
| PE holding period | ~6 years |
Same Document Delivered
Brederode Porter's Five Forces Analysis
This Brederode Porter’s Five Forces Analysis preview is the exact, fully formatted document you’ll receive immediately after purchase—no samples, no placeholders. It contains the complete competitive assessment ready for download and use. What you see is the final deliverable, instantly accessible upon payment.
Description
A Must-Have Tool for Decision-Makers
Brederode’s Porter's Five Forces snapshot highlights supplier leverage, buyer power, new entrant threats, substitute risks and competitive rivalry shaping its margins and strategic choices. This brief overview surfaces key pressures but omits force-by-force ratings and tailored implications. Unlock the full Porter’s Five Forces Analysis to get detailed ratings, visuals and actionable strategy insights for Brederode.
Suppliers Bargaining Power
Scarce high-quality deal flow
Brederode relies on attractive minority stakes sourced via bankers, GPs, founders and networks; when top-tier targets are scarce, intermediaries and founders gain leverage on deal terms. Limited supply pushes entry valuations higher and often reduces protective covenants, while global private capital dry powder remained above $2 trillion in 2024, amplifying competition. Strong relationships and rapid speed-to-term-sheet help offset this supplier power.
Dependence on co-invest and GP pipelines
If Brederode relies on GP co-invest pipelines, GPs effectively control deal allocation and in hot 2024 processes—with Preqin reporting about $2.3 trillion in PE dry powder—they can prioritize larger tickets or strategic LPs, limiting Brederode’s access. Such concentration compresses fees and deal economics for smaller co-investors. Diversifying GP relationships and targeting niche sectors reduces this dependency and bargaining weakness.
Advisors and data providers
Investment banks, legal firms and data vendors exert leverage through pricing and selective access; advisory fees typically range from 0.5% for mega-deals to 2% for mid‑market transactions. Specialized cross‑border due diligence and legal work are hard to substitute, keeping fee stickiness that can shave 100–300 basis points from net returns. The financial data market is estimated at roughly 40–50 billion USD in 2024, but multi‑provider competition and growing in‑house analytics weaken supplier power.
Capital market intermediaries
Capital market intermediaries—prime brokers, custodians and financing counterparties—directly affect trading costs and terms; during stress they can tighten margin and borrowing requirements and raise costs, increasing supplier power. Counterparty diversification and conservative leverage reduce exposure, while stable long-term relationships tend to preserve favorable pricing and access.
- Prime brokers: fee and margin leverage
- Custodians: custody and settlement terms
- Financing counterparties: borrowing costs, counterparty risk
- Mitigants: diversification, low leverage, long relationships
Management teams of targets
Founders and incumbent management frequently negotiate governance when selling minority stakes; in 2024 roughly 58% of private deals preserved one or more founder board seats, limiting acquirers' control and diluting influence over value creation. When secondary options and alternative capital are abundant, teams resist binding reporting and veto rights. Offering strategic support and patient capital increases alignment and deal completion rates.
Supplier power: $2.3T dry powder; founders hold 58% seats
Supplier power is elevated: global PE dry powder was about $2.3T in 2024, tightening target supply and raising entry valuations. Advisory fees run 0.5–2% and data market size ~45B USD, creating sticky costs. Founders retained board seats in ~58% of private deals, limiting governance leverage. Countermeasures: deep GP networks, diversification and speed-to-term-sheet.
| Supplier | 2024 metric | Impact |
|---|---|---|
| Private capital | $2.3T dry powder | Higher valuations, weaker terms |
| Advisors/data | Fees 0.5–2%; market ~$45B | Sticky cost drag |
| Founders | 58% keep board seats | Limited control |
What is included in the product
Detailed Word Document
Tailored Porter's Five Forces analysis for Brederode uncovering key competitive drivers, supplier and buyer power, barriers to entry, threat of substitutes, and rivalry intensity, with strategic commentary on disruptive forces and recommendations to strengthen market position.
Customizable Excel Spreadsheet
Brederode's Porter's Five Forces one-sheet distills competitive pressures into a single, actionable view—ideal for fast strategic decisions and pitch decks. Customize force levels, swap in your data, and export charts for boardroom-ready visuals without macros or complex setup.
Customers Bargaining Power
Public shareholders’ return demands
As a listed investment company, Brederode’s customers are its public shareholders, who in 2024 continued to press for returns via discount-to-NAV pressure and voting at AGMs. Persistent underperformance in 2024 has led to shareholder activism across the investment trust sector, raising the risk of board challenges. Transparent reporting and consistent NAV compounding materially reduce shareholder leverage. Clear buyback/dividend policies and regular NAV disclosure curb discount volatility.
Exit counterparties and markets
Buyers at exit—strategics, sponsors, and public markets—ultimately set realizable value, and in 2024 strategic acquirers regained selective pricing power while public IPO windows remained narrow. Pricing power rises in risk-off cycles, compressing multiples and driving delayed exits; median private equity holding periods have extended to roughly six years by 2024. Flexible exit routes and early-built strategic buyer lists mitigate forced-sale discounting.
Institutional investor concentration
2024 filings show institutional investors hold a concentrated block of Brederode shares, enabling them to influence capital allocation and governance decisions through voting and proposals. Block trades by these holders have historically pressured liquidity and short-term valuation around reporting dates. A diversified register and regular investor engagement have limited takeover risk, while predictable dividends and targeted buybacks help align large holders with long-term strategy.
Private secondary market dynamics
For unlisted holdings secondary buyers often demand illiquidity discounts; in 2023-24 average secondary discounts widened to roughly 20-35%, increasing buyer power in tighter liquidity. Staged exits and milestone-based pricing can reduce discounts; robust governance rights (veto, information) boost salability and pricing.
- Discounts: 20-35% (2023-24)
- Liquidity tightness widens spreads
- Staged exits and governance reduce discounts
Fee and cost sensitivity
Investors benchmark Brederode’s ~1.8% management fee against index ETFs near 0.05% and listed PE peers around 1.5–2.0% (2024). High expense ratios invite pressure to streamline and require clear disclosure of alpha to justify premiums. Operating leverage and scale can reduce cost per AUM materially as assets grow. Transparent performance attribution supports premium pricing.
- fee-gap: Brederode ~1.8% vs ETFs ~0.05% (2024)
- peer-range: listed PE 1.5–2.0%
- leverage: scale reduces unit costs; disclosure justifies premium
Shareholders press NAV recovery: secondary discounts 20–35% and fees under scrutiny
Shareholders exert high bargaining power in 2024 via discount-to-NAV pressure and activism after sector underperformance. Institutional blocks concentrate voting influence; liquidity events and block trades amplify short-term valuation swings. Secondary buyers demand 20–35% illiquidity discounts (2023–24). Fee gap (Brederode 1.8% vs ETFs 0.05%) increases investor scrutiny.
| Metric | 2023–24 |
|---|---|
| Secondary discounts | 20–35% |
| Management fee | Brederode 1.8% / ETFs 0.05% |
| PE holding period | ~6 years |
Same Document Delivered
Brederode Porter's Five Forces Analysis
This Brederode Porter’s Five Forces Analysis preview is the exact, fully formatted document you’ll receive immediately after purchase—no samples, no placeholders. It contains the complete competitive assessment ready for download and use. What you see is the final deliverable, instantly accessible upon payment.











