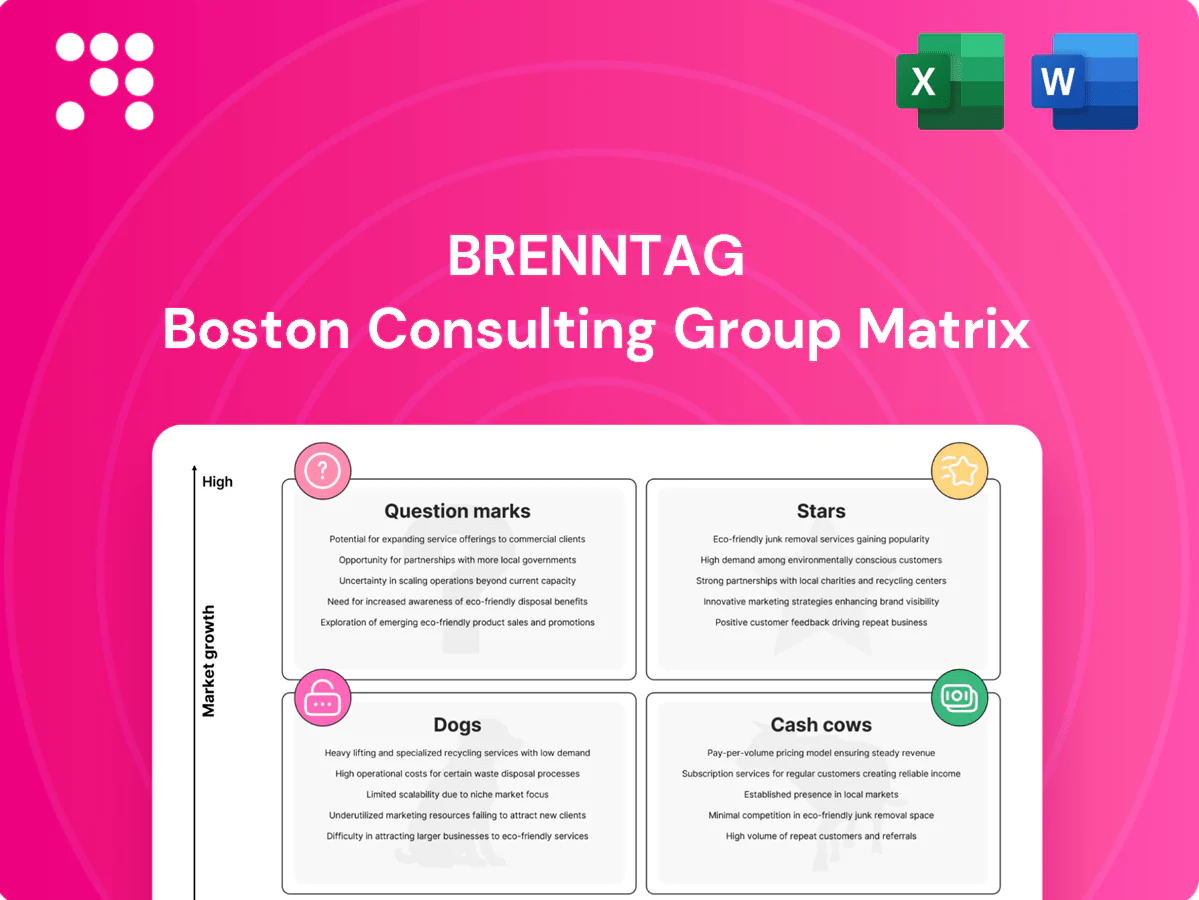
Brenntag Boston Consulting Group Matrix

Unlock Strategic Clarity
See where Brenntag’s products land—Stars, Cash Cows, Dogs, or Question Marks—and stop guessing what to fund or fold. This preview teases the shape of the business; the full BCG Matrix gives you quadrant-level placements, data-backed recommendations, and a clear investment roadmap. Buy the complete report for a ready-to-use Word analysis plus an Excel summary you can drop into presentations and planning decks. Get instant access and start making smarter, faster strategic decisions today.
Stars

Life Sciences (pharma & personal care)
Life Sciences (pharma & personal care) sits in a high-growth segment with estimated 6–8% CAGR to 2024, and Brenntag already holds a leading distribution share supported by deep formulation know‑how. Technical support and regulatory capability create high switching costs for customers, so continue investing in formulation support and clean‑room services. Maintain strict quality controls; as volumes and margins stabilize this will mature into a reliable cash cow.
Food & Nutrition ingredients
Food & Nutrition ingredients are a fast-growing, innovation-driven Star for Brenntag, with the company sitting close to the customer brief through application labs and co-creation that drive repeat business. As of 2024 Brenntag operates in over 70 countries, enabling scale to compound advantages in sensory, clean-label and fortification trends. Investment in these areas accelerates margin and share gains when scaled globally.

Specialty chemicals distribution
Specialty chemicals distribution—adhesives, coatings, personal-care actives and high-spec additives—is where complexity pays and margins expand. Brenntag, the global market leader present in around 78 countries with FY 2023 group sales of roughly €20.2bn, leverages breadth and certifications for above‑market share. Doubling down on technical service and supplier exclusives will lock in advantaged positions. It soaks cash today but drives category leadership and cash generation later.

Value‑added services (custom blending & packaging)
Value-added services like custom blending and packaging are Stars: high-growth offerings that resolve customer pain points around compliance, small-batch runs and speed-to-market, locking customers in and improving basket margins; scale-driven capacity, automation and QA investments further increase stickiness as the core distribution business benefits from higher retention.
- High growth: solves compliance, small runs, speed
- Margin uplift: higher-margin services across portfolio
- Retention: creates sticky customer relationships
- Scale levers: add capacity, automation, QA to stay ahead
Water treatment solutions
Water treatment solutions
Regulatory tightening and steady municipal/industrial demand underpin a global water treatment chemicals market ~36 billion in 2024 with ~5% CAGR; Brenntag’s broad European and North American footprint and 2024 service reliability drive measurable share gains in municipal tenders. Bundling specialty chemistry with on‑site support raises switching costs; continued investment is warranted as this star remains high-growth.- Market size 2024: ~36bn, CAGR ~5%
- Brenntag strength: footprint + service = share gains
- Barrier: chemistry + on‑site support
- Strategy: keep investing to capture long-term growth
High-growth sectors — Life Sciences, Food & Nutrition, Specialty Chemicals, Water Treatment
Stars: Life Sciences (6–8% CAGR to 2024), Food & Nutrition (70+ countries), Specialty Chemicals (FY2023 sales ~€20.2bn; 78-country footprint) and Water Treatment (~$36bn market in 2024, ~5% CAGR) drive high growth, margin expansion and sticky customers; prioritize technical/service investment to convert into future cash cows.
| Segment | 2024 stat | CAGR | Brenntag edge |
|---|---|---|---|
| Life Sciences | 6–8% market growth | 6–8% | Formulation & regs |
| Food & Nutrition | 70+ countries | — | Application labs |
| Specialty | €20.2bn group sales (FY2023) | — | Certifications, scope |
| Water Treatment | ~$36bn market | ~5% | Footprint + on‑site |
What is included in the product
 Detailed Word Document
Comprehensive BCG analysis of Brenntag's units, mapping Stars, Cash Cows, Question Marks and Dogs with investment recommendations.

 Customizable Excel Spreadsheet
One-page Brenntag BCG Matrix places business units in quadrants for quick strategic clarity and action.
Cash Cows

Commodity industrial chemicals (mature regions)
Commodity industrial chemicals in mature regions show stable, low-growth demand (roughly 1% annual volume growth) and represent a large share of Brenntag’s portfolio, supporting scale—Brenntag reported ~€19.0bn group sales in 2023. Price sensitivity drives thin margins, so efficient routing, bulk buying and tight logistics convert volume into cash. Avoid price wars; optimize service and inventory turns to milk cash flows without overexpanding capacity.
Established supplier partnerships
Established supplier partnerships—anchored in Brenntag’s global network across over 78 countries—deliver long relationships, predictable allocations and repeat SKUs that drive high throughput. These channels require low capex to maintain yet generate steady cash flow used to fund new bets and absorb corporate overhead. Protecting service levels and contractual terms preserves margin stability. Focus on SLAs and contract renewals to lock in predictable volumes.

Warehousing & last‑mile distribution network
Warehousing & last‑mile distribution network: Brenntag operates more than 600 warehouses worldwide and holds industry certifications such as ISO 9001, ISO 14001 and ISO 45001, providing scale and safety few competitors match. Utilization is the primary margin lever for these assets, with occupancy rates managed centrally to optimize cash flow. Incremental tech, automation and slotting improvements feed directly to EBITDA and working capital, so keep it full, keep it safe.

Recurring OEM/industrial accounts
Recurring OEM and industrial accounts are cash cows for Brenntag: locked‑in specs and long qualification cycles sharply reduce churn, and in 2024 these customers delivered steady, high-volume distribution that underpins margin stability. Aggressive cross‑sell keeps basket value high while minimal promotions are needed because reliability is the product; maintain SLAs and protect price to sustain cash generation.
- locked_in_specs
- low_churn
- cross_sell_+basket
- minimal_promo
- SLA_price_protection
Standard packaging & dilution services
Standard packaging & dilution services at Brenntag are a mature, consistent-volume cash cow delivering stable low-single-digit percent contributions to group revenue in 2024 while protecting margins on base chemicals. They require limited selling effort, with continuous improvement programs in 2024 lifting throughput and yield and keeping operating costs flat. This quiet engine generated steady free cash flow and supported working capital efficiency throughout 2024.
- Stable volumes, 2024: low-single-digit revenue share
- Margin accretive vs. raw chemicals
- Continuous improvement → higher throughput/yield
- Reliable free cash flow, low sales intensity
Scale + high utilization turn €19.0bn sales into steady cash flow
Commodity chemicals and packaging in mature markets generate stable, low‑growth volumes and high throughput, converting scale into predictable cash flow; Brenntag reported €19.0bn group sales in 2023. High utilization across 600+ warehouses in 78 countries keeps margins stable; focus on SLAs, inventory turns and selective cross‑sell to sustain FCF.
| Metric | Value |
|---|---|
| Group sales 2023 | €19.0bn |
| Warehouses | 600+ |
| Countries | 78 |
| Cash‑cow rev 2024 | low‑single‑digit % |
Full Transparency, Always
Brenntag BCG Matrix
The Brenntag BCG Matrix you're previewing on this page is the exact file you'll receive after purchase. No watermarks, no demo content—just a fully formatted, analysis-ready report built for clarity. Once you buy, the final document is yours to download, edit, print, or present—no surprises, no extra steps. Designed by strategy pros, it slots straight into your planning or investor decks.

Unlock Strategic Clarity
See where Brenntag’s products land—Stars, Cash Cows, Dogs, or Question Marks—and stop guessing what to fund or fold. This preview teases the shape of the business; the full BCG Matrix gives you quadrant-level placements, data-backed recommendations, and a clear investment roadmap. Buy the complete report for a ready-to-use Word analysis plus an Excel summary you can drop into presentations and planning decks. Get instant access and start making smarter, faster strategic decisions today.
Stars
Life Sciences (pharma & personal care)
Life Sciences (pharma & personal care) sits in a high-growth segment with estimated 6–8% CAGR to 2024, and Brenntag already holds a leading distribution share supported by deep formulation know‑how. Technical support and regulatory capability create high switching costs for customers, so continue investing in formulation support and clean‑room services. Maintain strict quality controls; as volumes and margins stabilize this will mature into a reliable cash cow.
Food & Nutrition ingredients
Food & Nutrition ingredients are a fast-growing, innovation-driven Star for Brenntag, with the company sitting close to the customer brief through application labs and co-creation that drive repeat business. As of 2024 Brenntag operates in over 70 countries, enabling scale to compound advantages in sensory, clean-label and fortification trends. Investment in these areas accelerates margin and share gains when scaled globally.
Specialty chemicals distribution
Specialty chemicals distribution—adhesives, coatings, personal-care actives and high-spec additives—is where complexity pays and margins expand. Brenntag, the global market leader present in around 78 countries with FY 2023 group sales of roughly €20.2bn, leverages breadth and certifications for above‑market share. Doubling down on technical service and supplier exclusives will lock in advantaged positions. It soaks cash today but drives category leadership and cash generation later.
Value‑added services (custom blending & packaging)
Value-added services like custom blending and packaging are Stars: high-growth offerings that resolve customer pain points around compliance, small-batch runs and speed-to-market, locking customers in and improving basket margins; scale-driven capacity, automation and QA investments further increase stickiness as the core distribution business benefits from higher retention.
- High growth: solves compliance, small runs, speed
- Margin uplift: higher-margin services across portfolio
- Retention: creates sticky customer relationships
- Scale levers: add capacity, automation, QA to stay ahead
Water treatment solutions
Water treatment solutions
Regulatory tightening and steady municipal/industrial demand underpin a global water treatment chemicals market ~36 billion in 2024 with ~5% CAGR; Brenntag’s broad European and North American footprint and 2024 service reliability drive measurable share gains in municipal tenders. Bundling specialty chemistry with on‑site support raises switching costs; continued investment is warranted as this star remains high-growth.- Market size 2024: ~36bn, CAGR ~5%
- Brenntag strength: footprint + service = share gains
- Barrier: chemistry + on‑site support
- Strategy: keep investing to capture long-term growth
High-growth sectors — Life Sciences, Food & Nutrition, Specialty Chemicals, Water Treatment
Stars: Life Sciences (6–8% CAGR to 2024), Food & Nutrition (70+ countries), Specialty Chemicals (FY2023 sales ~€20.2bn; 78-country footprint) and Water Treatment (~$36bn market in 2024, ~5% CAGR) drive high growth, margin expansion and sticky customers; prioritize technical/service investment to convert into future cash cows.
| Segment | 2024 stat | CAGR | Brenntag edge |
|---|---|---|---|
| Life Sciences | 6–8% market growth | 6–8% | Formulation & regs |
| Food & Nutrition | 70+ countries | — | Application labs |
| Specialty | €20.2bn group sales (FY2023) | — | Certifications, scope |
| Water Treatment | ~$36bn market | ~5% | Footprint + on‑site |
What is included in the product
Detailed Word Document
Comprehensive BCG analysis of Brenntag's units, mapping Stars, Cash Cows, Question Marks and Dogs with investment recommendations.
Customizable Excel Spreadsheet
One-page Brenntag BCG Matrix places business units in quadrants for quick strategic clarity and action.
Cash Cows
Commodity industrial chemicals (mature regions)
Commodity industrial chemicals in mature regions show stable, low-growth demand (roughly 1% annual volume growth) and represent a large share of Brenntag’s portfolio, supporting scale—Brenntag reported ~€19.0bn group sales in 2023. Price sensitivity drives thin margins, so efficient routing, bulk buying and tight logistics convert volume into cash. Avoid price wars; optimize service and inventory turns to milk cash flows without overexpanding capacity.
Established supplier partnerships
Established supplier partnerships—anchored in Brenntag’s global network across over 78 countries—deliver long relationships, predictable allocations and repeat SKUs that drive high throughput. These channels require low capex to maintain yet generate steady cash flow used to fund new bets and absorb corporate overhead. Protecting service levels and contractual terms preserves margin stability. Focus on SLAs and contract renewals to lock in predictable volumes.
Warehousing & last‑mile distribution network
Warehousing & last‑mile distribution network: Brenntag operates more than 600 warehouses worldwide and holds industry certifications such as ISO 9001, ISO 14001 and ISO 45001, providing scale and safety few competitors match. Utilization is the primary margin lever for these assets, with occupancy rates managed centrally to optimize cash flow. Incremental tech, automation and slotting improvements feed directly to EBITDA and working capital, so keep it full, keep it safe.
Recurring OEM/industrial accounts
Recurring OEM and industrial accounts are cash cows for Brenntag: locked‑in specs and long qualification cycles sharply reduce churn, and in 2024 these customers delivered steady, high-volume distribution that underpins margin stability. Aggressive cross‑sell keeps basket value high while minimal promotions are needed because reliability is the product; maintain SLAs and protect price to sustain cash generation.
- locked_in_specs
- low_churn
- cross_sell_+basket
- minimal_promo
- SLA_price_protection
Standard packaging & dilution services
Standard packaging & dilution services at Brenntag are a mature, consistent-volume cash cow delivering stable low-single-digit percent contributions to group revenue in 2024 while protecting margins on base chemicals. They require limited selling effort, with continuous improvement programs in 2024 lifting throughput and yield and keeping operating costs flat. This quiet engine generated steady free cash flow and supported working capital efficiency throughout 2024.
- Stable volumes, 2024: low-single-digit revenue share
- Margin accretive vs. raw chemicals
- Continuous improvement → higher throughput/yield
- Reliable free cash flow, low sales intensity
Scale + high utilization turn €19.0bn sales into steady cash flow
Commodity chemicals and packaging in mature markets generate stable, low‑growth volumes and high throughput, converting scale into predictable cash flow; Brenntag reported €19.0bn group sales in 2023. High utilization across 600+ warehouses in 78 countries keeps margins stable; focus on SLAs, inventory turns and selective cross‑sell to sustain FCF.
| Metric | Value |
|---|---|
| Group sales 2023 | €19.0bn |
| Warehouses | 600+ |
| Countries | 78 |
| Cash‑cow rev 2024 | low‑single‑digit % |
Full Transparency, Always
Brenntag BCG Matrix
The Brenntag BCG Matrix you're previewing on this page is the exact file you'll receive after purchase. No watermarks, no demo content—just a fully formatted, analysis-ready report built for clarity. Once you buy, the final document is yours to download, edit, print, or present—no surprises, no extra steps. Designed by strategy pros, it slots straight into your planning or investor decks.
Description
Unlock Strategic Clarity
See where Brenntag’s products land—Stars, Cash Cows, Dogs, or Question Marks—and stop guessing what to fund or fold. This preview teases the shape of the business; the full BCG Matrix gives you quadrant-level placements, data-backed recommendations, and a clear investment roadmap. Buy the complete report for a ready-to-use Word analysis plus an Excel summary you can drop into presentations and planning decks. Get instant access and start making smarter, faster strategic decisions today.
Stars
Life Sciences (pharma & personal care)
Life Sciences (pharma & personal care) sits in a high-growth segment with estimated 6–8% CAGR to 2024, and Brenntag already holds a leading distribution share supported by deep formulation know‑how. Technical support and regulatory capability create high switching costs for customers, so continue investing in formulation support and clean‑room services. Maintain strict quality controls; as volumes and margins stabilize this will mature into a reliable cash cow.
Food & Nutrition ingredients
Food & Nutrition ingredients are a fast-growing, innovation-driven Star for Brenntag, with the company sitting close to the customer brief through application labs and co-creation that drive repeat business. As of 2024 Brenntag operates in over 70 countries, enabling scale to compound advantages in sensory, clean-label and fortification trends. Investment in these areas accelerates margin and share gains when scaled globally.
Specialty chemicals distribution
Specialty chemicals distribution—adhesives, coatings, personal-care actives and high-spec additives—is where complexity pays and margins expand. Brenntag, the global market leader present in around 78 countries with FY 2023 group sales of roughly €20.2bn, leverages breadth and certifications for above‑market share. Doubling down on technical service and supplier exclusives will lock in advantaged positions. It soaks cash today but drives category leadership and cash generation later.
Value‑added services (custom blending & packaging)
Value-added services like custom blending and packaging are Stars: high-growth offerings that resolve customer pain points around compliance, small-batch runs and speed-to-market, locking customers in and improving basket margins; scale-driven capacity, automation and QA investments further increase stickiness as the core distribution business benefits from higher retention.
- High growth: solves compliance, small runs, speed
- Margin uplift: higher-margin services across portfolio
- Retention: creates sticky customer relationships
- Scale levers: add capacity, automation, QA to stay ahead
Water treatment solutions
Water treatment solutions
Regulatory tightening and steady municipal/industrial demand underpin a global water treatment chemicals market ~36 billion in 2024 with ~5% CAGR; Brenntag’s broad European and North American footprint and 2024 service reliability drive measurable share gains in municipal tenders. Bundling specialty chemistry with on‑site support raises switching costs; continued investment is warranted as this star remains high-growth.- Market size 2024: ~36bn, CAGR ~5%
- Brenntag strength: footprint + service = share gains
- Barrier: chemistry + on‑site support
- Strategy: keep investing to capture long-term growth
High-growth sectors — Life Sciences, Food & Nutrition, Specialty Chemicals, Water Treatment
Stars: Life Sciences (6–8% CAGR to 2024), Food & Nutrition (70+ countries), Specialty Chemicals (FY2023 sales ~€20.2bn; 78-country footprint) and Water Treatment (~$36bn market in 2024, ~5% CAGR) drive high growth, margin expansion and sticky customers; prioritize technical/service investment to convert into future cash cows.
| Segment | 2024 stat | CAGR | Brenntag edge |
|---|---|---|---|
| Life Sciences | 6–8% market growth | 6–8% | Formulation & regs |
| Food & Nutrition | 70+ countries | — | Application labs |
| Specialty | €20.2bn group sales (FY2023) | — | Certifications, scope |
| Water Treatment | ~$36bn market | ~5% | Footprint + on‑site |
What is included in the product
Detailed Word Document
Comprehensive BCG analysis of Brenntag's units, mapping Stars, Cash Cows, Question Marks and Dogs with investment recommendations.
Customizable Excel Spreadsheet
One-page Brenntag BCG Matrix places business units in quadrants for quick strategic clarity and action.
Cash Cows
Commodity industrial chemicals (mature regions)
Commodity industrial chemicals in mature regions show stable, low-growth demand (roughly 1% annual volume growth) and represent a large share of Brenntag’s portfolio, supporting scale—Brenntag reported ~€19.0bn group sales in 2023. Price sensitivity drives thin margins, so efficient routing, bulk buying and tight logistics convert volume into cash. Avoid price wars; optimize service and inventory turns to milk cash flows without overexpanding capacity.
Established supplier partnerships
Established supplier partnerships—anchored in Brenntag’s global network across over 78 countries—deliver long relationships, predictable allocations and repeat SKUs that drive high throughput. These channels require low capex to maintain yet generate steady cash flow used to fund new bets and absorb corporate overhead. Protecting service levels and contractual terms preserves margin stability. Focus on SLAs and contract renewals to lock in predictable volumes.
Warehousing & last‑mile distribution network
Warehousing & last‑mile distribution network: Brenntag operates more than 600 warehouses worldwide and holds industry certifications such as ISO 9001, ISO 14001 and ISO 45001, providing scale and safety few competitors match. Utilization is the primary margin lever for these assets, with occupancy rates managed centrally to optimize cash flow. Incremental tech, automation and slotting improvements feed directly to EBITDA and working capital, so keep it full, keep it safe.
Recurring OEM/industrial accounts
Recurring OEM and industrial accounts are cash cows for Brenntag: locked‑in specs and long qualification cycles sharply reduce churn, and in 2024 these customers delivered steady, high-volume distribution that underpins margin stability. Aggressive cross‑sell keeps basket value high while minimal promotions are needed because reliability is the product; maintain SLAs and protect price to sustain cash generation.
- locked_in_specs
- low_churn
- cross_sell_+basket
- minimal_promo
- SLA_price_protection
Standard packaging & dilution services
Standard packaging & dilution services at Brenntag are a mature, consistent-volume cash cow delivering stable low-single-digit percent contributions to group revenue in 2024 while protecting margins on base chemicals. They require limited selling effort, with continuous improvement programs in 2024 lifting throughput and yield and keeping operating costs flat. This quiet engine generated steady free cash flow and supported working capital efficiency throughout 2024.
- Stable volumes, 2024: low-single-digit revenue share
- Margin accretive vs. raw chemicals
- Continuous improvement → higher throughput/yield
- Reliable free cash flow, low sales intensity
Scale + high utilization turn €19.0bn sales into steady cash flow
Commodity chemicals and packaging in mature markets generate stable, low‑growth volumes and high throughput, converting scale into predictable cash flow; Brenntag reported €19.0bn group sales in 2023. High utilization across 600+ warehouses in 78 countries keeps margins stable; focus on SLAs, inventory turns and selective cross‑sell to sustain FCF.
| Metric | Value |
|---|---|
| Group sales 2023 | €19.0bn |
| Warehouses | 600+ |
| Countries | 78 |
| Cash‑cow rev 2024 | low‑single‑digit % |
Full Transparency, Always
Brenntag BCG Matrix
The Brenntag BCG Matrix you're previewing on this page is the exact file you'll receive after purchase. No watermarks, no demo content—just a fully formatted, analysis-ready report built for clarity. Once you buy, the final document is yours to download, edit, print, or present—no surprises, no extra steps. Designed by strategy pros, it slots straight into your planning or investor decks.











