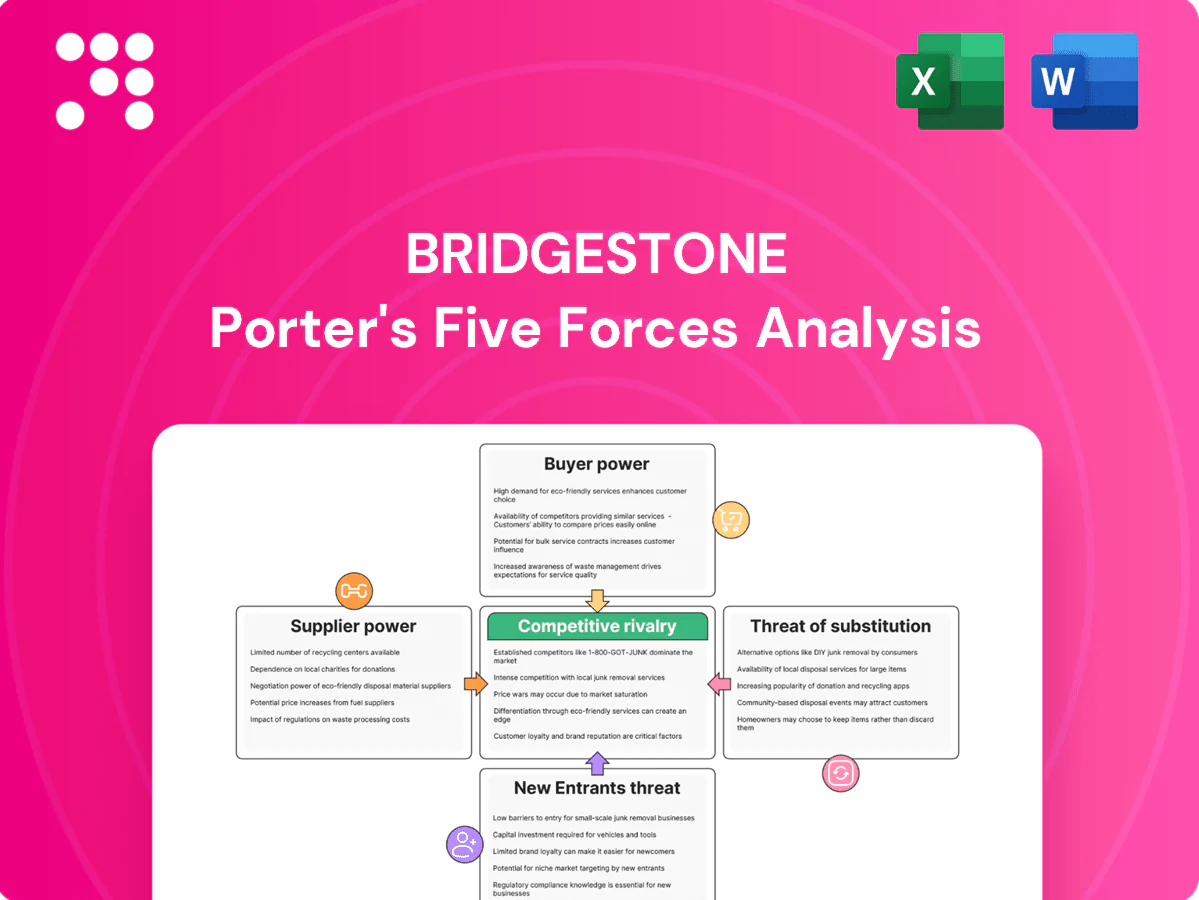
Bridgestone Porter's Five Forces Analysis

A Must-Have Tool for Decision-Makers
Bridgestone faces intense rivalry from global tire makers, moderate supplier leverage due to raw material concentration, and rising substitute threats from EV-specific solutions and retread alternatives. Buyer power is balanced by strong dealer networks, while barriers to entry remain high thanks to scale and brand. This brief snapshot only scratches the surface. Unlock the full Porter's Five Forces Analysis to explore Bridgestone’s competitive dynamics, market pressures, and strategic advantages in detail.
Suppliers Bargaining Power

Concentrated raw material sources
Concentrated supplies of natural rubber, synthetic rubber, carbon black and steel cord—with Southeast Asia producing roughly 70% of natural rubber—raise supplier leverage; weather, geopolitics and plantation cycles in 2024 tightened natural rubber availability, lifting prices. Bridgestone uses long-term contracts and backward integration (synthetic rubber and recycling investments) to blunt shocks, but price volatility still feeds through into COGS.
Switching costs in materials and specs
Materials must meet strict safety and performance standards such as UNECE R117 and FMVSS, raising qualification and switching costs; revalidating compounds and retooling production can take months and require multi-million-dollar investments. This lock-in gives approved suppliers measurable pricing power, which Bridgestone offsets through multi-sourcing and extensive in-house formulation R&D and testing capabilities.

Energy and petrochemical dependency
Synthetic rubber and process oils track petrochemical and energy markets, with Brent averaging about $86/barrel in 2024, exposing Bridgestone to upstream volatility and feedstock-driven cost swings. Suppliers have passed through price increases during tight markets, pressuring margins at plant level where regional energy price differentials matter. Hedging and efficiency programs reduce but do not eliminate this cost pressure.

Scale bargaining and global procurement
Bridgestone’s global scale—operations in over 150 countries—enables competitive tenders and leverage versus raw-material suppliers, while centralized procurement and supplier development reduce unit costs and raise quality. Preferred-supplier partnerships trade volume certainty for price and service commitments. This scale moderates supplier power compared with smaller rivals.
- Global footprint: 150+ countries
- Centralized procurement lowers unit costs
- Preferred partners: volume for price/service
Sustainability and traceability requirements
Sustainability and traceability (eg sustainable natural rubber) shrink qualified supplier pools; global natural rubber production was about 12.7 million tonnes in 2023, concentrating bargaining power. Compliance costs often shift upstream, enabling suppliers to demand premiums, while Bridgestone’s SNR initiatives and 2050 sustainable-materials goals strengthen long-term supply resilience but raise near-term input costs.
SE Asia rubber concentration, Brent volatility boost supplier leverage; scale limits pass-through
Concentrated natural-rubber supply (SE Asia ~70%) and 2024 feedstock volatility (Brent ~$86/bbl) give suppliers pricing leverage; Bridgestone’s long-term contracts, multi-sourcing and backward integration dampen but do not eliminate pass-through to COGS. Safety standards and sustainability shrink qualified suppliers, raising switching costs and compliance premiums; global scale (150+ countries) restores some negotiating power.
| Metric | Value |
|---|---|
| Natural rubber share (SE Asia) | ~70% |
| Natural rubber production (2023) | 12.7M t |
| Brent (avg 2024) | $86/bbl |
| Bridgestone footprint | 150+ countries |
What is included in the product
 Detailed Word Document
Tailored exclusively for Bridgestone, this Porter's Five Forces analysis uncovers key drivers of competition, supplier and buyer power, threats from substitutes and new entrants, and identifies disruptive forces and market dynamics shaping pricing and profitability.

 Customizable Excel Spreadsheet
A clear, one-sheet Porter's Five Forces summary for Bridgestone—perfect for quick decision-making and boardroom slides, with customizable pressure levels to reflect tire market shifts and regulatory changes.
Customers Bargaining Power

OEM dependency and price pressure
Automakers negotiate large, multi-year OE contracts (typically 3–7 years) with rigorous pricing, quality and delivery clauses, giving OEMs outsized bargaining power due to platform standardization and volume commitments. Securing fitments drives significant incremental volume for Bridgestone but commonly compresses margins on those SKUs. The global replacement aftermarket — roughly 60–70% of tyre demand — helps offset OEM pricing pressure by providing higher-margin lifecycle sales.
Highly informed replacement consumers
Digital comparison tools and retailer transparency let end-users price-shop — e-commerce tire sales reached about 15% of global replacement volumes in 2024, lifting buyer information and negotiation power. Private labels and aggressive promotions in mid-tier segments have driven higher price sensitivity, pressuring margins. Bridgestone defends with brand strength, RTP performance claims, and extended warranty programs. Elastic demand in economy tiers sustains elevated buyer power despite premium differentiation.

Fleet and commercial buyer consolidation
Large fleets and logistics firms, which represent roughly 30% of commercial tire volumes, aggregate purchasing power to demand discounts and strict SLAs, with telematics adoption now above 50% in heavy trucks driving negotiations toward total cost-of-ownership metrics. Bridgestone leverages an extensive retreading network that can cut replacement costs by 30–50% and bundles service, maintenance and spare strategies to retain accounts. Multi-year service contracts, often 3–5 years, trade lower unit price for customer stickiness and predictable revenue.

Channel intermediaries’ influence
Channel intermediaries—distributors, big-box retailers and e-commerce platforms—shape Bridgestone’s visibility and pricing, with e-commerce representing roughly 15% of tire sales in mature markets by 2024 and Bridgestone reporting ~3.6 trillion JPY in group revenue for FY2023; partners can promote house brands or rivals, so Bridgestone uses multi-channel mixes, MAP where allowed, exclusive SKUs and rebate schemes to align incentives.
- Distributors: control regional assortment
- Big-box retailers: drive volume, pressure pricing
- E-commerce: ~15% share in mature markets (2024)
- Defenses: multi-channel, MAP, exclusive SKUs, rebates
Performance-critical niches
In performance-critical niches such as aircraft, mining, and motorsport, buyers prioritize safety and performance over price, which limits their bargaining power. Stringent certifications and technical specifications create high switching costs and reduce buyer leverage. Bridgestone’s technical leadership and proprietary solutions support premium pricing and stabilize product mix and margins despite wider market price pressure.
- Safety-first demand reduces price sensitivity
- Certifications raise switching barriers
- Technical leadership preserves premium margins
OEM FIT squeeze margins; replacement 60–70%, fleets 30%
OEMs hold high power via multi-year FIT contracts compressing margins; replacement market (~60–70% of demand in 2024) provides higher margins and diversification. Fleets (~30% commercial volumes) negotiate on TCO; e-commerce ~15% share raises price transparency but premium niches retain pricing power.
| Channel | Buyer power | 2024 stat |
|---|---|---|
| OEMs | High | 3–7 yr contracts |
| Replacement | Medium | 60–70% |
| Fleets | High | ~30% |
Preview the Actual Deliverable
Bridgestone Porter's Five Forces Analysis
This preview shows the Bridgestone Porter’s Five Forces analysis exactly as delivered—no mockups or placeholders. It includes the full, professionally formatted assessment of competitive rivalry, supplier and buyer power, threat of substitutes, and barriers to entry. Once you purchase, you’ll receive this identical file instantly, ready for download and use. No edits or setup required.

A Must-Have Tool for Decision-Makers
Bridgestone faces intense rivalry from global tire makers, moderate supplier leverage due to raw material concentration, and rising substitute threats from EV-specific solutions and retread alternatives. Buyer power is balanced by strong dealer networks, while barriers to entry remain high thanks to scale and brand. This brief snapshot only scratches the surface. Unlock the full Porter's Five Forces Analysis to explore Bridgestone’s competitive dynamics, market pressures, and strategic advantages in detail.
Suppliers Bargaining Power
Concentrated raw material sources
Concentrated supplies of natural rubber, synthetic rubber, carbon black and steel cord—with Southeast Asia producing roughly 70% of natural rubber—raise supplier leverage; weather, geopolitics and plantation cycles in 2024 tightened natural rubber availability, lifting prices. Bridgestone uses long-term contracts and backward integration (synthetic rubber and recycling investments) to blunt shocks, but price volatility still feeds through into COGS.
Switching costs in materials and specs
Materials must meet strict safety and performance standards such as UNECE R117 and FMVSS, raising qualification and switching costs; revalidating compounds and retooling production can take months and require multi-million-dollar investments. This lock-in gives approved suppliers measurable pricing power, which Bridgestone offsets through multi-sourcing and extensive in-house formulation R&D and testing capabilities.
Energy and petrochemical dependency
Synthetic rubber and process oils track petrochemical and energy markets, with Brent averaging about $86/barrel in 2024, exposing Bridgestone to upstream volatility and feedstock-driven cost swings. Suppliers have passed through price increases during tight markets, pressuring margins at plant level where regional energy price differentials matter. Hedging and efficiency programs reduce but do not eliminate this cost pressure.
Scale bargaining and global procurement
Bridgestone’s global scale—operations in over 150 countries—enables competitive tenders and leverage versus raw-material suppliers, while centralized procurement and supplier development reduce unit costs and raise quality. Preferred-supplier partnerships trade volume certainty for price and service commitments. This scale moderates supplier power compared with smaller rivals.
- Global footprint: 150+ countries
- Centralized procurement lowers unit costs
- Preferred partners: volume for price/service
Sustainability and traceability requirements
Sustainability and traceability (eg sustainable natural rubber) shrink qualified supplier pools; global natural rubber production was about 12.7 million tonnes in 2023, concentrating bargaining power. Compliance costs often shift upstream, enabling suppliers to demand premiums, while Bridgestone’s SNR initiatives and 2050 sustainable-materials goals strengthen long-term supply resilience but raise near-term input costs.
SE Asia rubber concentration, Brent volatility boost supplier leverage; scale limits pass-through
Concentrated natural-rubber supply (SE Asia ~70%) and 2024 feedstock volatility (Brent ~$86/bbl) give suppliers pricing leverage; Bridgestone’s long-term contracts, multi-sourcing and backward integration dampen but do not eliminate pass-through to COGS. Safety standards and sustainability shrink qualified suppliers, raising switching costs and compliance premiums; global scale (150+ countries) restores some negotiating power.
| Metric | Value |
|---|---|
| Natural rubber share (SE Asia) | ~70% |
| Natural rubber production (2023) | 12.7M t |
| Brent (avg 2024) | $86/bbl |
| Bridgestone footprint | 150+ countries |
What is included in the product
Detailed Word Document
Tailored exclusively for Bridgestone, this Porter's Five Forces analysis uncovers key drivers of competition, supplier and buyer power, threats from substitutes and new entrants, and identifies disruptive forces and market dynamics shaping pricing and profitability.
Customizable Excel Spreadsheet
A clear, one-sheet Porter's Five Forces summary for Bridgestone—perfect for quick decision-making and boardroom slides, with customizable pressure levels to reflect tire market shifts and regulatory changes.
Customers Bargaining Power
OEM dependency and price pressure
Automakers negotiate large, multi-year OE contracts (typically 3–7 years) with rigorous pricing, quality and delivery clauses, giving OEMs outsized bargaining power due to platform standardization and volume commitments. Securing fitments drives significant incremental volume for Bridgestone but commonly compresses margins on those SKUs. The global replacement aftermarket — roughly 60–70% of tyre demand — helps offset OEM pricing pressure by providing higher-margin lifecycle sales.
Highly informed replacement consumers
Digital comparison tools and retailer transparency let end-users price-shop — e-commerce tire sales reached about 15% of global replacement volumes in 2024, lifting buyer information and negotiation power. Private labels and aggressive promotions in mid-tier segments have driven higher price sensitivity, pressuring margins. Bridgestone defends with brand strength, RTP performance claims, and extended warranty programs. Elastic demand in economy tiers sustains elevated buyer power despite premium differentiation.
Fleet and commercial buyer consolidation
Large fleets and logistics firms, which represent roughly 30% of commercial tire volumes, aggregate purchasing power to demand discounts and strict SLAs, with telematics adoption now above 50% in heavy trucks driving negotiations toward total cost-of-ownership metrics. Bridgestone leverages an extensive retreading network that can cut replacement costs by 30–50% and bundles service, maintenance and spare strategies to retain accounts. Multi-year service contracts, often 3–5 years, trade lower unit price for customer stickiness and predictable revenue.
Channel intermediaries’ influence
Channel intermediaries—distributors, big-box retailers and e-commerce platforms—shape Bridgestone’s visibility and pricing, with e-commerce representing roughly 15% of tire sales in mature markets by 2024 and Bridgestone reporting ~3.6 trillion JPY in group revenue for FY2023; partners can promote house brands or rivals, so Bridgestone uses multi-channel mixes, MAP where allowed, exclusive SKUs and rebate schemes to align incentives.
- Distributors: control regional assortment
- Big-box retailers: drive volume, pressure pricing
- E-commerce: ~15% share in mature markets (2024)
- Defenses: multi-channel, MAP, exclusive SKUs, rebates
Performance-critical niches
In performance-critical niches such as aircraft, mining, and motorsport, buyers prioritize safety and performance over price, which limits their bargaining power. Stringent certifications and technical specifications create high switching costs and reduce buyer leverage. Bridgestone’s technical leadership and proprietary solutions support premium pricing and stabilize product mix and margins despite wider market price pressure.
- Safety-first demand reduces price sensitivity
- Certifications raise switching barriers
- Technical leadership preserves premium margins
OEM FIT squeeze margins; replacement 60–70%, fleets 30%
OEMs hold high power via multi-year FIT contracts compressing margins; replacement market (~60–70% of demand in 2024) provides higher margins and diversification. Fleets (~30% commercial volumes) negotiate on TCO; e-commerce ~15% share raises price transparency but premium niches retain pricing power.
| Channel | Buyer power | 2024 stat |
|---|---|---|
| OEMs | High | 3–7 yr contracts |
| Replacement | Medium | 60–70% |
| Fleets | High | ~30% |
Preview the Actual Deliverable
Bridgestone Porter's Five Forces Analysis
This preview shows the Bridgestone Porter’s Five Forces analysis exactly as delivered—no mockups or placeholders. It includes the full, professionally formatted assessment of competitive rivalry, supplier and buyer power, threat of substitutes, and barriers to entry. Once you purchase, you’ll receive this identical file instantly, ready for download and use. No edits or setup required.
Original: $10.00
-65%$10.00
$3.50Description
A Must-Have Tool for Decision-Makers
Bridgestone faces intense rivalry from global tire makers, moderate supplier leverage due to raw material concentration, and rising substitute threats from EV-specific solutions and retread alternatives. Buyer power is balanced by strong dealer networks, while barriers to entry remain high thanks to scale and brand. This brief snapshot only scratches the surface. Unlock the full Porter's Five Forces Analysis to explore Bridgestone’s competitive dynamics, market pressures, and strategic advantages in detail.
Suppliers Bargaining Power
Concentrated raw material sources
Concentrated supplies of natural rubber, synthetic rubber, carbon black and steel cord—with Southeast Asia producing roughly 70% of natural rubber—raise supplier leverage; weather, geopolitics and plantation cycles in 2024 tightened natural rubber availability, lifting prices. Bridgestone uses long-term contracts and backward integration (synthetic rubber and recycling investments) to blunt shocks, but price volatility still feeds through into COGS.
Switching costs in materials and specs
Materials must meet strict safety and performance standards such as UNECE R117 and FMVSS, raising qualification and switching costs; revalidating compounds and retooling production can take months and require multi-million-dollar investments. This lock-in gives approved suppliers measurable pricing power, which Bridgestone offsets through multi-sourcing and extensive in-house formulation R&D and testing capabilities.
Energy and petrochemical dependency
Synthetic rubber and process oils track petrochemical and energy markets, with Brent averaging about $86/barrel in 2024, exposing Bridgestone to upstream volatility and feedstock-driven cost swings. Suppliers have passed through price increases during tight markets, pressuring margins at plant level where regional energy price differentials matter. Hedging and efficiency programs reduce but do not eliminate this cost pressure.
Scale bargaining and global procurement
Bridgestone’s global scale—operations in over 150 countries—enables competitive tenders and leverage versus raw-material suppliers, while centralized procurement and supplier development reduce unit costs and raise quality. Preferred-supplier partnerships trade volume certainty for price and service commitments. This scale moderates supplier power compared with smaller rivals.
- Global footprint: 150+ countries
- Centralized procurement lowers unit costs
- Preferred partners: volume for price/service
Sustainability and traceability requirements
Sustainability and traceability (eg sustainable natural rubber) shrink qualified supplier pools; global natural rubber production was about 12.7 million tonnes in 2023, concentrating bargaining power. Compliance costs often shift upstream, enabling suppliers to demand premiums, while Bridgestone’s SNR initiatives and 2050 sustainable-materials goals strengthen long-term supply resilience but raise near-term input costs.
SE Asia rubber concentration, Brent volatility boost supplier leverage; scale limits pass-through
Concentrated natural-rubber supply (SE Asia ~70%) and 2024 feedstock volatility (Brent ~$86/bbl) give suppliers pricing leverage; Bridgestone’s long-term contracts, multi-sourcing and backward integration dampen but do not eliminate pass-through to COGS. Safety standards and sustainability shrink qualified suppliers, raising switching costs and compliance premiums; global scale (150+ countries) restores some negotiating power.
| Metric | Value |
|---|---|
| Natural rubber share (SE Asia) | ~70% |
| Natural rubber production (2023) | 12.7M t |
| Brent (avg 2024) | $86/bbl |
| Bridgestone footprint | 150+ countries |
What is included in the product
Detailed Word Document
Tailored exclusively for Bridgestone, this Porter's Five Forces analysis uncovers key drivers of competition, supplier and buyer power, threats from substitutes and new entrants, and identifies disruptive forces and market dynamics shaping pricing and profitability.
Customizable Excel Spreadsheet
A clear, one-sheet Porter's Five Forces summary for Bridgestone—perfect for quick decision-making and boardroom slides, with customizable pressure levels to reflect tire market shifts and regulatory changes.
Customers Bargaining Power
OEM dependency and price pressure
Automakers negotiate large, multi-year OE contracts (typically 3–7 years) with rigorous pricing, quality and delivery clauses, giving OEMs outsized bargaining power due to platform standardization and volume commitments. Securing fitments drives significant incremental volume for Bridgestone but commonly compresses margins on those SKUs. The global replacement aftermarket — roughly 60–70% of tyre demand — helps offset OEM pricing pressure by providing higher-margin lifecycle sales.
Highly informed replacement consumers
Digital comparison tools and retailer transparency let end-users price-shop — e-commerce tire sales reached about 15% of global replacement volumes in 2024, lifting buyer information and negotiation power. Private labels and aggressive promotions in mid-tier segments have driven higher price sensitivity, pressuring margins. Bridgestone defends with brand strength, RTP performance claims, and extended warranty programs. Elastic demand in economy tiers sustains elevated buyer power despite premium differentiation.
Fleet and commercial buyer consolidation
Large fleets and logistics firms, which represent roughly 30% of commercial tire volumes, aggregate purchasing power to demand discounts and strict SLAs, with telematics adoption now above 50% in heavy trucks driving negotiations toward total cost-of-ownership metrics. Bridgestone leverages an extensive retreading network that can cut replacement costs by 30–50% and bundles service, maintenance and spare strategies to retain accounts. Multi-year service contracts, often 3–5 years, trade lower unit price for customer stickiness and predictable revenue.
Channel intermediaries’ influence
Channel intermediaries—distributors, big-box retailers and e-commerce platforms—shape Bridgestone’s visibility and pricing, with e-commerce representing roughly 15% of tire sales in mature markets by 2024 and Bridgestone reporting ~3.6 trillion JPY in group revenue for FY2023; partners can promote house brands or rivals, so Bridgestone uses multi-channel mixes, MAP where allowed, exclusive SKUs and rebate schemes to align incentives.
- Distributors: control regional assortment
- Big-box retailers: drive volume, pressure pricing
- E-commerce: ~15% share in mature markets (2024)
- Defenses: multi-channel, MAP, exclusive SKUs, rebates
Performance-critical niches
In performance-critical niches such as aircraft, mining, and motorsport, buyers prioritize safety and performance over price, which limits their bargaining power. Stringent certifications and technical specifications create high switching costs and reduce buyer leverage. Bridgestone’s technical leadership and proprietary solutions support premium pricing and stabilize product mix and margins despite wider market price pressure.
- Safety-first demand reduces price sensitivity
- Certifications raise switching barriers
- Technical leadership preserves premium margins
OEM FIT squeeze margins; replacement 60–70%, fleets 30%
OEMs hold high power via multi-year FIT contracts compressing margins; replacement market (~60–70% of demand in 2024) provides higher margins and diversification. Fleets (~30% commercial volumes) negotiate on TCO; e-commerce ~15% share raises price transparency but premium niches retain pricing power.
| Channel | Buyer power | 2024 stat |
|---|---|---|
| OEMs | High | 3–7 yr contracts |
| Replacement | Medium | 60–70% |
| Fleets | High | ~30% |
Preview the Actual Deliverable
Bridgestone Porter's Five Forces Analysis
This preview shows the Bridgestone Porter’s Five Forces analysis exactly as delivered—no mockups or placeholders. It includes the full, professionally formatted assessment of competitive rivalry, supplier and buyer power, threat of substitutes, and barriers to entry. Once you purchase, you’ll receive this identical file instantly, ready for download and use. No edits or setup required.











