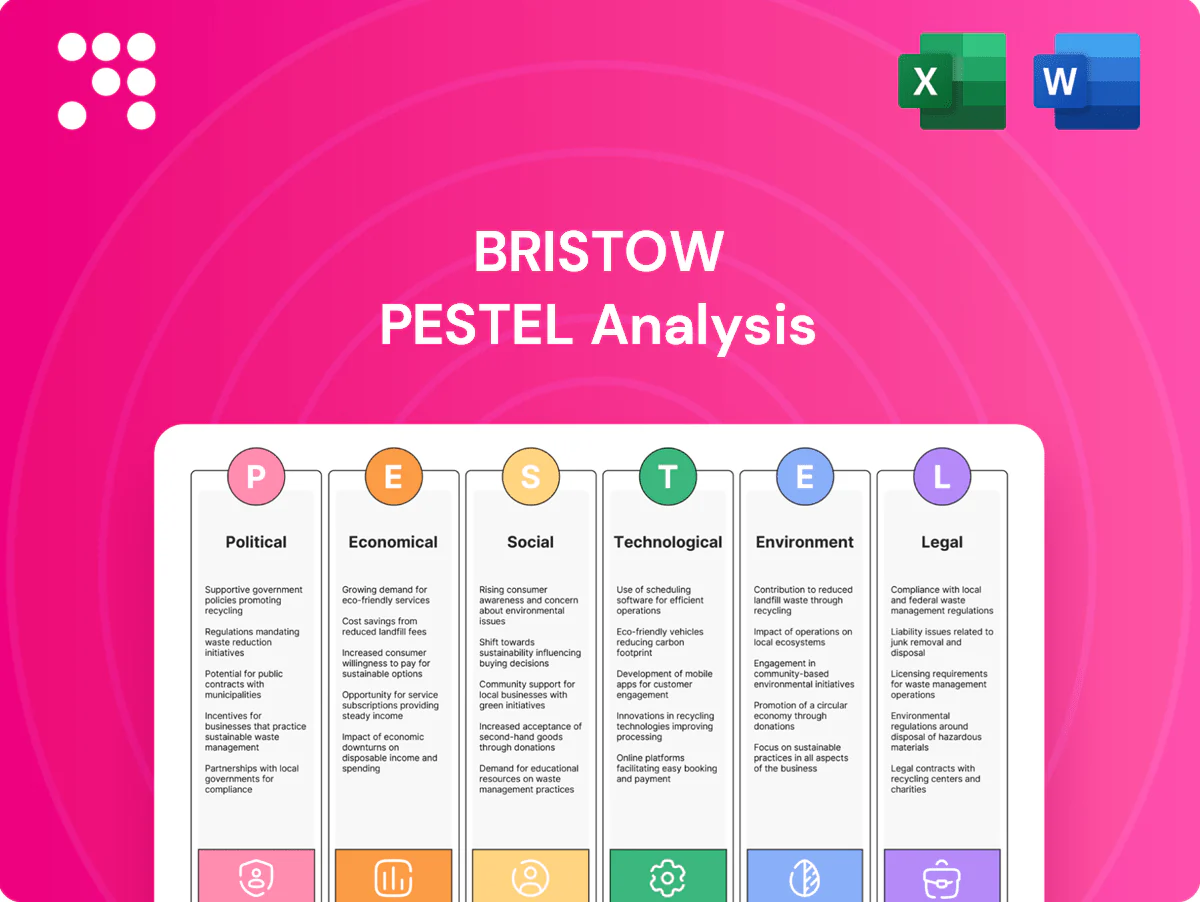
Bristow PESTLE Analysis

Your Competitive Advantage Starts with This Report
Discover how political shifts, economic cycles, social expectations, technological change, legal frameworks, and environmental pressures are shaping Bristow’s strategic outlook. This concise PESTLE snapshot highlights key risks and opportunities. Purchase the full analysis for actionable, board‑ready intelligence and instant download.
Political factors

Geopolitical stability in offshore basins
Bristow operates across the North Sea, Gulf of Mexico, Brazil, West Africa and Asia, exposing it to regime shifts and maritime security risks that can disrupt offshore production and flight schedules; Gulf of Mexico federal waters produced about 1.6 million bpd in 2023 (EIA), underscoring regional strategic importance.
Political tensions have previously forced flight reroutes and temporary suspension of offshore ops, while stable jurisdictions enable multi-year SAR and transport contracts that underpin revenue visibility.
Unrest and sanctions can raise insurance and war-risk premiums, increase operating costs, and force redeployment of aircraft, affecting utilization and margins.
Government SAR and public service contracts
Sovereign procurement cycles and budget priorities directly shape SAR demand and margins, with public SAR contracts typically awarded as multi-year deals (commonly 5–15 years) that determine predictable revenue streams and margin profiles.
Policy shifts toward consolidation or outsourcing can open opportunities or compress margins; large re-tenders often involve capex commitments in the range of $50–300m for fleet renewal and basing adaptations.
Service-level requirements drive fleet mix and base locations, affecting unit economics and operating cost per flight hour; election outcomes on 4–5 year cycles can materially reset contract renewal dynamics and funding certainty.

Local content and national aviation policies
Local hiring, training and ownership rules—commonly demanding majority national control (≥50%)—raise fixed costs and often force joint ventures for Bristow to access markets. Air operator certificate regimes and cabotage bans, upheld across ICAO’s 193 member states, shape entry timing and route rights. Compliance can win political goodwill and contract eligibility; non-compliance risks fines, AOC suspension and loss of flying rights.

Energy transition policies and subsidies
- Offshore wind growth: UK 50 GW by 2030
- Carbon price: ~€80–90/t (2024)
- SAF mandates: 2% by 2025, 6% by 2030 (EU)
- Policy uncertainty risks fleet capex
Sanctions, trade, and defense alignments
Export controls and sanctions since 2022 have restricted cross-border helicopter sales and parts flows, forcing longer OEM lead times and higher lease costs; sanctions on operators (notably against Russia) disrupted routes and MRO chains. Growing defense cooperation and rising SAR budgets amid higher global military spending (SIPRI reported $2.24 trillion in 2023) create parapublic contract opportunities. Rapid policy shifts demand agile compliance and supply‑chain rerouting to avoid revenue shocks.
- Export controls: limits on parts/sales across borders
- Sanctions: disrupted routes, MRO flows
- Defense cooperation: seeds SAR/parapublic contracts
- Policy volatility: requires agile compliance and rerouting
Regime and security risks threaten ops; long SAR/transport contracts underpin revenue
Bristow faces regime and security risks across key basins (North Sea, Gulf of Mexico, Brazil, West Africa) that can disrupt ops; stable jurisdictions provide 5–15 year SAR/transport contracts underpinning revenue. Policy drives (UK 50 GW by 2030, EU SAF 2% by 2025/6% by 2030, carbon €80–90/t in 2024) shift demand toward wind and low‑carbon services. Export controls and sanctions since 2022 lengthen OEM lead times and increase lease/MRO costs.
| Factor | Metric | Impact |
|---|---|---|
| Gulf output | 1.6m bpd (2023) | Strategic demand |
| SAR contracts | 5–15 years | Revenue visibility |
| Offshore wind | UK 50 GW by 2030 | New demand |
| Carbon/SAF | €80–90/t; 2%→6% | Fleet capex pressure |
What is included in the product
 Detailed Word Document
Explores how macro-environmental forces uniquely influence Bristow across six dimensions—Political, Economic, Social, Technological, Environmental, and Legal—with data-backed trends and region-specific examples to identify risks and opportunities for executives, investors, and strategists; delivered in clean, ready-to-use format with forward-looking insights to support scenario planning and funding conversations.

 Customizable Excel Spreadsheet
A concise, visually segmented PESTLE summary for Bristow that can be dropped into presentations, shared across teams, and annotated for local context to streamline planning, risk discussions, and client reporting.
Economic factors

Oil and gas capex cycles
Offshore exploration and production capex directly drives Bristow flight hours and pricing power; higher oil prices—Brent averaged about $86/bbl in 2024—typically lift utilization and day rates, while downturns cut discretionary crew changes and seismic support, reducing demand. Contract diversification into wind and government work—offshore wind capacity ~74 GW at end-2023—helps mitigate this cyclicality.
Fleet utilization and yield management
Matching aircraft class to mission maximizes margins by reducing fuel burn and optimizing block hours, while long-term contracts stabilize cash flows and spot work provides revenue upside and volatility.
Base consolidation and routing efficiency protect unit economics through lower repositioning and crew costs.
Idle assets depress ROIC and raise maintenance carry, tying capital to nonrevenue hours and increasing per-hour operating costs.

FX, inflation, and interest rates
Revenue and costs in USD, GBP, EUR, NOK and BRL create material translation and transaction exposure for Bristow; FX moved 8–12% year-on-year in 2024 between major pairs, amplifying earnings volatility. Inflation (2024: US ~3.4%, UK ~4%, Eurozone ~2.5%, Norway ~4%, Brazil ~4.5%) pressures wages, parts and insurance. Higher policy rates (Fed ~5.25–5.50%, BOE ~5%, ECB ~4%, Norges ~4.25%, Selic ~11.75%) raise lease and debt servicing for capital-intensive fleets. Hedging reduces short-term swings but cannot eliminate market volatility.

Supply chain and parts availability
OEM lead times remain elevated in 2024, often 9–18 months for major rotorcraft components, and MRO bottlenecks have grounded aircraft, directly reducing revenue through increased AOG days and lower utilization. Strategic spares pools have been shown to improve dispatch reliability and cut AOG rates, while a consolidated supplier base increases supplier pricing power versus operators. Implementation of predictive inventory has reduced parts-related working capital needs by double-digit percentages in several operators' 2023–24 programs.
- OEM lead times: 9–18 months (2024)
- MRO bottlenecks: higher AOG days, lower utilization
- Strategic spares: improved dispatch reliability
- Consolidated suppliers: increased pricing power
- Predictive inventory: double-digit reduction in parts working capital
Client credit quality and consolidation
IOCs and NOCs generally offer stronger counterparty profiles than smaller E&Ps, reducing credit risk for Bristow though exposure remains concentrated with major operators.
Offshore wind developers and governments provide stable, long-term contracts but commonly negotiate tighter commercial and payment terms that compress margins.
Industry consolidation increases competition in tenders and, combined with frequent payment delays, strains Bristow’s cash conversion cycle and working capital.
- Counterparty strength: IOCs/NOCs > smaller E&Ps
- Offshore wind: stability with tighter terms
- Consolidation: tender price pressure
- Payment delays: cash conversion risk
Regime and security risks threaten ops; long SAR/transport contracts underpin revenue
Brent ~$86/bbl in 2024 drove higher offshore crew-change demand and day rates, boosting utilization.
FX moves 8–12% in 2024 plus inflation (US 3.4%, UK 4%, EUR 2.5%) and higher policy rates increased operating and financing costs.
OEM lead times 9–18 months and MRO bottlenecks raised AOG days, reducing ROIC.
| Metric | 2024 |
|---|---|
| Brent | $86/bbl |
| FX volatility | 8–12% |
| OEM lead time | 9–18m |
Preview Before You Purchase
Bristow PESTLE Analysis
The Bristow PESTLE Analysis preview shown here is the exact document you’ll receive after purchase—fully formatted and ready to use. This real screenshot reflects the finished file with complete content and structure. No placeholders or teasers; after payment you’ll instantly download this same, professionally structured report.

Your Competitive Advantage Starts with This Report
Discover how political shifts, economic cycles, social expectations, technological change, legal frameworks, and environmental pressures are shaping Bristow’s strategic outlook. This concise PESTLE snapshot highlights key risks and opportunities. Purchase the full analysis for actionable, board‑ready intelligence and instant download.
Political factors
Geopolitical stability in offshore basins
Bristow operates across the North Sea, Gulf of Mexico, Brazil, West Africa and Asia, exposing it to regime shifts and maritime security risks that can disrupt offshore production and flight schedules; Gulf of Mexico federal waters produced about 1.6 million bpd in 2023 (EIA), underscoring regional strategic importance.
Political tensions have previously forced flight reroutes and temporary suspension of offshore ops, while stable jurisdictions enable multi-year SAR and transport contracts that underpin revenue visibility.
Unrest and sanctions can raise insurance and war-risk premiums, increase operating costs, and force redeployment of aircraft, affecting utilization and margins.
Government SAR and public service contracts
Sovereign procurement cycles and budget priorities directly shape SAR demand and margins, with public SAR contracts typically awarded as multi-year deals (commonly 5–15 years) that determine predictable revenue streams and margin profiles.
Policy shifts toward consolidation or outsourcing can open opportunities or compress margins; large re-tenders often involve capex commitments in the range of $50–300m for fleet renewal and basing adaptations.
Service-level requirements drive fleet mix and base locations, affecting unit economics and operating cost per flight hour; election outcomes on 4–5 year cycles can materially reset contract renewal dynamics and funding certainty.
Local content and national aviation policies
Local hiring, training and ownership rules—commonly demanding majority national control (≥50%)—raise fixed costs and often force joint ventures for Bristow to access markets. Air operator certificate regimes and cabotage bans, upheld across ICAO’s 193 member states, shape entry timing and route rights. Compliance can win political goodwill and contract eligibility; non-compliance risks fines, AOC suspension and loss of flying rights.
Energy transition policies and subsidies
- Offshore wind growth: UK 50 GW by 2030
- Carbon price: ~€80–90/t (2024)
- SAF mandates: 2% by 2025, 6% by 2030 (EU)
- Policy uncertainty risks fleet capex
Sanctions, trade, and defense alignments
Export controls and sanctions since 2022 have restricted cross-border helicopter sales and parts flows, forcing longer OEM lead times and higher lease costs; sanctions on operators (notably against Russia) disrupted routes and MRO chains. Growing defense cooperation and rising SAR budgets amid higher global military spending (SIPRI reported $2.24 trillion in 2023) create parapublic contract opportunities. Rapid policy shifts demand agile compliance and supply‑chain rerouting to avoid revenue shocks.
- Export controls: limits on parts/sales across borders
- Sanctions: disrupted routes, MRO flows
- Defense cooperation: seeds SAR/parapublic contracts
- Policy volatility: requires agile compliance and rerouting
Regime and security risks threaten ops; long SAR/transport contracts underpin revenue
Bristow faces regime and security risks across key basins (North Sea, Gulf of Mexico, Brazil, West Africa) that can disrupt ops; stable jurisdictions provide 5–15 year SAR/transport contracts underpinning revenue. Policy drives (UK 50 GW by 2030, EU SAF 2% by 2025/6% by 2030, carbon €80–90/t in 2024) shift demand toward wind and low‑carbon services. Export controls and sanctions since 2022 lengthen OEM lead times and increase lease/MRO costs.
| Factor | Metric | Impact |
|---|---|---|
| Gulf output | 1.6m bpd (2023) | Strategic demand |
| SAR contracts | 5–15 years | Revenue visibility |
| Offshore wind | UK 50 GW by 2030 | New demand |
| Carbon/SAF | €80–90/t; 2%→6% | Fleet capex pressure |
What is included in the product
Detailed Word Document
Explores how macro-environmental forces uniquely influence Bristow across six dimensions—Political, Economic, Social, Technological, Environmental, and Legal—with data-backed trends and region-specific examples to identify risks and opportunities for executives, investors, and strategists; delivered in clean, ready-to-use format with forward-looking insights to support scenario planning and funding conversations.
Customizable Excel Spreadsheet
A concise, visually segmented PESTLE summary for Bristow that can be dropped into presentations, shared across teams, and annotated for local context to streamline planning, risk discussions, and client reporting.
Economic factors
Oil and gas capex cycles
Offshore exploration and production capex directly drives Bristow flight hours and pricing power; higher oil prices—Brent averaged about $86/bbl in 2024—typically lift utilization and day rates, while downturns cut discretionary crew changes and seismic support, reducing demand. Contract diversification into wind and government work—offshore wind capacity ~74 GW at end-2023—helps mitigate this cyclicality.
Fleet utilization and yield management
Matching aircraft class to mission maximizes margins by reducing fuel burn and optimizing block hours, while long-term contracts stabilize cash flows and spot work provides revenue upside and volatility.
Base consolidation and routing efficiency protect unit economics through lower repositioning and crew costs.
Idle assets depress ROIC and raise maintenance carry, tying capital to nonrevenue hours and increasing per-hour operating costs.
FX, inflation, and interest rates
Revenue and costs in USD, GBP, EUR, NOK and BRL create material translation and transaction exposure for Bristow; FX moved 8–12% year-on-year in 2024 between major pairs, amplifying earnings volatility. Inflation (2024: US ~3.4%, UK ~4%, Eurozone ~2.5%, Norway ~4%, Brazil ~4.5%) pressures wages, parts and insurance. Higher policy rates (Fed ~5.25–5.50%, BOE ~5%, ECB ~4%, Norges ~4.25%, Selic ~11.75%) raise lease and debt servicing for capital-intensive fleets. Hedging reduces short-term swings but cannot eliminate market volatility.
Supply chain and parts availability
OEM lead times remain elevated in 2024, often 9–18 months for major rotorcraft components, and MRO bottlenecks have grounded aircraft, directly reducing revenue through increased AOG days and lower utilization. Strategic spares pools have been shown to improve dispatch reliability and cut AOG rates, while a consolidated supplier base increases supplier pricing power versus operators. Implementation of predictive inventory has reduced parts-related working capital needs by double-digit percentages in several operators' 2023–24 programs.
- OEM lead times: 9–18 months (2024)
- MRO bottlenecks: higher AOG days, lower utilization
- Strategic spares: improved dispatch reliability
- Consolidated suppliers: increased pricing power
- Predictive inventory: double-digit reduction in parts working capital
Client credit quality and consolidation
IOCs and NOCs generally offer stronger counterparty profiles than smaller E&Ps, reducing credit risk for Bristow though exposure remains concentrated with major operators.
Offshore wind developers and governments provide stable, long-term contracts but commonly negotiate tighter commercial and payment terms that compress margins.
Industry consolidation increases competition in tenders and, combined with frequent payment delays, strains Bristow’s cash conversion cycle and working capital.
- Counterparty strength: IOCs/NOCs > smaller E&Ps
- Offshore wind: stability with tighter terms
- Consolidation: tender price pressure
- Payment delays: cash conversion risk
Regime and security risks threaten ops; long SAR/transport contracts underpin revenue
Brent ~$86/bbl in 2024 drove higher offshore crew-change demand and day rates, boosting utilization.
FX moves 8–12% in 2024 plus inflation (US 3.4%, UK 4%, EUR 2.5%) and higher policy rates increased operating and financing costs.
OEM lead times 9–18 months and MRO bottlenecks raised AOG days, reducing ROIC.
| Metric | 2024 |
|---|---|
| Brent | $86/bbl |
| FX volatility | 8–12% |
| OEM lead time | 9–18m |
Preview Before You Purchase
Bristow PESTLE Analysis
The Bristow PESTLE Analysis preview shown here is the exact document you’ll receive after purchase—fully formatted and ready to use. This real screenshot reflects the finished file with complete content and structure. No placeholders or teasers; after payment you’ll instantly download this same, professionally structured report.
Original: $10.00
-65%$10.00
$3.50Description
Your Competitive Advantage Starts with This Report
Discover how political shifts, economic cycles, social expectations, technological change, legal frameworks, and environmental pressures are shaping Bristow’s strategic outlook. This concise PESTLE snapshot highlights key risks and opportunities. Purchase the full analysis for actionable, board‑ready intelligence and instant download.
Political factors
Geopolitical stability in offshore basins
Bristow operates across the North Sea, Gulf of Mexico, Brazil, West Africa and Asia, exposing it to regime shifts and maritime security risks that can disrupt offshore production and flight schedules; Gulf of Mexico federal waters produced about 1.6 million bpd in 2023 (EIA), underscoring regional strategic importance.
Political tensions have previously forced flight reroutes and temporary suspension of offshore ops, while stable jurisdictions enable multi-year SAR and transport contracts that underpin revenue visibility.
Unrest and sanctions can raise insurance and war-risk premiums, increase operating costs, and force redeployment of aircraft, affecting utilization and margins.
Government SAR and public service contracts
Sovereign procurement cycles and budget priorities directly shape SAR demand and margins, with public SAR contracts typically awarded as multi-year deals (commonly 5–15 years) that determine predictable revenue streams and margin profiles.
Policy shifts toward consolidation or outsourcing can open opportunities or compress margins; large re-tenders often involve capex commitments in the range of $50–300m for fleet renewal and basing adaptations.
Service-level requirements drive fleet mix and base locations, affecting unit economics and operating cost per flight hour; election outcomes on 4–5 year cycles can materially reset contract renewal dynamics and funding certainty.
Local content and national aviation policies
Local hiring, training and ownership rules—commonly demanding majority national control (≥50%)—raise fixed costs and often force joint ventures for Bristow to access markets. Air operator certificate regimes and cabotage bans, upheld across ICAO’s 193 member states, shape entry timing and route rights. Compliance can win political goodwill and contract eligibility; non-compliance risks fines, AOC suspension and loss of flying rights.
Energy transition policies and subsidies
- Offshore wind growth: UK 50 GW by 2030
- Carbon price: ~€80–90/t (2024)
- SAF mandates: 2% by 2025, 6% by 2030 (EU)
- Policy uncertainty risks fleet capex
Sanctions, trade, and defense alignments
Export controls and sanctions since 2022 have restricted cross-border helicopter sales and parts flows, forcing longer OEM lead times and higher lease costs; sanctions on operators (notably against Russia) disrupted routes and MRO chains. Growing defense cooperation and rising SAR budgets amid higher global military spending (SIPRI reported $2.24 trillion in 2023) create parapublic contract opportunities. Rapid policy shifts demand agile compliance and supply‑chain rerouting to avoid revenue shocks.
- Export controls: limits on parts/sales across borders
- Sanctions: disrupted routes, MRO flows
- Defense cooperation: seeds SAR/parapublic contracts
- Policy volatility: requires agile compliance and rerouting
Regime and security risks threaten ops; long SAR/transport contracts underpin revenue
Bristow faces regime and security risks across key basins (North Sea, Gulf of Mexico, Brazil, West Africa) that can disrupt ops; stable jurisdictions provide 5–15 year SAR/transport contracts underpinning revenue. Policy drives (UK 50 GW by 2030, EU SAF 2% by 2025/6% by 2030, carbon €80–90/t in 2024) shift demand toward wind and low‑carbon services. Export controls and sanctions since 2022 lengthen OEM lead times and increase lease/MRO costs.
| Factor | Metric | Impact |
|---|---|---|
| Gulf output | 1.6m bpd (2023) | Strategic demand |
| SAR contracts | 5–15 years | Revenue visibility |
| Offshore wind | UK 50 GW by 2030 | New demand |
| Carbon/SAF | €80–90/t; 2%→6% | Fleet capex pressure |
What is included in the product
Detailed Word Document
Explores how macro-environmental forces uniquely influence Bristow across six dimensions—Political, Economic, Social, Technological, Environmental, and Legal—with data-backed trends and region-specific examples to identify risks and opportunities for executives, investors, and strategists; delivered in clean, ready-to-use format with forward-looking insights to support scenario planning and funding conversations.
Customizable Excel Spreadsheet
A concise, visually segmented PESTLE summary for Bristow that can be dropped into presentations, shared across teams, and annotated for local context to streamline planning, risk discussions, and client reporting.
Economic factors
Oil and gas capex cycles
Offshore exploration and production capex directly drives Bristow flight hours and pricing power; higher oil prices—Brent averaged about $86/bbl in 2024—typically lift utilization and day rates, while downturns cut discretionary crew changes and seismic support, reducing demand. Contract diversification into wind and government work—offshore wind capacity ~74 GW at end-2023—helps mitigate this cyclicality.
Fleet utilization and yield management
Matching aircraft class to mission maximizes margins by reducing fuel burn and optimizing block hours, while long-term contracts stabilize cash flows and spot work provides revenue upside and volatility.
Base consolidation and routing efficiency protect unit economics through lower repositioning and crew costs.
Idle assets depress ROIC and raise maintenance carry, tying capital to nonrevenue hours and increasing per-hour operating costs.
FX, inflation, and interest rates
Revenue and costs in USD, GBP, EUR, NOK and BRL create material translation and transaction exposure for Bristow; FX moved 8–12% year-on-year in 2024 between major pairs, amplifying earnings volatility. Inflation (2024: US ~3.4%, UK ~4%, Eurozone ~2.5%, Norway ~4%, Brazil ~4.5%) pressures wages, parts and insurance. Higher policy rates (Fed ~5.25–5.50%, BOE ~5%, ECB ~4%, Norges ~4.25%, Selic ~11.75%) raise lease and debt servicing for capital-intensive fleets. Hedging reduces short-term swings but cannot eliminate market volatility.
Supply chain and parts availability
OEM lead times remain elevated in 2024, often 9–18 months for major rotorcraft components, and MRO bottlenecks have grounded aircraft, directly reducing revenue through increased AOG days and lower utilization. Strategic spares pools have been shown to improve dispatch reliability and cut AOG rates, while a consolidated supplier base increases supplier pricing power versus operators. Implementation of predictive inventory has reduced parts-related working capital needs by double-digit percentages in several operators' 2023–24 programs.
- OEM lead times: 9–18 months (2024)
- MRO bottlenecks: higher AOG days, lower utilization
- Strategic spares: improved dispatch reliability
- Consolidated suppliers: increased pricing power
- Predictive inventory: double-digit reduction in parts working capital
Client credit quality and consolidation
IOCs and NOCs generally offer stronger counterparty profiles than smaller E&Ps, reducing credit risk for Bristow though exposure remains concentrated with major operators.
Offshore wind developers and governments provide stable, long-term contracts but commonly negotiate tighter commercial and payment terms that compress margins.
Industry consolidation increases competition in tenders and, combined with frequent payment delays, strains Bristow’s cash conversion cycle and working capital.
- Counterparty strength: IOCs/NOCs > smaller E&Ps
- Offshore wind: stability with tighter terms
- Consolidation: tender price pressure
- Payment delays: cash conversion risk
Regime and security risks threaten ops; long SAR/transport contracts underpin revenue
Brent ~$86/bbl in 2024 drove higher offshore crew-change demand and day rates, boosting utilization.
FX moves 8–12% in 2024 plus inflation (US 3.4%, UK 4%, EUR 2.5%) and higher policy rates increased operating and financing costs.
OEM lead times 9–18 months and MRO bottlenecks raised AOG days, reducing ROIC.
| Metric | 2024 |
|---|---|
| Brent | $86/bbl |
| FX volatility | 8–12% |
| OEM lead time | 9–18m |
Preview Before You Purchase
Bristow PESTLE Analysis
The Bristow PESTLE Analysis preview shown here is the exact document you’ll receive after purchase—fully formatted and ready to use. This real screenshot reflects the finished file with complete content and structure. No placeholders or teasers; after payment you’ll instantly download this same, professionally structured report.











