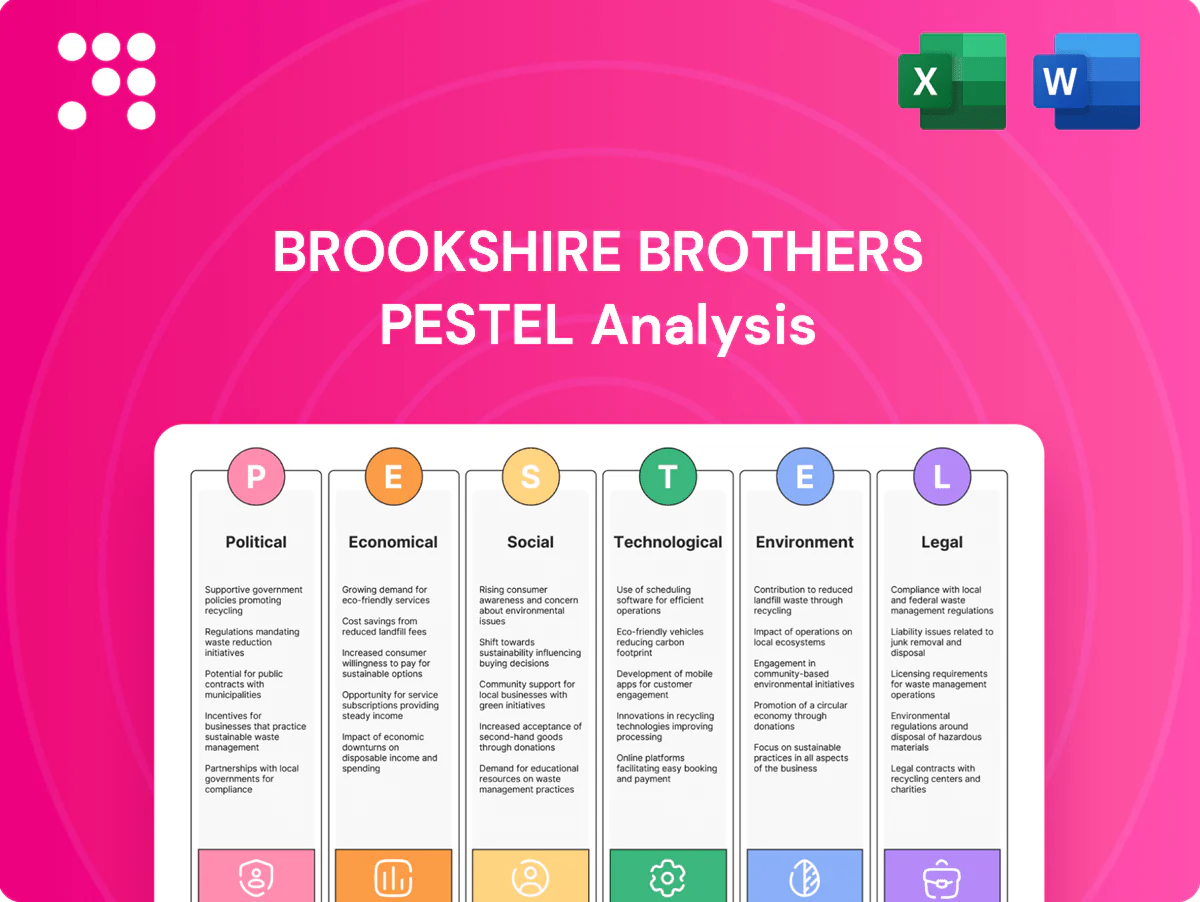
Brookshire Brothers PESTLE Analysis

Make Smarter Strategic Decisions with a Complete PESTEL View
Unlock how political regulation, regional economic trends, and shifting consumer preferences shape Brookshire Brothers’ competitive edge in our focused PESTLE snapshot. This concise overview pinpoints key risks and opportunities to inform smarter strategy and investment calls. Purchase the full PESTLE for a complete, actionable briefing ready for immediate use.
Political factors

State and local policy impacts in Texas and Louisiana
Operating primarily in Texas (no state income tax; state sales tax 6.25%, combined max 8.25%) and Louisiana exposes Brookshire Brothers to differing tax structures, incentives, and local ordinances. Changes in state food tax exemptions, fuel levies or pharmacy rules in either state directly affect pricing and margins. Local zoning and permitting dictate new store footprints, fuel canopies and pharmacy additions. Active engagement with municipal governments is essential for site approvals and community programs.
Public health and nutrition programs (SNAP/WIC)
Eligibility rules, reimbursement rates and tech requirements for SNAP/WIC—programs serving about 41 million SNAP recipients (2023) and ~6.6 million WIC participants (2022)—shape basket mix and traffic, with average SNAP benefits near 250–270 USD/month. eWIC/system updates require compliant POS and tightened inventory controls; full eWIC rollout completed by 2020. Emergency policy expansions have lifted volumes; any cuts would pressure sales in lower-income trade areas.

Disaster preparedness and emergency coordination
Gulf Coast politics around hurricane readiness drive Brookshire Brothers to prioritize storm inventory and fuel logistics, especially given the NOAA 1991–2020 seasonal average of 14 named storms, 7 hurricanes and 3 major hurricanes. Coordination with state emergency agencies accelerates store access and reopening after declarations. Federal and state focus on grid resiliency and fuel supply continuity directly affects operating stability. Active participation in community relief strengthens ties with local officials and emergency planners.

Healthcare policy affecting in-store pharmacies
Vaccination mandates and public health campaigns drove pharmacies to deliver a substantial share of adult vaccinations (pharmacies administer roughly 40% of flu shots), increasing foot traffic.
State regulatory moves expanding pharmacist scope (vaccinations, chronic care management) create revenue opportunities but heightened reimbursement squeeze reduces per-prescription margins.
- Medicaid/Part D influence reimbursement
- Vaccination policy boosts traffic (~40% flu shots)
- Expanded pharmacist services = growth
- Reimbursement compression = margin pressure
Labor and immigration policy at state/local levels
Local workforce development programs such as WIOA support training for fresh/fuel/pharmacy teams; political shifts on immigration influence labor supply in distribution and stores and can increase turnover and recruitment spend.
TX/LA retail risks: tax, SNAP/WIC, hurricane exposure, pharmacy margin squeeze
Operating across Texas and Louisiana exposes Brookshire Brothers to diverging tax/sales rules (TX sales tax 6.25% state, combined max 8.25%), SNAP/WIC policy (SNAP ~41M recipients 2023; WIC ~6.6M 2022) and hurricane preparedness (NOAA 1991–2020 avg: 14 named storms). Pharmacy reimbursement pressures from Medicaid/Part D and expanded scope raise revenue opportunities but compress margins; federal min wage $7.25/hr affects labor costs.
| Issue | Metric | Impact |
|---|---|---|
| SNAP/WIC | 41M / 6.6M | Sales/traffic |
| Storm risk | 14 named storms avg | Inventory/fuel |
| Wages | $7.25 federal | Labor cost |
What is included in the product
 Detailed Word Document
Explores how Political, Economic, Social, Technological, Environmental, and Legal forces uniquely impact Brookshire Brothers, with data-driven insights and region-specific examples to identify risks and opportunities. Designed for executives and advisors to support strategy, scenario planning, and investor communications.

 Customizable Excel Spreadsheet
A concise, visually segmented PESTLE summary for Brookshire Brothers that can be dropped into presentations, shared across teams, and edited with notes to support quick alignment and risk discussions during planning sessions.
Economic factors

Inflation and consumer purchasing power
Food-at-home inflation, which rose about 2.7% in 2024, heightens price sensitivity and drives private-label trade-down in Brookshire Brothers stores. Volatile fuel — U.S. pump averages swung near $3.60/gal in 2024–25 — reduces trip frequency and convenience sales. Wage growth (~4% avg. annual) versus CPI determines real spending in core Texas/Louisiana communities. Margin management relies on pricing analytics and stronger vendor negotiations to protect margins.
Regional economic cycles in Texas and Louisiana
Energy-sector swings in Texas (crude production >5 million barrels/day) and Louisiana (roughly 10% of US natural gas output) directly affect household incomes and retail demand, tightening discretionary spend when prices or employment fall. Rural reliance on local plants makes Brookshire Brothers’ sales sensitive to openings/closures in small towns. Tourism peaks and college towns give seasonal uplift for select stores, while diversified formats across ~170 stores smooth cycle variability.

Supply chain costs and availability
Transportation rates, diesel (U.S. average ~4.12/gal in 2024 per EIA) and driver availability (industry shortfall ~60–80k drivers) directly increase landed cost—transport can represent ~10–15% of grocery COGS. Weather shocks in 2023–24 caused double-digit spikes in select produce and protein prices. Multi-sourcing and regional DC alignment cut out-of-stocks, while tighter vendor terms and shrink control (shrink ~1.5–2% of sales) protect gross margin.

Interest rates and capital expenditure
Higher interest rates (Federal funds ~5.25–5.50% mid-2025; CRE borrowing ~6–7%) raise the hurdle for remodels, refrigeration upgrades and fuel-site investments, increasing required returns. Lease-versus-own decisions shift toward leasing or vendor financing as cost of capital rises. Capex is being prioritized to high-ROI tech and energy-saving projects (paybacks often 3–7 years) while maintaining store standards to protect traffic and sales per sq ft.
- Higher financing costs raise capex hurdle
- Shift to leasing/vendor financing
- Priority: tech, LED, HVAC, solar (3–7yr payback)
- Store standards critical for traffic retention
Competitive dynamics and price perception
National discounters, dollar stores and club formats pressure Brookshire Brothers price image; Dollar General had about 19,000 stores in 2024 and Costco reported roughly 242 billion in FY2024 sales, intensifying price competition. Local independents compete on service and perishables, sustaining loyalty. Strategic promotions and loyalty offers can defend share. Convenience and pharmacy integration raise basket accretion and visit frequency.
- Discounters: large footprint (Dollar General ~19,000 stores 2024)
- Clubs: Costco ~242B net sales FY2024
- Local edge: service & perishables
- Defense: promos, loyalty, pharmacy-driven baskets
TX/LA retail risks: tax, SNAP/WIC, hurricane exposure, pharmacy margin squeeze
Food-at-home inflation ~2.7% (2024) and ~3.60/gal fuel (2024–25) push private‑label trade-down and reduce trips; wage growth ~4% shapes real spending in TX/LA. Energy jobs (TX crude >5mbd; LA ~10% US gas) and tourism/college seasonality drive store-level variance. Higher rates (Fed 5.25–5.50% mid‑2025) raise capex hurdles; transport/diesel (~$4.12/gal 2024) and driver shortfall (60–80k) lift COGS. Discounters (Dollar General ~19k stores) and Costco ($242B FY2024) pressure pricing.
| Metric | 2024/25 |
|---|---|
| Food inflation | 2.7% |
| Fuel (pump) | $3.60/gal |
| Diesel | $4.12/gal |
| Fed funds | 5.25–5.50% |
| Brookshire stores | ~170 |
What You See Is What You Get
Brookshire Brothers PESTLE Analysis
This Brookshire Brothers PESTLE Analysis summarizes key political, economic, social, technological, legal, and environmental factors affecting the regional grocery chain. It highlights opportunities, risks, and strategic implications for operations and growth. The preview shown here is the exact document you’ll receive after purchase—fully formatted and ready to use.

Make Smarter Strategic Decisions with a Complete PESTEL View
Unlock how political regulation, regional economic trends, and shifting consumer preferences shape Brookshire Brothers’ competitive edge in our focused PESTLE snapshot. This concise overview pinpoints key risks and opportunities to inform smarter strategy and investment calls. Purchase the full PESTLE for a complete, actionable briefing ready for immediate use.
Political factors
State and local policy impacts in Texas and Louisiana
Operating primarily in Texas (no state income tax; state sales tax 6.25%, combined max 8.25%) and Louisiana exposes Brookshire Brothers to differing tax structures, incentives, and local ordinances. Changes in state food tax exemptions, fuel levies or pharmacy rules in either state directly affect pricing and margins. Local zoning and permitting dictate new store footprints, fuel canopies and pharmacy additions. Active engagement with municipal governments is essential for site approvals and community programs.
Public health and nutrition programs (SNAP/WIC)
Eligibility rules, reimbursement rates and tech requirements for SNAP/WIC—programs serving about 41 million SNAP recipients (2023) and ~6.6 million WIC participants (2022)—shape basket mix and traffic, with average SNAP benefits near 250–270 USD/month. eWIC/system updates require compliant POS and tightened inventory controls; full eWIC rollout completed by 2020. Emergency policy expansions have lifted volumes; any cuts would pressure sales in lower-income trade areas.
Disaster preparedness and emergency coordination
Gulf Coast politics around hurricane readiness drive Brookshire Brothers to prioritize storm inventory and fuel logistics, especially given the NOAA 1991–2020 seasonal average of 14 named storms, 7 hurricanes and 3 major hurricanes. Coordination with state emergency agencies accelerates store access and reopening after declarations. Federal and state focus on grid resiliency and fuel supply continuity directly affects operating stability. Active participation in community relief strengthens ties with local officials and emergency planners.
Healthcare policy affecting in-store pharmacies
Vaccination mandates and public health campaigns drove pharmacies to deliver a substantial share of adult vaccinations (pharmacies administer roughly 40% of flu shots), increasing foot traffic.
State regulatory moves expanding pharmacist scope (vaccinations, chronic care management) create revenue opportunities but heightened reimbursement squeeze reduces per-prescription margins.
- Medicaid/Part D influence reimbursement
- Vaccination policy boosts traffic (~40% flu shots)
- Expanded pharmacist services = growth
- Reimbursement compression = margin pressure
Labor and immigration policy at state/local levels
Local workforce development programs such as WIOA support training for fresh/fuel/pharmacy teams; political shifts on immigration influence labor supply in distribution and stores and can increase turnover and recruitment spend.
TX/LA retail risks: tax, SNAP/WIC, hurricane exposure, pharmacy margin squeeze
Operating across Texas and Louisiana exposes Brookshire Brothers to diverging tax/sales rules (TX sales tax 6.25% state, combined max 8.25%), SNAP/WIC policy (SNAP ~41M recipients 2023; WIC ~6.6M 2022) and hurricane preparedness (NOAA 1991–2020 avg: 14 named storms). Pharmacy reimbursement pressures from Medicaid/Part D and expanded scope raise revenue opportunities but compress margins; federal min wage $7.25/hr affects labor costs.
| Issue | Metric | Impact |
|---|---|---|
| SNAP/WIC | 41M / 6.6M | Sales/traffic |
| Storm risk | 14 named storms avg | Inventory/fuel |
| Wages | $7.25 federal | Labor cost |
What is included in the product
Detailed Word Document
Explores how Political, Economic, Social, Technological, Environmental, and Legal forces uniquely impact Brookshire Brothers, with data-driven insights and region-specific examples to identify risks and opportunities. Designed for executives and advisors to support strategy, scenario planning, and investor communications.
Customizable Excel Spreadsheet
A concise, visually segmented PESTLE summary for Brookshire Brothers that can be dropped into presentations, shared across teams, and edited with notes to support quick alignment and risk discussions during planning sessions.
Economic factors
Inflation and consumer purchasing power
Food-at-home inflation, which rose about 2.7% in 2024, heightens price sensitivity and drives private-label trade-down in Brookshire Brothers stores. Volatile fuel — U.S. pump averages swung near $3.60/gal in 2024–25 — reduces trip frequency and convenience sales. Wage growth (~4% avg. annual) versus CPI determines real spending in core Texas/Louisiana communities. Margin management relies on pricing analytics and stronger vendor negotiations to protect margins.
Regional economic cycles in Texas and Louisiana
Energy-sector swings in Texas (crude production >5 million barrels/day) and Louisiana (roughly 10% of US natural gas output) directly affect household incomes and retail demand, tightening discretionary spend when prices or employment fall. Rural reliance on local plants makes Brookshire Brothers’ sales sensitive to openings/closures in small towns. Tourism peaks and college towns give seasonal uplift for select stores, while diversified formats across ~170 stores smooth cycle variability.
Supply chain costs and availability
Transportation rates, diesel (U.S. average ~4.12/gal in 2024 per EIA) and driver availability (industry shortfall ~60–80k drivers) directly increase landed cost—transport can represent ~10–15% of grocery COGS. Weather shocks in 2023–24 caused double-digit spikes in select produce and protein prices. Multi-sourcing and regional DC alignment cut out-of-stocks, while tighter vendor terms and shrink control (shrink ~1.5–2% of sales) protect gross margin.
Interest rates and capital expenditure
Higher interest rates (Federal funds ~5.25–5.50% mid-2025; CRE borrowing ~6–7%) raise the hurdle for remodels, refrigeration upgrades and fuel-site investments, increasing required returns. Lease-versus-own decisions shift toward leasing or vendor financing as cost of capital rises. Capex is being prioritized to high-ROI tech and energy-saving projects (paybacks often 3–7 years) while maintaining store standards to protect traffic and sales per sq ft.
- Higher financing costs raise capex hurdle
- Shift to leasing/vendor financing
- Priority: tech, LED, HVAC, solar (3–7yr payback)
- Store standards critical for traffic retention
Competitive dynamics and price perception
National discounters, dollar stores and club formats pressure Brookshire Brothers price image; Dollar General had about 19,000 stores in 2024 and Costco reported roughly 242 billion in FY2024 sales, intensifying price competition. Local independents compete on service and perishables, sustaining loyalty. Strategic promotions and loyalty offers can defend share. Convenience and pharmacy integration raise basket accretion and visit frequency.
- Discounters: large footprint (Dollar General ~19,000 stores 2024)
- Clubs: Costco ~242B net sales FY2024
- Local edge: service & perishables
- Defense: promos, loyalty, pharmacy-driven baskets
TX/LA retail risks: tax, SNAP/WIC, hurricane exposure, pharmacy margin squeeze
Food-at-home inflation ~2.7% (2024) and ~3.60/gal fuel (2024–25) push private‑label trade-down and reduce trips; wage growth ~4% shapes real spending in TX/LA. Energy jobs (TX crude >5mbd; LA ~10% US gas) and tourism/college seasonality drive store-level variance. Higher rates (Fed 5.25–5.50% mid‑2025) raise capex hurdles; transport/diesel (~$4.12/gal 2024) and driver shortfall (60–80k) lift COGS. Discounters (Dollar General ~19k stores) and Costco ($242B FY2024) pressure pricing.
| Metric | 2024/25 |
|---|---|
| Food inflation | 2.7% |
| Fuel (pump) | $3.60/gal |
| Diesel | $4.12/gal |
| Fed funds | 5.25–5.50% |
| Brookshire stores | ~170 |
What You See Is What You Get
Brookshire Brothers PESTLE Analysis
This Brookshire Brothers PESTLE Analysis summarizes key political, economic, social, technological, legal, and environmental factors affecting the regional grocery chain. It highlights opportunities, risks, and strategic implications for operations and growth. The preview shown here is the exact document you’ll receive after purchase—fully formatted and ready to use.
Original: $10.00
-65%$10.00
$3.50Description
Make Smarter Strategic Decisions with a Complete PESTEL View
Unlock how political regulation, regional economic trends, and shifting consumer preferences shape Brookshire Brothers’ competitive edge in our focused PESTLE snapshot. This concise overview pinpoints key risks and opportunities to inform smarter strategy and investment calls. Purchase the full PESTLE for a complete, actionable briefing ready for immediate use.
Political factors
State and local policy impacts in Texas and Louisiana
Operating primarily in Texas (no state income tax; state sales tax 6.25%, combined max 8.25%) and Louisiana exposes Brookshire Brothers to differing tax structures, incentives, and local ordinances. Changes in state food tax exemptions, fuel levies or pharmacy rules in either state directly affect pricing and margins. Local zoning and permitting dictate new store footprints, fuel canopies and pharmacy additions. Active engagement with municipal governments is essential for site approvals and community programs.
Public health and nutrition programs (SNAP/WIC)
Eligibility rules, reimbursement rates and tech requirements for SNAP/WIC—programs serving about 41 million SNAP recipients (2023) and ~6.6 million WIC participants (2022)—shape basket mix and traffic, with average SNAP benefits near 250–270 USD/month. eWIC/system updates require compliant POS and tightened inventory controls; full eWIC rollout completed by 2020. Emergency policy expansions have lifted volumes; any cuts would pressure sales in lower-income trade areas.
Disaster preparedness and emergency coordination
Gulf Coast politics around hurricane readiness drive Brookshire Brothers to prioritize storm inventory and fuel logistics, especially given the NOAA 1991–2020 seasonal average of 14 named storms, 7 hurricanes and 3 major hurricanes. Coordination with state emergency agencies accelerates store access and reopening after declarations. Federal and state focus on grid resiliency and fuel supply continuity directly affects operating stability. Active participation in community relief strengthens ties with local officials and emergency planners.
Healthcare policy affecting in-store pharmacies
Vaccination mandates and public health campaigns drove pharmacies to deliver a substantial share of adult vaccinations (pharmacies administer roughly 40% of flu shots), increasing foot traffic.
State regulatory moves expanding pharmacist scope (vaccinations, chronic care management) create revenue opportunities but heightened reimbursement squeeze reduces per-prescription margins.
- Medicaid/Part D influence reimbursement
- Vaccination policy boosts traffic (~40% flu shots)
- Expanded pharmacist services = growth
- Reimbursement compression = margin pressure
Labor and immigration policy at state/local levels
Local workforce development programs such as WIOA support training for fresh/fuel/pharmacy teams; political shifts on immigration influence labor supply in distribution and stores and can increase turnover and recruitment spend.
TX/LA retail risks: tax, SNAP/WIC, hurricane exposure, pharmacy margin squeeze
Operating across Texas and Louisiana exposes Brookshire Brothers to diverging tax/sales rules (TX sales tax 6.25% state, combined max 8.25%), SNAP/WIC policy (SNAP ~41M recipients 2023; WIC ~6.6M 2022) and hurricane preparedness (NOAA 1991–2020 avg: 14 named storms). Pharmacy reimbursement pressures from Medicaid/Part D and expanded scope raise revenue opportunities but compress margins; federal min wage $7.25/hr affects labor costs.
| Issue | Metric | Impact |
|---|---|---|
| SNAP/WIC | 41M / 6.6M | Sales/traffic |
| Storm risk | 14 named storms avg | Inventory/fuel |
| Wages | $7.25 federal | Labor cost |
What is included in the product
Detailed Word Document
Explores how Political, Economic, Social, Technological, Environmental, and Legal forces uniquely impact Brookshire Brothers, with data-driven insights and region-specific examples to identify risks and opportunities. Designed for executives and advisors to support strategy, scenario planning, and investor communications.
Customizable Excel Spreadsheet
A concise, visually segmented PESTLE summary for Brookshire Brothers that can be dropped into presentations, shared across teams, and edited with notes to support quick alignment and risk discussions during planning sessions.
Economic factors
Inflation and consumer purchasing power
Food-at-home inflation, which rose about 2.7% in 2024, heightens price sensitivity and drives private-label trade-down in Brookshire Brothers stores. Volatile fuel — U.S. pump averages swung near $3.60/gal in 2024–25 — reduces trip frequency and convenience sales. Wage growth (~4% avg. annual) versus CPI determines real spending in core Texas/Louisiana communities. Margin management relies on pricing analytics and stronger vendor negotiations to protect margins.
Regional economic cycles in Texas and Louisiana
Energy-sector swings in Texas (crude production >5 million barrels/day) and Louisiana (roughly 10% of US natural gas output) directly affect household incomes and retail demand, tightening discretionary spend when prices or employment fall. Rural reliance on local plants makes Brookshire Brothers’ sales sensitive to openings/closures in small towns. Tourism peaks and college towns give seasonal uplift for select stores, while diversified formats across ~170 stores smooth cycle variability.
Supply chain costs and availability
Transportation rates, diesel (U.S. average ~4.12/gal in 2024 per EIA) and driver availability (industry shortfall ~60–80k drivers) directly increase landed cost—transport can represent ~10–15% of grocery COGS. Weather shocks in 2023–24 caused double-digit spikes in select produce and protein prices. Multi-sourcing and regional DC alignment cut out-of-stocks, while tighter vendor terms and shrink control (shrink ~1.5–2% of sales) protect gross margin.
Interest rates and capital expenditure
Higher interest rates (Federal funds ~5.25–5.50% mid-2025; CRE borrowing ~6–7%) raise the hurdle for remodels, refrigeration upgrades and fuel-site investments, increasing required returns. Lease-versus-own decisions shift toward leasing or vendor financing as cost of capital rises. Capex is being prioritized to high-ROI tech and energy-saving projects (paybacks often 3–7 years) while maintaining store standards to protect traffic and sales per sq ft.
- Higher financing costs raise capex hurdle
- Shift to leasing/vendor financing
- Priority: tech, LED, HVAC, solar (3–7yr payback)
- Store standards critical for traffic retention
Competitive dynamics and price perception
National discounters, dollar stores and club formats pressure Brookshire Brothers price image; Dollar General had about 19,000 stores in 2024 and Costco reported roughly 242 billion in FY2024 sales, intensifying price competition. Local independents compete on service and perishables, sustaining loyalty. Strategic promotions and loyalty offers can defend share. Convenience and pharmacy integration raise basket accretion and visit frequency.
- Discounters: large footprint (Dollar General ~19,000 stores 2024)
- Clubs: Costco ~242B net sales FY2024
- Local edge: service & perishables
- Defense: promos, loyalty, pharmacy-driven baskets
TX/LA retail risks: tax, SNAP/WIC, hurricane exposure, pharmacy margin squeeze
Food-at-home inflation ~2.7% (2024) and ~3.60/gal fuel (2024–25) push private‑label trade-down and reduce trips; wage growth ~4% shapes real spending in TX/LA. Energy jobs (TX crude >5mbd; LA ~10% US gas) and tourism/college seasonality drive store-level variance. Higher rates (Fed 5.25–5.50% mid‑2025) raise capex hurdles; transport/diesel (~$4.12/gal 2024) and driver shortfall (60–80k) lift COGS. Discounters (Dollar General ~19k stores) and Costco ($242B FY2024) pressure pricing.
| Metric | 2024/25 |
|---|---|
| Food inflation | 2.7% |
| Fuel (pump) | $3.60/gal |
| Diesel | $4.12/gal |
| Fed funds | 5.25–5.50% |
| Brookshire stores | ~170 |
What You See Is What You Get
Brookshire Brothers PESTLE Analysis
This Brookshire Brothers PESTLE Analysis summarizes key political, economic, social, technological, legal, and environmental factors affecting the regional grocery chain. It highlights opportunities, risks, and strategic implications for operations and growth. The preview shown here is the exact document you’ll receive after purchase—fully formatted and ready to use.











